. 2024 Nov 26;43(11):114925.
doi: 10.1016/j.celrep.2024.114925. Epub 2024 Oct 30.

Muscle inflammation is regulated by NF-κB from multiple cells to control distinct states of wasting in cancer cachexia

Affiliations

Muscle inflammation is regulated by NF-κB from multiple cells to control distinct states of wasting in cancer cachexia

Benjamin R Pryce et al. Cell Rep. .

Abstract

Although cancer cachexia is classically characterized as a systemic inflammatory disorder, emerging evidence indicates that weight loss also associates with local tissue inflammation. We queried the regulation of this inflammation and its causality to cachexia by exploring skeletal muscle, whose atrophy strongly associates with poor outcomes. Using multiple mouse models and patient samples, we show that cachectic muscle is marked by enhanced innate immunity. Nuclear factor κB (NF-κB) activity in multiple cells, including satellite cells, myofibers, and fibro-adipogenic progenitors, promotes macrophage expansion equally derived from infiltrating monocytes and resident cells. Moreover, NF-κB-activated cells and macrophages undergo crosstalk; NF-κB+ cells recruit macrophages to inhibit regeneration and promote atrophy but, interestingly, also protect myofibers, while macrophages stimulate NF-κB+ cells to sustain an inflammatory feedforward loop. Together, we propose that NF-κB functions in multiple cells in the muscle microenvironment to stimulate macrophages that both promote and protect against muscle wasting in cancer.

Keywords: CP: Cancer; CP: Immunology; NF-κB; cancer cachexia; fibro-adipogenic progenitors; macrophages; muscle progenitor cells; pancreatic cancer.


Conflict of interest statement

Declaration of interests T.A.Z. is a scientific advisory board member of Emmyon, Inc. and PeleOS, LLC.

Figures
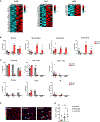
Figure 1.
Figure 1.. Muscle inflammation in cancer cachexia associates with macrophage accumulation
(A) Heatmaps of significant altered inflammatory genes (p < 0.05) probed from TA from cachexia mouse models (n = 3). (B) Flow cytometry analysis of the percentage of myeloid cells as a proportion of CD45+ cells in cachexia models (n = 3–5). (C) Flow cytometry analysis on lymphoid cells in cachexia models (n = 3–5). (D) CD11b (arrowheads) and dystrophin staining from non-cancer control patients, patients with PDAC that were weight stable, and patients with PDAC that were cachectic. Scale bars, 50 μm. (E) Total number of CD11b+ cells/field for control patients (n = 6), WT (n = 7), and cachectic (n = 8) patients; *p < 0.05, **p < 0.01. Comparisons to control groups were carried out using Student’s t test or Welch’s t test. Multiple group comparisons were carried out using one-way ANOVA with Dunnett’s test. Bars are ± SEM.
Figure 2.
Figure 2.. NF-κB functions in MuSCs and myofibers to regulate macrophage accumulation in cancer cachexia
(A) Expression of cytokines from LLC IKKβ fl/fl or Pax7-CreER; IKKβ fl/fl mice in TA muscle (n = 4/genotype). (B) Similar to (A) with the exception that gene expression was performed from mononuclear cells from hindlimb muscles (n = 3/genotype). (C) Volcano plot from RNA-seq analysis on mononuclear cells from LLC IKKβ fl/fl or Pax7-CreER; IKKβ fl/fl (n = 3/genotype) mice. (D) Gene Ontology analysis from RNA-seq analysis of similar samples to (B) (n = 3/genotype). (E) Chemokine expression in mononuclear cells from hindlimb muscles of LLC tumor-bearing IKKβ fl/fl or Pax7-CreER; IKKβ fl/fl mice (n = 3/genotype). (F) Immunofluorescence for CD11b and dystrophin on GAST from LLC IKKβ fl/fl or Pax7-CreER; IKKβ fl/fl mice, with respective fold changes shown for CD11b+ cells/field (n = 3/genotype). Scale bar, 50 μm. (G) Flow cytometry analysis of CD45+ and F4/80+ mononuclear cells from hindlimb muscles of LLC Pax7-CreER; IKKβ fl/fl mice (n = 3/genotype). (H) Cytokines and chemokine expression from TA of LLC IKKβ fl/fl or HSA-CreER; IKKβ fl/fl mice (n = 3/genotype). (I) Immunofluorescence for CD11b and dystrophin on GAST from LLC IKKβ fl/fl or HSA-CreER; IKKβ fl/fl mice, with respective fold changes shown in CD11b+ cells/field (n = 3/genotype). (J) Flow cytometry analysis of CD45+ and F4/80+ mononuclear cells, from hindlimb muscles of LLC HSA-CreER; IKKβ fl/fl mice (n = 3/genotype). Scale bar, 50 μm;*p < 0.05, **p < 0.01, and ***p < 0.001. Comparisons to IKKβfl/fl groups were carried out using Student’s t test. Bars are ± SEM.
Figure 3.
Figure 3.. Activated FAPs in cachectic muscle contain NF-κB that regulates macrophage accumulation
(A) UMAP of re-clustered FAPs generated from CD45 cell populations from control and C-26 muscles. (B) Proportion of FAP populations in (A) from control and C-26 muscles. (C) Violin plots of inflammatory genes in FAP populations. (D) UMAP of re-clustered FAPs generated from control and KPP muscles. (E) Proportion of FAP populations in (D) from control and KPP muscles. (F) Violin plots of inflammatory genes in FAP populations. (G) UMAP of re-clustered FAPs generated from CD45 cells in muscle from control and PDAC patient muscle. (H) Proportion of FAP populations in (G) from control and patients with PDAC. (I) Violin plots of inflammatory genes in FAP populations from patient samples. (J) Immunofluorescence staining of phosphorylated-(p) p65, PDGFRα, and dystrophin on TA from control and C-26 muscles. Scale bar, 10 μm. (K) Representative immunofluorescence staining of pp65, PDGFRα, and dystrophin on biopsy muscle samples from control, patients that were WT stable, and patients that were cachectic. Scale bar, 10 μm. (L) Immunostaining for CD11b (arrowheads) and dystrophin on TA samples from LLC IKKβ fl/fl or PDGFRα-CreER; IKKβ fl/fl mice, with respective fold changes shown for CD11b+ cells/field (n = 3/genotype). Scale bar, 50 μm. (M) TNF, IL-1β, IL-6, CCL2, CCL7, CXCL1, and CXCL2 expression was determined from TA in LLC IKKβ fl/fl or PDGFRα-CreER; IKKβ fl/fl mice (n = 3/genotype); *p < 0.05. Comparisons between two groups were carried out using Student’s t test or Welch’s t test. Bars are ± SEM.
Figure 4.
Figure 4.. Macrophage accumulation in cachectic muscle derives from both circulating monocytes and resident cells
(A) CCL2, CXCL1, and CXCL2 ELISAs from C2C12 myoblasts containing individual knockdown of CCL2, CXCL1, and CXCL2 chemokines. (B) Relative migration of RAW264.7 macrophages exposed to conditioned media from C2C12 control (scramble) myoblasts or myoblasts with individual knockdown of chemokines from (A). (C) Flow cytometry for macrophages in hindlimb muscles of LLC Pax7-CreER; CCL2 fl/fl. (D and E) (D) HSA-CreER; CCL2 fl/fl and (E) CCR2/ bone marrow-transplanted mice, compared to respective WT controls (CCL2 fl/fl or CCR2+/+ bone marrow transplants) (n = 3/genotype). (F) Flow cytometry plots of resident macrophages from mononuclear cells of C-26 cachectic skeletal muscle. (G) Representative graphic from flow cytometry of infiltrating (Ly6Chi) and resident (Ly6Clo) macrophages in skeletal muscle from C-26, LLC, and KPP models, compared to control (n = 3/group). (H) Graphic from flow cytometry of infiltrating (Ly6Chi) and resident (Ly6Clo) macrophages in skeletal muscle from LLC tumor-bearing mice from Pax7-CreER; IKKβ fl/fl, HSA-CreER; IKKβ fl/fl, and PDGFRα-CreER; IKKβ fl/fl mice, compared to littermate control muscles (n = 3/group); *p < 0.05, **p < 0.01, and ***p < 0.001. Comparisons between two groups were carried out using Student’s t test. Bars are ± SEM.
Figure 5.
Figure 5.. Macrophages exhibit distinct functions in skeletal muscle during cancer cachexia
(A) Design of clodronate treatment of C-26 mice. (B) Relative number of macrophages quantified by flow cytometry from muscle (n = 3/group), relative tumor mass (n = 5/group), and body mass (n = 5/group) of PBS- or clodronate-treated mice. (C) Hindlimb muscle mass following administration of PBS or clodronate (n = 5/group) in C-26 tumor-bearing mice. (D) Immunofluorescence staining with laminin (green) and major histocompatibility complex (MHC) IIA (red) of TA sections from C-26 mice injected with PBS or clodronate. Unstained fibers represent type IIB/X. Scale bar, 50 μm. (E) Measurements of type IIA and IIB/X fibers obtained from (D) (n = 4/group). (F) Expression of MuRF1 and Atrogin-1 from PBS and clodronate injected mice (n = 3/group). (G) Immunofluorescence staining of BrdU with laminin in C-26 mice injected with either PBS or clodronate (arrowheads indicate fused sublaminar BrdU+ nuclei). Scale bar, 10 μm. (H) Measurements of fused BrdU+ nuclei in myofibers obtained from (G) (n = 5/group). (I) Design for DTA treatment of LLC mice. (J) Macrophages quantified by flow cytometry from muscle (n = 3/group). Measurements of relative tumor (n = 4/group) and body mass (n = 4/group) in LLC mice following administration of DTA. (K) Immunofluorescence staining for BrdU with laminin in LLC mice injected with DTA. Scale bar, 10 μm. (L) Measurements of fused, sublaminar, BrdU+ nuclei in myofibers obtained from (K) (n = 4/group). (M) Measurements of relative TA muscle mass following DTA treatment in LLC tumor-bearing mice (n = 5/group). (N) Immunofluorescence staining with laminin (green) and MHC IIA (red) of TA from LLC mice injected with DTA. Unstained fibers represent type IIB/X. Scale bar, 50 μm (O) Quantitative measurements of type IIA and IIB/X fibers obtained from (N) (n = 4/group). (P) MuRF1 and Atrogin-1 expression in muscles from control or DTA-injected mice (n = 3/group); *p < 0.05 and **p < 0.01. Comparisons between two groups were carried out using Student’s t test. Bars are ± SEM.
Figure 6.
Figure 6.. Macrophages polarize to an anti-inflammatory state in cachectic muscle to maintain muscle size while inflammatory macrophages induce muscle atrophy
(A) Flow cytometry of unpolarized (CD86/CD206), pro-inflammatory (CD86+), anti-inflammatory (CD206+), and mixed (CD86+/CD206+) macrophages in skeletal muscle from control and C-26 mice at endpoint. (B) Flow cytometry analysis of macrophages, as shown in (A), from KPP muscles at indicated time points. (C) Phase contrast and immunofluorescence staining for MHC in C2C12 differentiating myoblasts co-cultured with pro-inflammatory or anti-inflammatory macrophages (Mac). Scale bars (upper panel), 100 μm; (lower panel), 30 μm. (D) Quantification of fused nuclei from (C). (E) Phase contrast images from C2C12 myotubes co-cultured with pro-inflammatory or anti-inflammatory macrophages (Mac). Scale bar, 100 μm. (F) Myotube diameter measurements from (E). (G) Myotube diameter following co-culturing with increasing ratio of anti-to pro-inflammatory macrophages; **p < 0.01 and ***p < 0.001. Multiple group comparisons were carried out using one-way ANOVA followed by Dunnett’s or Tukey’s multiple comparison test. Bars are ± SEM.
Figure 7.
Figure 7.. Macrophage subclusters enriched in KPP and cachectic patient muscles
(A) UMAP of CD45+ cells isolated from control and KPP muscles. (B) UMAP of re-clustered macrophage populations from (A) from control and KPP muscles. (C) Proportion of macrophage subclusters in (B) in control and KPP muscles. (D and E) GO Biological Processes analysis on Ccr2 (D) and Lyve1 (E) macrophage subclusters from KPP muscles; arrowheads indicate common ontologies. (F) Violin plots to discriminate between resident, infiltrating, and anti-inflammatory macrophages identified in (B). (G) UMAP of CD45+ cells isolated from control and PDAC patient muscle. (H) UMAP of macrophage subclusters from each patient sample in (G). (I) Proportion of macrophage subclusters in (H) from control and PDAC patient samples. (J and K) GO Biological Processes analysis on S100A9 (J) and LYVE1 (K) subclusters from control and patients with PDAC; arrowheads indicate common ontologies. (L) Violin plots for resident macrophage markers in subclusters identified in (H).

References

    1. Fearon K, Strasser F, Anker SD, Bosaeus I, Bruera E, Fainsinger RL, Jatoi A, Loprinzi C, MacDonald N, Mantovani G, et al. (2011). Definition and classification of cancer cachexia: an international consensus. Lancet Oncol. 12, 489–495. 10.1016/S1470-2045(10)70218-7. - DOI - PubMed
    1. Argiles JM, Busquets S, Stemmler B, and Lopez-Soriano FJ (2014). Cancer cachexia: understanding the molecular basis. Nat. Rev. Cancer 14, 754–762. 10.1038/nrc3829. - DOI - PubMed
    1. Siegel RL, Giaquinto AN, and Jemal A (2024). Cancer statistics, 2024. CA. Cancer J. Clin. 74, 12–49. 10.3322/caac.21820. - DOI - PubMed
    1. Bachmann J, Heiligensetzer M, Krakowski-Roosen H, Büchler MW, Friess H, and Martignoni ME (2008). Cachexia worsens prognosis in patients with resectable pancreatic cancer. J. Gastrointest. Surg. 12, 1193–1201. 10.1007/s11605-008-0505-z. - DOI - PubMed
    1. Nemer L, Krishna SG, Shah ZK, Conwell DL, Cruz-Monserrate Z, Dillhoff M, Guttridge DC, Hinton A, Manilchuk A, Pawlik TM, et al. (2017). Predictors of Pancreatic Cancer-Associated Weight Loss and Nutritional Interventions. Pancreas 46, 1152–1157. 10.1097/MPA.0000000000000898. - DOI - PMC - PubMed

Publication types

Associated data

LinkOut - more resources