. 2024 Nov;10(44):eado6607.
doi: 10.1126/sciadv.ado6607. Epub 2024 Oct 30.

Caspase-2 kills cells with extra centrosomes

Affiliations

Caspase-2 kills cells with extra centrosomes

Dario Rizzotto et al. Sci Adv. 2024 Nov.

Abstract

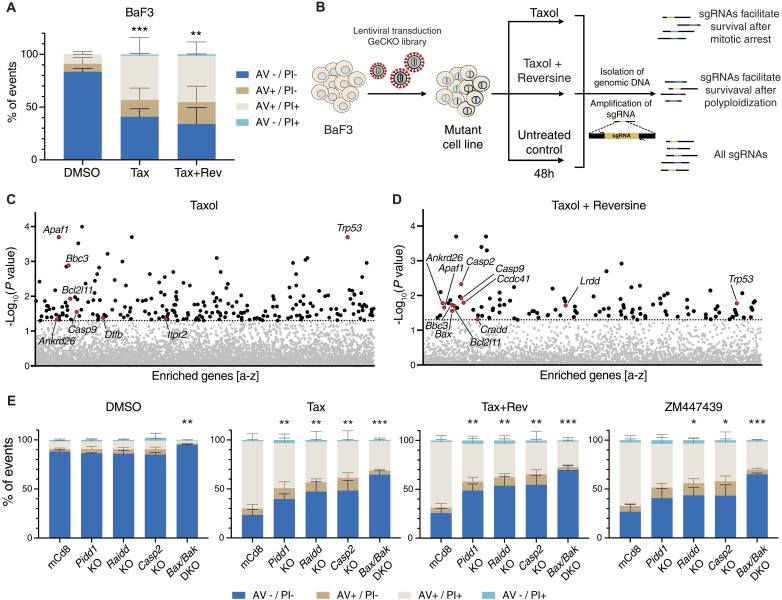
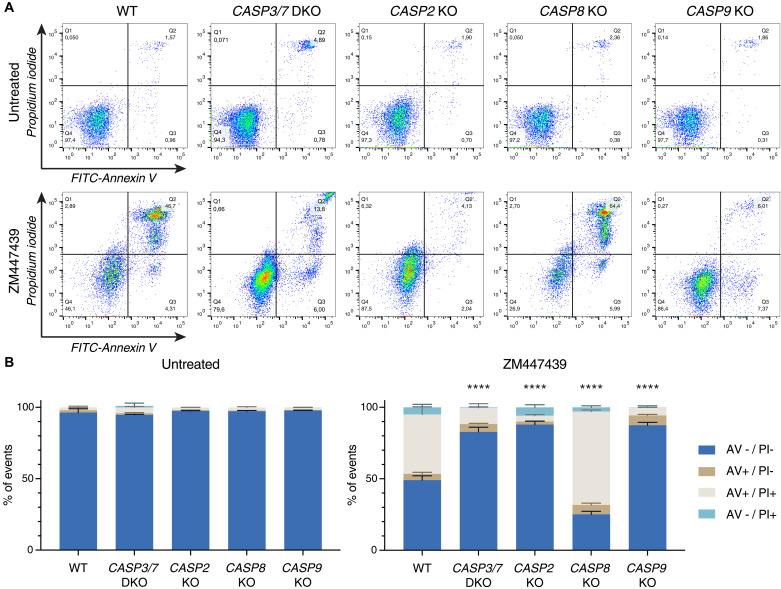
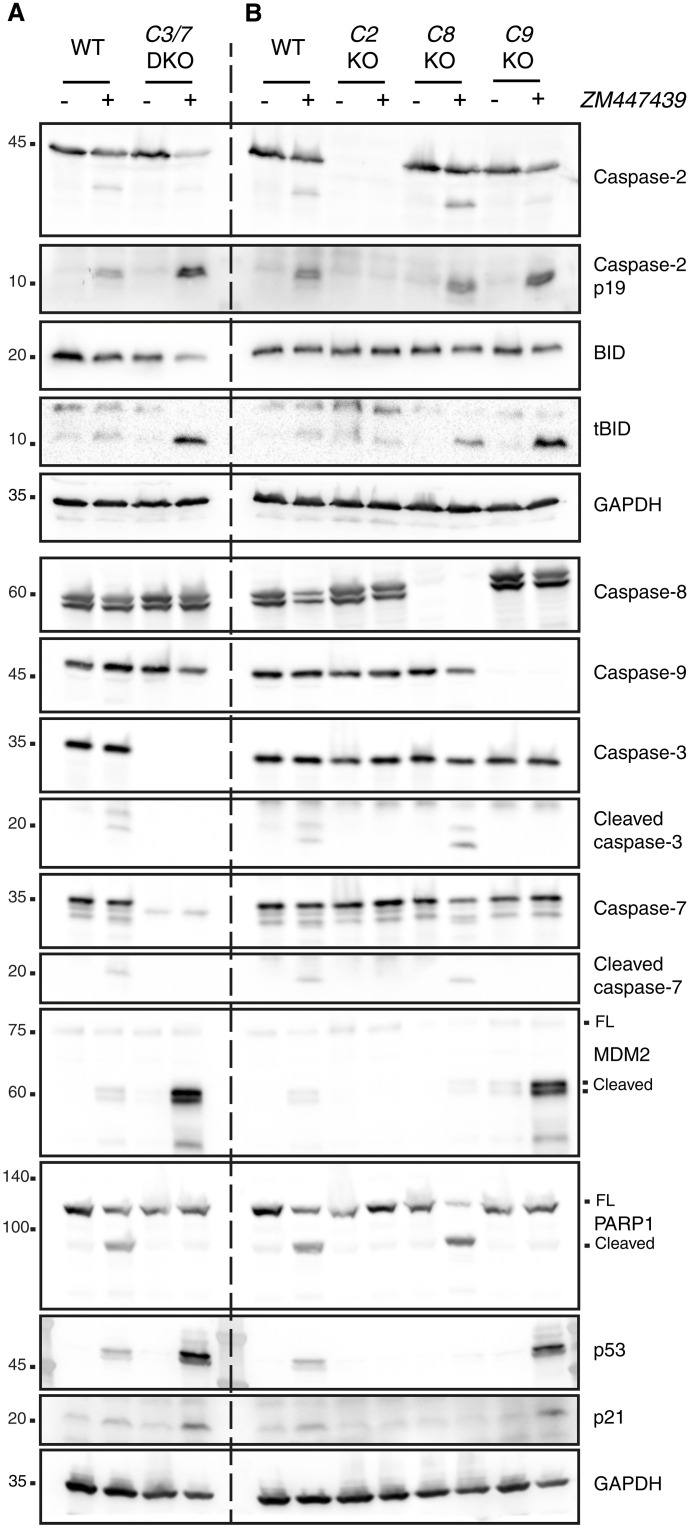
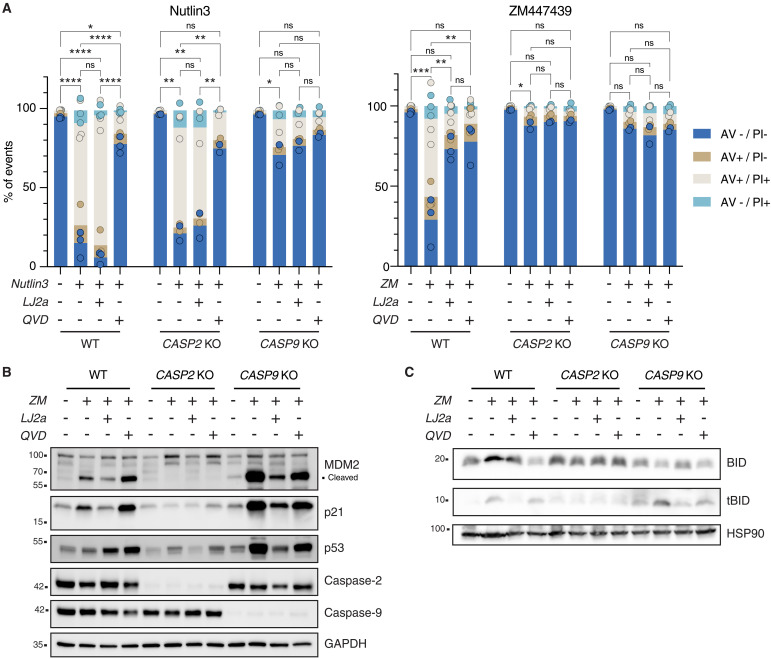
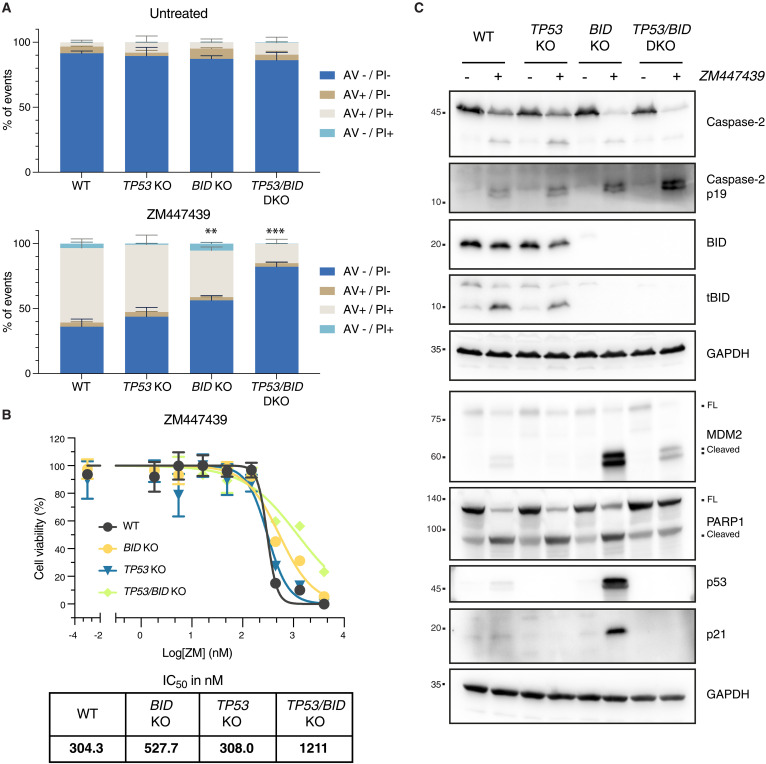
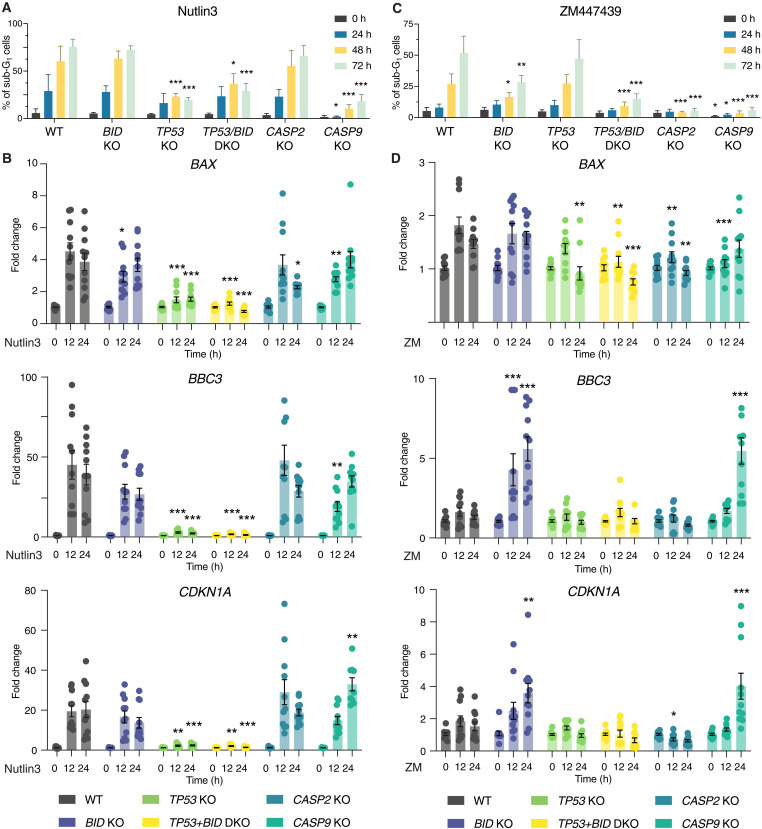
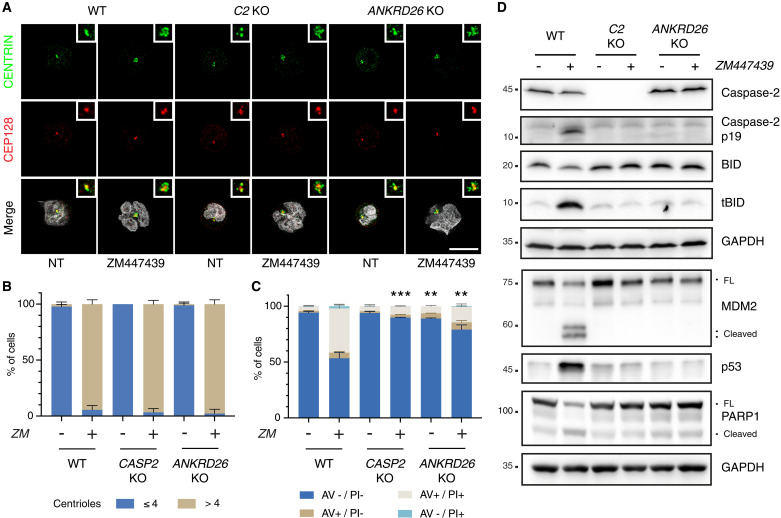
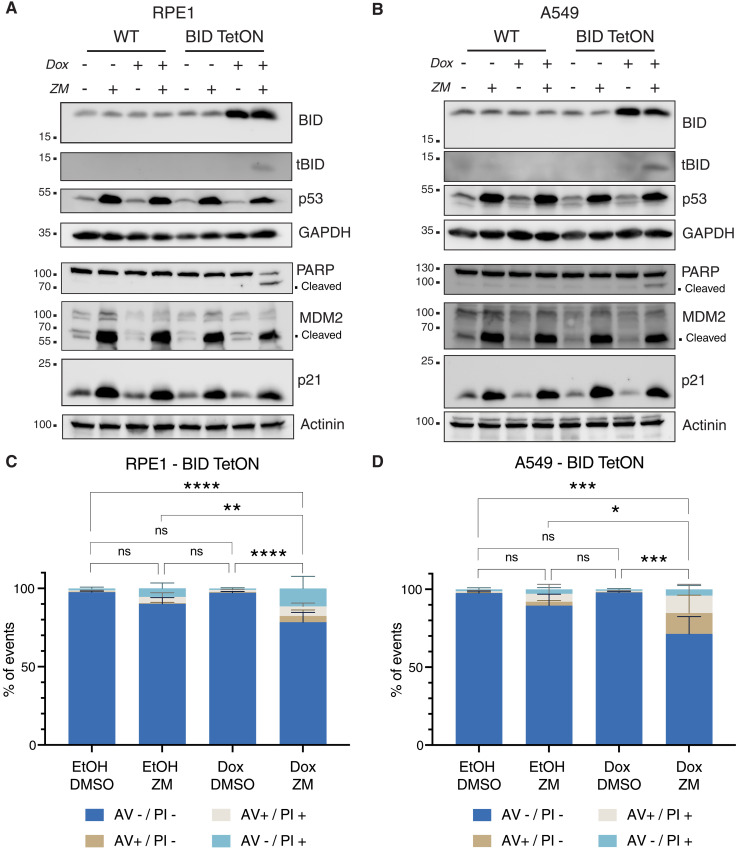
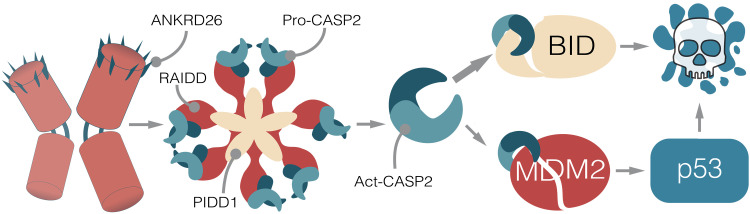
Centrosomes are membrane-less organelles that orchestrate a wide array of biological functions by acting as microtubule organizing centers. Here, we report that caspase-2-driven apoptosis is elicited in blood cells failing cytokinesis and that extra centrosomes are necessary to trigger this cell death. Activation of caspase-2 depends on the PIDDosome multi-protein complex, and priming of PIDD1 at extra centrosomes is necessary for pathway activation. Accordingly, loss of its centrosomal adapter, ANKRD26, allows for cell survival and unrestricted polyploidization in response to cytokinesis failure. Mechanistically, cell death is initiated upstream of mitochondria via caspase-2-mediated processing of the BCL2 family protein BID, driving BAX/BAK-dependent mitochondrial outer membrane permeabilization (MOMP). Remarkably, BID-deficient cells enforce apoptosis by engaging p53-dependent proapoptotic transcriptional responses initiated by caspase-2. Consistently, BID and MDM2 act as shared caspase-2 substrates, with BID being kinetically favored. Our findings document that the centrosome limits its own unscheduled duplication by the induction of PIDDosome-driven mitochondrial apoptosis to avoid potentially pathogenic polyploidization events.


Figures

Fig. 1.
Fig. 1.. A CRISPR screen identifies genes involved in the induction of cell death after mitotic perturbation.
(A) BaF3 cells were treated for 48 hours with 50 nM Taxol (Tax) alone or in combination with 500 nM reversine (Tax + Rev) before staining with annexin V (AV) and propidium iodide (PI) followed by flow cytometric analysis. Data are presented as means ± SD of the percentage of events in each staining condition. AV−/PI− = live cells; AV+/PI− = early apoptosis; AV+/PI+ and AV−/PI+ = late apoptosis. N = 3 independent biological replicates. Statistical significance calculated by unpaired t test on the percentage of live cells relative to the DMSO control. (B) Scheme of the CRISPR screen experimental setup. (C) Enriched sgRNAs found in surviving BaF3 cells after Taxol treatment (50 nM). Horizontal dashed line indicates the significance P value cutoff (0.05). See also fig. S2A. (D) Enriched sgRNAs in surviving BaF3 cells after Taxol + reversine treatment (50 nM + 500 nM). Horizontal dashed line indicates the significance P value cutoff (0.05). See also fig. S2B. (E) Annexin V/PI staining and flow cytometric analysis of control (mCd8), Pidd1 KO, Raidd KO, Casp2 KO, and Bak + Bax double KO (DKO) cells, 48 hours after treatment with Taxol (50 nM), Taxol + reversine (50 nM + 500 nM), ZM (2 μM), or DMSO. Data are presented as means ± SD of the percentage of events in each staining condition. N ≥ 3 independent biological replicates. Statistical significance calculated by unpaired t test on the percentage of live cells of each derivative clone relative to the mCd8 control for each drug treatment. See also fig. S2C. *P < 0.05; **P < 0.01; ***P < 0.001.
Fig. 2.
Fig. 2.. Caspase-2, caspase-9, or combined loss of effector caspase-3/caspase-7 protects Nalm6 cells from cytokinesis failure–induced cell death, but caspase-8 does not.
(A) Representative dot plots of annexin V/PI–stained Nalm6 WT cells or derivative KO clones after 48 hours of treatment with 2 μM ZM (or untreated controls). (B) Quantification of (A). Bar charts represent the means ± SD of the percentage of events in each staining condition. N ≥ 3 independent biological replicates. Statistical significance was calculated by unpaired t test on the percentage of live cells of each KO derivative clone compared to WT cells. ****P < 0.0001.
Fig. 3.
Fig. 3.. Caspase-2 acts upstream of caspase-9 to trigger apoptosis in Nalm6 cells experiencing cytokinesis failure.
(A) Western blot analysis of Nalm6 WT and a derivative clone deficient for effector caspase-3/caspase-7 (C3/7 DKO) after 48 hours of treatment with the Aurora kinase inhibitor ZM (2 μM). (B) Western blot analysis of Nalm6 WT or KO clones deficient for caspase-2 (C2 KO), caspase-8 (C8 KO), or caspase-9 (C9 KO) after 48 hours of treatment with 2 μM ZM. See also fig. S3.
Fig. 4.
Fig. 4.. Chemical caspase-2 inhibition reduces cytokinesis failure–dependent cell death.
(A) Nalm6 WT, caspase-2 KO, and caspase-9 KO cells were treated with 10 μM Nutlin3 or 2 μM ZM alone or in combination with the caspase-2 inhibitor LJ2a (10 μM) or the pan-caspase inhibitor Q-VD-OPh (QVD; 10 μM) or left untreated for 48 hours before staining with annexin V/PI followed by flow cytometric analysis. Bar charts represent the means of the percentage of events in each staining condition, the dots represent the values for each single replicate. Statistical significance was calculated on the percentage of live cells by one-way analysis of variance (ANOVA) with Tukey’s multiple-comparison correction, comparing each condition within the genotype. N ≥ 2 independent biological replicates. ns, not significant; *P < 0.05; **P < 0.01; ***P < 0.001; ****P < 0.0001. See also fig. S4. (B) Western blot analysis of Nalm6 WT, caspase-2 KO, and caspase-9 KO cells after 48 hours of treatment with 2 μM ZM, alone or in combination with the caspase-2 inhibitor LJ2a (10 μM) or the pan-caspase inhibitor QVD (10 μM) (or untreated controls). (C) Western blot analysis of Nalm6 cells as described in (B).
Fig. 5.
Fig. 5.. BID and MDM2 act as shared caspase-2 substrates in Nalm6 cells failing cytokinesis.
(A) Nalm6 WT, BID KO, TP53 KO, or combined TP53/BID (DKO) were treated for 48 hours with 2 μM ZM (or left untreated) before staining with annexin V/PI followed by flow cytometric analysis. Figure S5A reports an example experiment used for the quantifications shown here. Bar charts represent the means and SD of the percentage of events in each condition. Statistical significance was calculated by unpaired t test comparing each derivative clone to the WT cells. N = 3 independent biological replicates. **P < 0.01; ***P < 0.001. (B) Metabolic activity of Nalm6 WT cells and derivative clones deficient for p53, BID, or p53 and BID combined (DKO), as estimated by CellTiter-Glo assay after 72 hours of treatment with the indicated concentrations of ZM. Lines represent the nonlinear regression curves used to calculate the IC50 values reported on the bottom right table. (C) Western blot analysis of Nalm6 WT and derivative KO clones lacking BID, p53, or the combination of both after 48 hours of treatment with 2 μM ZM.
Fig. 6.
Fig. 6.. Loss of BID enables p53-dependent transcription in Nalm6 cells after cytokinesis failure.
(A) Quantification of the percentage of sub-G1 cells of different Nalm6 clones at different time points after 10 μM Nutlin3 treatment. Data are presented as means ± SD of N ≥ 3 independent biological replicates. Statistical significance was calculated by one-way ANOVA with Dunnett’s multiple-comparison testing, comparing each time point of the KO clones to the corresponding time point of the WT sample. *P < 0.05; **P < 0.01; ***P < 0.001. (B) RT-qPCR analysis of the p53 targets BAX, BBC3/PUMA, and CDKN1A/p21 of Nalm6 WT and derivative clones at different time points after 10 μM Nutlin3 treatment. Results are normalized over the housekeeping gene GAPDH and presented as fold change over the time point zero hour for each clone. Data are presented as means ± SEM, and individual points represent the values of N = 4 independent biological replicates. Statistical significance was calculated by one-way ANOVA with Dunnett’s multiple-comparison test, comparing each KO clone to the WT sample at the corresponding time point. *P < 0.05; **P < 0.01; ***P < 0.001. (C) Same as in (A), but after 2 μM ZM treatment. (D) Same as in (B), but after 2 μM ZM treatment.
Fig. 7.
Fig. 7.. Recruitment of PIDD1 to the centrosome via ANKRD26 is necessary for cytokinesis failure–dependent cell death.
(A) Representative immunofluorescence of Nalm6 WT, caspase-2, and ANKRD26 KO derivative clones untreated or treated with 2 μM ZM for 48 hours. Cells were costained with the indicated antibodies: CENTRIN (in green) and CEP128 (in red). Hoechst was used to visualize the DNA (gray in the merge). Scale bar, 5 μm. (B) Quantification of the number of centrioles of cells shown in (A). Data are presented as means ± SD (in percentage) of three independent biological replicates. For each replicate and condition, 30 cells were counted. (C) Percentage of Nalm6 WT, caspase-2 KO, and ANKRD26 KO derivative clones undergoing apoptosis after 48 hours of treatment with 2 μM ZM as detected by annexin V/PI staining and flow cytometric analysis. Data are presented as means ± SD of events in each staining condition (in percentage) of N = 3 independent biological replicates. Statistics were calculated by unpaired t test comparing the percentage of live cells of each KO clone to the corresponding treatment condition in the WT sample. **P < 0.01; ***P < 0.001. (D) Western blot showing Nalm6 WT cells or clones edited for caspase-2 or ANKRD26 after 48 hours of treatment with 2 μM ZM.
Fig. 8.
Fig. 8.. BID overexpression sensitizes epithelial cells to cell death after cytokinesis failure.
(A) Western blot of RPE1 cells, WT, or a derivative pool transduced with a Dox-inducible BID overexpression vector (BID TetON). Cells were treated for 24 hours with Dox (2.5 μg/ml) or solvent control (ethanol) in combination with 2 μM ZM, or DMSO, as control. (B) Same as in (A), but on A549 lung cancer cells. (C) Percentage of RPE1 BID TetON undergoing apoptosis upon treatment with 2 μM ZM and overexpression of BID, as detected by annexin V/PI staining in flow cytometric analysis. Bar charts represent the means ± SD of events in each staining condition (in percentage). Statistical significance was calculated by one-way ANOVA with Tukey’s multiple-comparisons test on N = 4 independent biological replicates. *P < 0.05; ***P < 0.001; ****P < 0.0001. (D) Same as in (C), but in A549 cells.
Fig. 9.
Fig. 9.. Proposed model of centrosome-dependent cell death.
Hematopoietic cells failing cytokinesis acquire extra centrosomes, leading to an ANKRD26-dependent activation of the PIDDosome multiprotein complex. This leads to the autoproteolytic cleavage of caspase-2 into its active form (Act-CASP2), which cleaves BID into its proapoptotic product tBID, leading to MOMP and cell death. If BID processing is prevented, the alternative caspase-2 substrate MDM2 becomes more prominently processed, leading to p53 stabilization. The transcriptional program imposed by p53 will result in the up-regulation of apoptotic effectors, ultimately leading to cell death.

Similar articles

References

    1. Breslow D. K., Holland A. J., Mechanism and regulation of centriole and cilium biogenesis. Annu. Rev. Biochem. 88, 691–724 (2019). - PMC - PubMed
    1. Douanne T., Stinchcombe J. C., Griffiths G. M., Teasing out function from morphology: Similarities between primary cilia and immune synapses. J. Cell Biol. 220, e202102089 (2021). - PMC - PubMed
    1. Insolera R., Shao W., Airik R., Hildebrandt F., Shi S.-H., SDCCAG8 regulates pericentriolar material recruitment and neuronal migration in the developing cortex. Neuron 83, 805–822 (2014). - PMC - PubMed
    1. Phan T. P., Holland A. J., Time is of the essence: The molecular mechanisms of primary microcephaly. Genes Dev. 35, 1551–1578 (2021). - PMC - PubMed
    1. Ganem N. J., Godinho S. A., Pellman D., A mechanism linking extra centrosomes to chromosomal instability. Nature 460, 278–282 (2009). - PMC - PubMed

MeSH terms

Substances