. 2024 Nov 5;121(45):e2405152121.
doi: 10.1073/pnas.2405152121. Epub 2024 Oct 30.

Pan-ErbB inhibition impairs cognition via disrupting myelination and aerobic glycolysis in oligodendrocytes

Affiliations

Pan-ErbB inhibition impairs cognition via disrupting myelination and aerobic glycolysis in oligodendrocytes

Xu Hu et al. Proc Natl Acad Sci U S A. .

Abstract

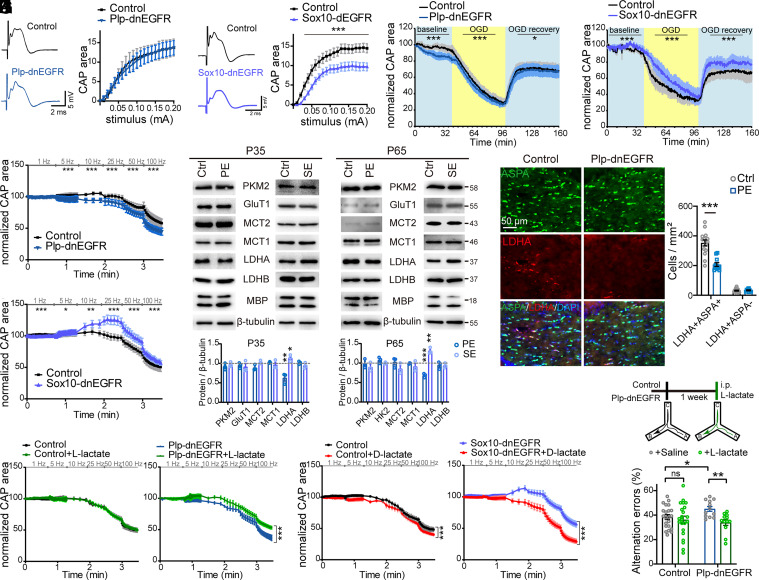
White matter (WM) abnormalities are an emerging feature of schizophrenia, yet the underlying pathophysiological mechanisms are largely unknown. Disruption of ErbB signaling, which is essential for peripheral myelination, has been genetically associated with schizophrenia and WM lesions in schizophrenic patients. However, the roles of ErbB signaling in oligodendrocytes remain elusive. Here, we used an in vivo pan-ErbB inhibition strategy and demonstrated the functions of endogenous ErbB receptors in oligodendrocytes. Through analyses of the cellular, histological, biochemical, behavioral, and electrophysiological differences in mice with manipulated ErbB activities in oligodendrocytes at different differentiation stages, we found that ErbB signaling regulates myelination and aerobic glycolysis in oligodendrocytes, and both functions are required for working memory. ErbB inhibition in oligodendrocytes at early differentiation stages induces hypomyelination by suppressing the myelinating capacity of newly formed oligodendrocytes. In contrast, ErbB inhibition in mature oligodendrocytes alters neither myelination nor oligodendrocyte numbers, but accelerates axonal conduction decline under energy stress. Mechanistically, ErbB inhibition attenuates K-Ras activities, leading to the reduced expression of lactate dehydrogenase A that promotes aerobic glycolysis in mature oligodendrocytes. Supplementation of L-lactate restores axonal conduction and working memory capacity that are suppressed by ErbB inhibition in mature oligodendrocytes. These findings emphasize the indispensable roles of ErbB signaling in WM integrity and function and provide insights into the multifaceted contributions of WM abnormalities to cognitive impairment.

Keywords: ErbB signaling; lactate; myelin; oligodendrocyte differentiation stage; working memory.


Conflict of interest statement

Competing interests statement:The authors declare no competing interest.

Figures

Fig. 1.
Fig. 1.
ErbB inhibition induces hypomyelination in Sox10-dnEGFR mice, but not in Plp-dnEGFR mice. (A and B) Activation of ErbB receptors (pErbB) by HB-EGF, EGF, or NRG1 treatments for 10 min in OPCs (A) and differentiated OLs (B). The immunofluorescence results indicate the synchronized OL stages in vitro. (C and D) Representative (C) and statistical western blotting results (D) of the white matter from Sox10-dnEGFR (SE) and littermate controls (Ctrl). (E) Phosphorylation of ErbB receptors examined in NFOs purified from indicated mice at indicated ages by western blotting. (F) Electron microscope images of the corpus callosum (CC), optic nerve (ON), and prefrontal cortex (PFC) from Sox10-dnEGFR and littermate controls at 44 dwd. g-ratio was calculated for myelinated axons and averaged g-ratio were analyzed by unpaired t test. (G-J) Western blotting results of the white matter (G, H), purified NFOs (I), as well as electron microscope (J) for Plp-dnEGFR (PE) and littermate controls (Ctrl) at indicated ages. In (F), Ctrl n = 4, SE n = 3 for CC; Ctrl n = 4, SE n = 5 for ON; Ctrl n = 3, SE n = 3 for PFC. In (J), n = 3 for each group. For (D, E, H, I), shown are data of indicated mice that have been normalized by those of littermate controls. n = 3 pairs for each group.
Fig. 2.
Fig. 2.
ErbB inhibition induces OL number increases in Sox10-dnEGFR mice, but not in Plp-dnEGFR mice. (A and B) Olig2+, CC1+, and NG2+ cells in the CC of indicated mice at indicated ages were examined by immunostaining. (C and D) Statistical results of Olig2+, CC1+Olig2+, and NG2+ cell densities in the CC of Sox10-dnEGFR mice (SE) and littermate controls (Ctrl) at P65 with 44 dwd, or Plp-dnEGFR mice (PE) and littermate controls at P65 with 44 dpd. Data were from repeated immunostaining of three mice for each group. (EG) Representative images (E and F) and the ratio of densities of proliferating OL-lineage cells (Olig2+Ki67+) to those of total Olig2+ OLs (G, n = 3 for each group) examined in indicated mice at indicated ages. (H) Temporal expression levels of dnEGFR in primarily cultured OPCs examined by real-time RT-PCR. Note that dnEGFR increased in Sox10-dnEGFR (SE) OPCs with Dox treatments for over 2 d, whereas it was not expressed in Plp-dnEGFR (PE) OPCs, n = 3. (I) Time course variation of ErbB phosphorylation levels in response to EGF or NRG1 in cultured OPCs from indicated mice. Statistical data were pErbB/β-tubulin ratio after normalization to vehicle treatment (Veh) in each batch of experiments and analyzed by the paired t test. *P < 0.05, **P <0.01, Ctrl-EGF vs. SE-EGF; #P < 0.05, ##P <0.01, Ctrl-NRG1 vs. SE-NRG1, n = 3. (J) Proliferating OPCs (EDU+PDGFRα+) in response to EGF (treatments for 1 d) examined in OPCs purified from indicated mice with or without Dox treatments for 4 d. For SE OPCs in comparison with control OPCs: Ctrl with vehicle treatments (veh), n = 10; SE with veh, n = 9; Ctrl with EGF treatments (EGF), n = 10; SE with EGF, n = 7. For PE OPCs in comparison with control OPCs: Ctrl with veh, n = 10; PE with veh, n = 10; Ctrl with EGF, n = 9; PE with EGF n = 9.
Fig. 3.
Fig. 3.
ErbB inhibition impairs the myelinating capacity of NFOs. (A) Heat maps of Z value are presented for 68 genes with similar expression tendencies in the WM of Sox10-ErbB2V664E (soxEb vs. treEb) and Sox10-dnEGFR (soxEG vs. treEG) mice as identified by RNA-seq analyses of WM tissues isolated from three pairs of Sox10-ErbB2V664E and littermate control mice at P30 with 9 dwd, or Sox10-dnEGFR and littermate control mice at P35 with 14 dwd. The detailed RNA-seq data have been deposited in the GEO and SRA database and can be found at GEO: GSE123491. (B) Transcription levels of characteristic genes of OLs at different differentiation stages in the WM of indicated mice. Shown are real-time RT-PCR results of indicated mice that have been normalized by those of littermate controls. Mouse pairs for each group n = 3. (C) In situ hybridization results of Enpp6 and immunostaining results of TCF4 in the CC of indicated mice at indicated ages. (D) Statistical analyses of Enpp6+ or TCF+ cell densities, as well as the percentages of NFOs in total OLs (TCF4+/Olig2+) in Sox10-dnEGFR (SE) mice and littermate controls (Ctrl) at P35 or P65. Data were from repeated immunostaining of three mice for each group. (E) Temporal expression levels of dnEGFR in cultured Sox10-dnEGFR (SE) and control (Ctrl) OLs at different days after triiodothyronine (T3) induction as examined by real-time RT-PCR, n = 3. (F) Time course variation of ErbB phosphorylation levels in response to EGF or NRG1 in cultured NFOs from indicated mice after 2-d T3 induction. Statistical data were pErbB/β-tubulin ratio after normalization to vehicle treatment (Veh) in each batch of experiments and analyzed by the paired t test. *P < 0.05, Ctrl-EGF vs. SE-EGF; #P < 0.05, Ctrl-NRG1 vs. SE-NRG1 n = 3. (G) Newly myelinating OLs (MBP+) induced by EGF or NRG1 from OPCs after 1-d T3 induction. For analysis of Sox10-dnEGFR (SE) NFOs: Control (Ctrl) with vehicle treatment (veh) n = 9, SE with veh n = 10; Ctrl with EGF treatment (EGF) n = 10, SE with EGF n = 9; Ctrl with NRG1 treatment (NRG1) n = 9, SE with NRG1 n = 10. For analysis of Plp-dnEGFR (PE) NFOs: Ctrl with veh n = 10, PE with veh n = 10; Ctrl with EGF n = 10, PE with EGF n = 10; Ctrl with NRG1 n = 10, PE with NRG1 n = 10. (H) Immunostaining results of MOs (ASPA+Olig2+) in the CC of Sox10-dnEGFR (SE) and littermate controls (Ctrl) at indicated ages. Statistical data of ASPA+ cell densities and the ratio of ASPA+ to Olig2+ cell numbers were from repeated immunostaining of three mice for each group.
Fig. 4.
Fig. 4.
ErbB inhibition in MOs impairs working memory in the absence of myelin alteration. Behavioral performance of adult Sox10-dnEGFR mice with littermate controls, or Plp-dnEGFR mice with littermate controls. (A-F) Behavioral performance of adult Sox10-dnEGFR mice and littermate controls. (G-L) Behavioral performance of adult Plp-dnEGFR mice and littermate controls. Shown are motor coordination assessed by the rotarod test (A and G), locomotive activity assessed by open field tests (B and H), zone analysis of open field tests (C and I), social interests assessed by social interaction tests (D and J), sensory gating assessed by PPI tests (E and K), and working memory assessed by the eight-arm radial water maze test (F and L). In (A), controls n = 12, Sox10-dnEGFR n = 12. In (B and C), control n = 11, Sox10-dnEGFR n = 13. In (D), control n = 12, Sox10-dnEGFR n = 13. In (E), control n = 10, Sox10-dnEGFR n = 12. In (F), control n = 7, Sox10-dnEGFR n = 12. In (G), control n = 13, Plp-dnEGFR n = 12. In (H and I), control n = 19, Plp-dnEGFR n = 14. In (J), control n = 14, Plp-dnEGFR n = 13. In (K), control n = 14, Plp-dnEGFR n = 12. In (L), control n = 10, Plp-dnEGFR n = 14. Data were analyzed by two-way ANOVA test, except for those from the visible platform test in eight-arm radial water maze that were analyzed by the unpaired t test. Illustrative examples of the travel pathways of control or mutant mice were included in (D, F, J, and L). In illustrative examples in (F and L), green circles indicate the last arms with a hidden platform, while red crosses indicate the arms with used platforms in the past three trials.
Fig. 5.
Fig. 5.
ErbB inhibition in MOs suppresses LDHA expression and axonal conduction under energy stress. (A and B) Axonal excitability is similar in Plp-dnEGFR ONs and control nerves (A), but decreased in Sox10-dnEGFR ONs in comparison with controls (B). CAPs of ONs generated by electrical stimuli with intensities at stepped increase (0 to 0.2 mA) were recorded ex vivo. Data were from 3 to 7 ONs of 3 to 5 mice for each group. (C and D) Normalized CAPs generated with stimuli at maximal intensities were declined by OGD for Plp-dnEGFR (C) and Sox10-dnEGFR ONs (D). OGD was started for the recorded nerves after 1-h baseline stimulation, and stopped after another hour by restoring the bathing media to oxygenated ACSF. Initial CAPs were recorded after 30-min baseline stimulation. The areas under CAPs were measured and normalized to the initial levels. Data were from 4 to 8 ONs of 3 to 5 mice for each group. (E and F) Normalized CAPs generated in ONs from indicated mice with stimuli at frequency changes from 5 to 100 Hz. Data were from 4 to 8 ONs of 3 to 5 mice for each group. (G) Indicated proteins examined by western blotting in the WM of Sox10-dnEGFR (SE) mice or Plp-dnEGFR (PE) mice, in comparison with that of littermate controls (Ctrl). (H) Statistical results of experiments in (G). Data of the protein levels in WM of indicated mice have been normalized by those of littermate controls. n = 3 for each group. (I) Immunostaining results of LDHA and ASPA in the CC of Plp-dnEGFR and littermate control mice at P65. Statistical data were from repeated immunostaining of three mice for each group. (J) L-lactate restored the declined CAPs in Plp-dnEGFR ONs. Data were from 6 to 10 ONs of 3 to 5 mice for each group. (K) D-lactate suppressed the expanded CAPs in Sox10-dnEGFR ONs. Data were from 5 to 12 ONs of 3 to 6 mice for each group. (L) Working memory deficits in Plp-dnEGFR mice were rescued by systemic L-lactate as assessed by the Y maze test. Control with saline or L-lactate n = 22; Plp-dnEGFR with saline or L-lactate n = 12.
Fig. 6.
Fig. 6.
K-Ras mediates the effect of ErbB receptors on LDHA expression in MOs. (A) Heat maps of Z value are presented for 50 genes with opposite expression tendencies in the WM of Sox10-ErbB2V664E (soxEb vs. treEb) and Sox10-dnEGFR (soxEG vs. treEG) mice as identified by RNA-seq analyses. (B) Active K-Ras (K-Ras-GTP) levels in WM from Plp-dnEGFR (PE) or Sox10-dnEGFR (SE) mice and their littermate controls (Ctrl) at P65. n =3 for each group in statistical results. (C) ErbB ligands in WM tissues of Plp-dnEGFR (PE) or Sox10-dnEGFR (SE), and their littermate controls mice (Ctrl) were examined by western blotting. n = 3 for each group in statistical results. (D) Temporal expression levels of dnEGFR in cultured Plp-dnEGFR OLs after different days of T3 induction as examined by real-time RT-PCR. OL maturation levels were represented by transcriptional levels of myelin protein MOBP. n = 3. (E) Time course variation of ErbB phosphorylation levels in response to EGF or NRG1 in cultured MOs from indicated mice after 6-d T3 induction. Statistical data were pErbB/β-tubulin ratio after normalization to vehicle treatment (Veh) in each batch of experiments and analyzed by the paired t test. *P < 0.05, Ctrl-EGF vs. SE-EGF; #P < 0.05, Ctrl-NRG1 vs. SE-NRG1. n = 3. (F and G) Representative western blotting (F) and immunostaining (G) results of LDHA alteration induced by EGF treatments or EGF+BI-2852 cotreatments for 1 d in control MOs (Ctrl) or EGF treatments in Plp-dnEGFR MOs (PE), respectively. MOs (MBP+) were maintained in vitro for 6 or more days after differentiation induced by T3. (H) Statistical results of the ratio of LDHA levels induced by EGF treatments to those of vehicle treatments (Veh) in control MOs (Ctrl), Plp-dnEGFR MOs (PE), or control MOs with BI-2852 treatments (Ctrl+BI), as examined by western blotting, immunostaining, and real-time RT-PCR. For WB and real-time RT-PCR, n = 3 for each group. For IF, Ctrl, n = 7; PE, n = 7; Ctrl+BI, n = 6. (I) Western blotting results of LDHA alteration induced by EGF treatments for 1 d in control MOs (Ctrl) or KRA-533 (1.0 μM) treatments for 1 d in Plp-dnEGFR MOs (PE). (J) Statistical results of the ratio of LDHA levels induced by EGF treatments to those of vehicle treatments (Veh) in control MOs (Ctrl-EGF), or KRA-533 treatments to those of vehicle treatments in Plp-dnEGFR MOs (PE-KRA). n = 3 for each group. (K) Real-time RT-PCR results of LDHA alteration induced by 0.5 μM (PE-KRA-0.5) or 1.0 μM KRA-533 (PE-KRA-1.0) for 1 d in Plp-dnEGFR MOs in comparison with vehicle treatments in Plp-dnEGFR MOs (PE-Veh). E3E4 stands for primers detecting ldha CDS sequence across exon 3 and exon 4. E5E6 stands for primers detecting ldha CDS sequences across exon 5 and exon 6. n =3 for each group. (L) Schematic illustration of the effects of ErbB signaling that promote the myelinating capacity in NFOs and aerobic glycolysis in MOs.

Comment in

References

    1. Peters B. D., Karlsgodt K. H., White matter development in the early stages of psychosis. Schizophr. Res. 161, 61–69 (2015). - PMC - PubMed
    1. Uranova N. A., Vikhreva O. V., Rachmanova V. I., Orlovskaya D. D., Ultrastructural alterations of myelinated fibers and oligodendrocytes in the prefrontal cortex in schizophrenia: A postmortem morphometric study. Schizophr. Res. Treat. 2011, 325789 (2011). - PMC - PubMed
    1. Kelly S., et al. , Widespread white matter microstructural differences in schizophrenia across 4322 individuals: Results from the ENIGMA Schizophrenia DTI Working Group. Mol. Psychiatry 23, 1261–1269 (2018). - PMC - PubMed
    1. Allen N. C., et al. , Systematic meta-analyses and field synopsis of genetic association studies in schizophrenia: The SzGene database. Nat. Genet. 40, 827–834 (2008). - PubMed
    1. Mei L., Nave K. A., Neuregulin-ERBB signaling in the nervous system and neuropsychiatric diseases. Neuron 83, 27–49 (2014). - PMC - PubMed

LinkOut - more resources