. 2024 Dec 1;35(12):ar147.
doi: 10.1091/mbc.E24-09-0402. Epub 2024 Oct 30.

EB-SUN, a new microtubule plus-end tracking protein in Drosophila

Affiliations

EB-SUN, a new microtubule plus-end tracking protein in Drosophila

Sun K Kim et al. Mol Biol Cell. .

Abstract

Microtubule (MT) regulation is essential for oocyte development. In Drosophila, MT stability, polarity, abundance, and orientation undergo dynamic changes across developmental stages. In our effort to identify novel microtubule-associated proteins that regulate MTs in the Drosophila ovary, we identified a previously uncharacterized gene, CG18190, which encodes a novel MT end-binding (EB) protein, which we propose to name EB-SUN. We show that EB-SUN colocalizes with EB1 at growing MT plus-ends in Drosophila S2 cells. Tissue-specific and developmental expression profiles from Paralog Explorer reveal that EB-SUN is predominantly expressed in the ovary and early embryos, while EB1 is ubiquitously expressed. Furthermore, as early as oocyte determination, EB-SUN comets are highly concentrated in oocytes during oogenesis. EB-SUN knockout (KO) results in decreased MT density at the onset of mid-oogenesis (stage 7) and delays oocyte growth during late mid-oogenesis (stage 9). Combining EB-SUN KO with EB1 knockdown (KD) in germ cells significantly further reduces MT density at stage 7. Hatching assays of single protein depletion reveal distinct roles for EB-SUN and EB1 in early embryogenesis, likely due to differences in their expression and binding partners. Notably, all eggs from EB-SUN KO/EB1 KD females fail to hatch, suggesting partial redundancy between these proteins.


Conflict of interest statement

Conflicts of interest: The authors declare no financial conflict of interest.

Figures

FIGURE 1:
FIGURE 1:
EB-SUN (CG18190) is an EB protein in Drosophila. (A) Protein alignment of EB-SUN with EB1 (isoform PB). The Calponin Homology (CH) domain is indicated by bold, underlined text, and the putative coiled-coil domain is highlighted in yellow. An asterisk (*) indicates residues identical in both sequences; a colon(:) represents conserved substitutions; and a period(.) indicates semiconserved substitutions (as defined in Clustal Omega). (B) RFP-tagged EB-SUN localizes to the plus ends of MTs in S2 cells. Scale bar, 10 µm. (See Supplemental Movie S1).
FIGURE 2:
FIGURE 2:
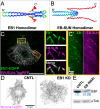
EB-SUN and EB1 localization and structure. (A) AlphaFold accurately predicts the homodimerization of EB1, consistent with previously reported crystal structures. (B) AlphaFold predicts that EB-SUN also forms a homodimer through interactions in the coiled-coil domain, with the N-terminus (The beginning of the coiled-coil domain) oriented to the left and the C-terminus to the right (dark blue for the most confidently predicted regions, via light blue and yellow to orange/red for the regions of very low confidence, as described in AlphaFold). (C) EB-SUN and EB1 colocalize at the growing tips of MTs in S2 cells. (C’) Kymographs showing tip-tracking of EB1 (green) and EB-SUN (magenta). (D) EB-SUN comets are present in both control and EB1-depleted cells. (D) Immunoblot shows about an approximately 70% decrease in EB1 protein levels, confirming EB1 KD. α-Tubulin was used as a loading control. Scale bar, 10 µm. (See Supplemental Movie S2).
FIGURE 3:
FIGURE 3:
Tissue-specific and developmental expressions of EB-SUN and EB1 in Drosophila. (A) Bar graph showing tissue-specific expression levels of EB-SUN and EB1, generated using Paralog Explorer. Unlike EB1, EB-SUN exhibits strong ovary-specific expression (Pearson correlation value: 0.2504). (B) EB-SUN and EB1 appear to be expressed simultaneously during development. EB-SUN is predominantly expressed in early embryos and adult females (Pearson correlation value: 0.1638). Reads Per Kilobase Million (RPKM) is a normalized measure of gene expression used in Paralog Explorer.
FIGURE 4:
FIGURE 4:
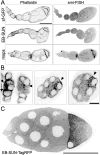
Localization of EB-SUN in Drosophila ovary. (A) smi-FISH staining of sf-GFP (negative control), EB-SUN, and msps mRNA (positive control). While msps mRNA is concentrated in oocytes as previously shown, there is no enrichment of EB-SUN mRNA in oocytes. (B) EB-SUN protein is enriched during oocyte fate determination as early as the two pro-oocyte stage. Arrowheads indicate oocytes. Scale bar, 10 µm. (See Supplemental Movie S3) (C) During mid-oogenesis, EB-SUN comets are enriched at the anterior cortex of the oocyte, forming a gradient. Scale bar, 100 µm. (See Supplemental Movie S4).
FIGURE 5:
FIGURE 5:
Impact of EB-SUN KO on MTs during oogenesis. (A) Immunoblot of ovary extracts from control and homozygous EB-SUN KO fly lines generated in this study, showing specific depletion of EB-SUN without affecting EB1. α-Tubulin was used as a loading control. (B) MT density in the nurse cells was measured. Depletion of EB-SUN causes a decrease in the overall MT density in nurse cells at ST7, where MTs undergo reorganization (p = 0.24 for ST6, p = 0.03 for ST7, p = 0.81 for ST8, p = 0.11 for ST9). Data are represented as the mean with 95% CI. A multiple unpaired t test with Welch's correction was performed. For control egg chambers: N = 11 (ST6); N = 11 (ST7); N = 6 (ST8); N = 17 (ST9). For EB-SUN KO egg chambers: N = 12 (ST6); N = 9 (ST7); N = 8 (ST8); N = 12 (ST9). (C) F-actin and β-tubulin staining showing differences in MT density in the nurse cells of control and EB-SUN KO egg chambers at ST7. Scale bar, 50 µm.
FIGURE 6:
FIGURE 6:
Oocyte growth is delayed in EB-SUN KO during late mid-oogenesis. (A) In early ST9, the size of homozygous EB-SUN KO oocytes is smaller than that of controls. However, by late ST9, oocytes in the EB-SUN KO catch up to a size similar to that of controls. Scale bar, 100 µm. (B) Schematic illustrating how early and late stages were defined based on border cell migration. (C) Hatching rate of homozygous EB-SUN KO fly lines. The hatching assay was performed by counting the number of hatched eggs 24 h after laying. Data are represented as the mean with 95% CI. N = 420 for control; N = 378 for EB-SUN KO from 12 independent collections. Two-tailed unpaired t tests were performed. (D) The fraction of oocyte size relative to the total area of the egg chamber was measured in early and late ST9. Oocytes in EB-SUN KO are significantly smaller than those in controls at early ST9, but there is no difference at late ST9 (p = 0.0053 for early ST9, p = 0.561 for late ST9). For controls: N = 19 (early ST9), N = 31 (late ST9); For EB-SUN KO: N = 39 (early ST9), N = 20 (late ST9). (E) Quantification of the egg chamber area at ST9 in both control and EB-SUN KO shows no significant difference. N = 50 for control; N = 59 for EB-SUN KO. Error bars represent 95% CI. Two-tailed unpaired t tests were performed.
FIGURE 7:
FIGURE 7:
Impact of EB-SUN KO/EB1 KD on MTs during oogenesis and embryogenesis. (A) MT density in the nurse cells was measured. Depletion of both EB-SUN and EB1 causes a significant decrease in the overall density of MTs in the nurse cells at ST7, where MTs undergo reorganization. Data are represented as mean with 95% CI. One-way ANOVA with Tukey's multiple comparisons test was performed for each stage (p = 0.027 for EB1 KD; p = 0.0056 for EB-SUN KO/EB1 KD at ST7). For control egg chambers: N = 4 ST6; N = 7 ST7; N = 7 ST8; N = 6 ST9. For EB1 KD egg chambers: N = 6 ST6; N = 8 ST7; N = 3 ST8; N = 7 ST9. For EB-SUN KO/EB1 KD egg chambers: N = 6 ST6; N = 11 ST7; N = 9 ST8; N = 10 ST9.(B) Quantification of the number of eggs that hatched 24 h after laying. Data are represented as mean with 95% CI. N = 522 for control; N = 378 for EB1 KD; N = 91 for EB-SUN KO/EB1 KD from 14 independent collections. Multiple unpaired t test with Welsh correction was performed. (C) β-tubulin staining showing differences in MT density in the nurse cells of control, EB1 KD alone, and double EB-SUN KO/EB1 KD egg chambers. (The contrast of insets showing the enlarged view of MT density was increased).

Update of

References

    1. Akhmanova A, Steinmetz MO (2008). Tracking the ends: A dynamic protein network controls the fate of microtubule tips. Nat Rev Mol Cell Biol 9, 309–322. - PubMed
    1. Baas PW, Qiang L (2005). Neuronal microtubules: When the MAP is the roadblock. Trends Cell Biol 15, 183–187. - PubMed
    1. Bastock R, St Johnston D (2008). Drosophila oogenesis. Curr Biol 18, R1082–R1087. - PubMed
    1. Brand AH, Perrimon N (1993). Targeted gene expression as a means of altering cell fates and generating dominant phenotypes. Development 118, 401–415. - PubMed
    1. Brendza RP, Serbus LR, Duffy JB, Saxton WM (2000). A function for kinesin I in the posterior transport of oskar mRNA and Staufen protein. Science 289, 2120–2122. - PMC - PubMed

Substances

LinkOut - more resources