. 2024 Oct 30:13:e89509.
doi: 10.7554/eLife.89509.

The zinc transporter Slc30a1 (ZnT1) in macrophages plays a protective role against attenuated Salmonella

Affiliations

The zinc transporter Slc30a1 (ZnT1) in macrophages plays a protective role against attenuated Salmonella

Pinanong Na-Phatthalung et al. Elife. .

Abstract

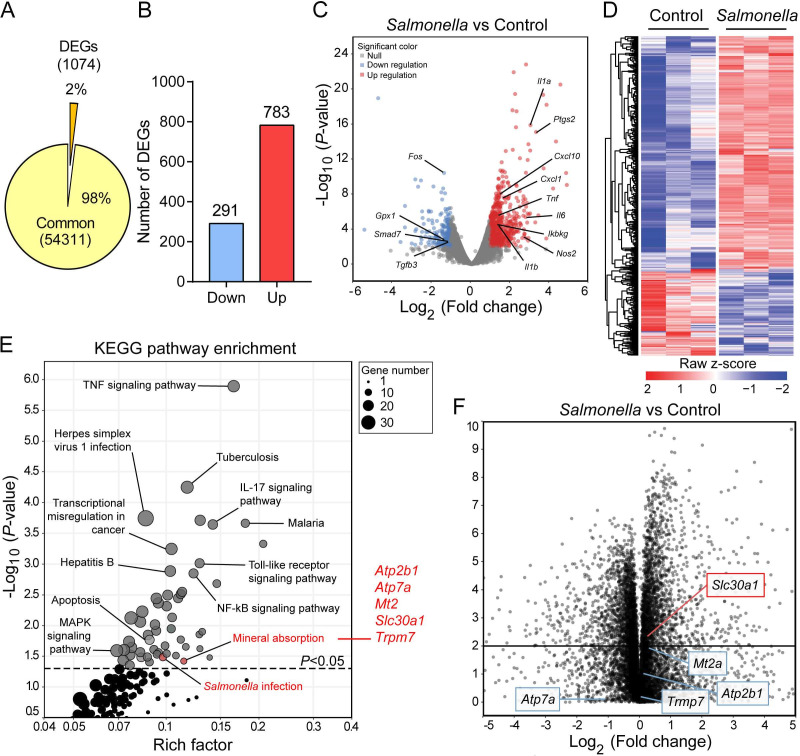
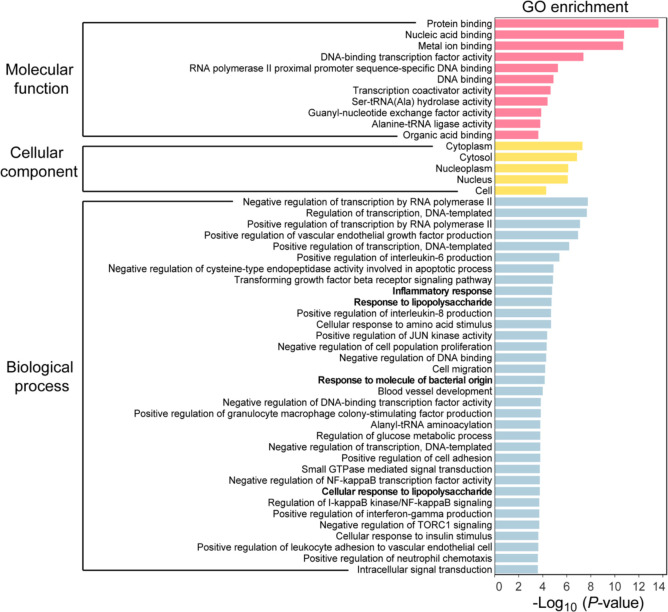
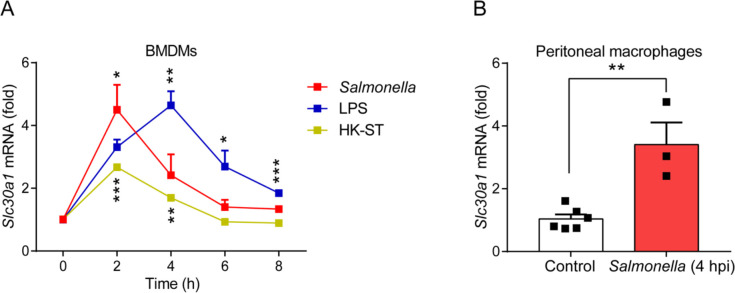
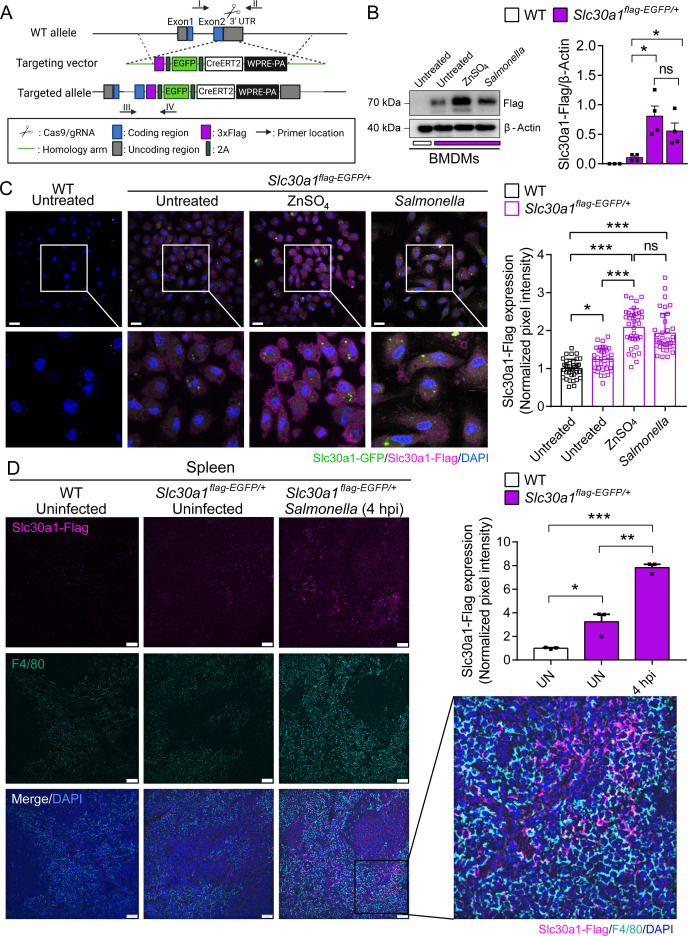
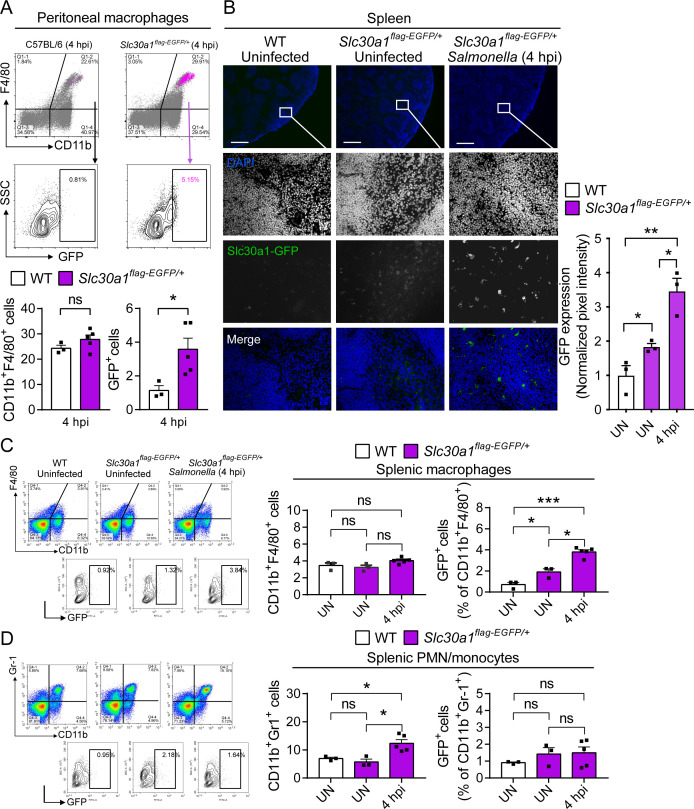
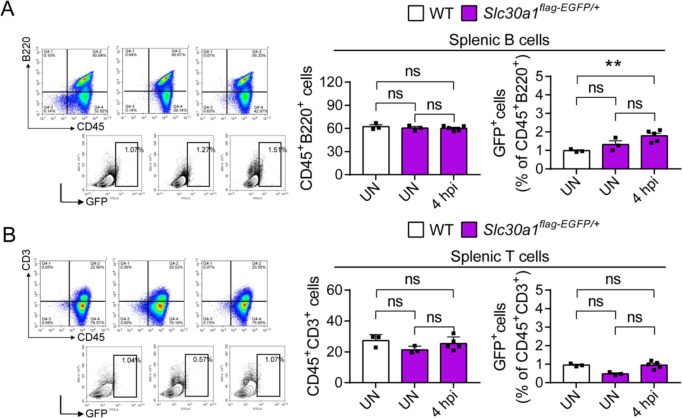
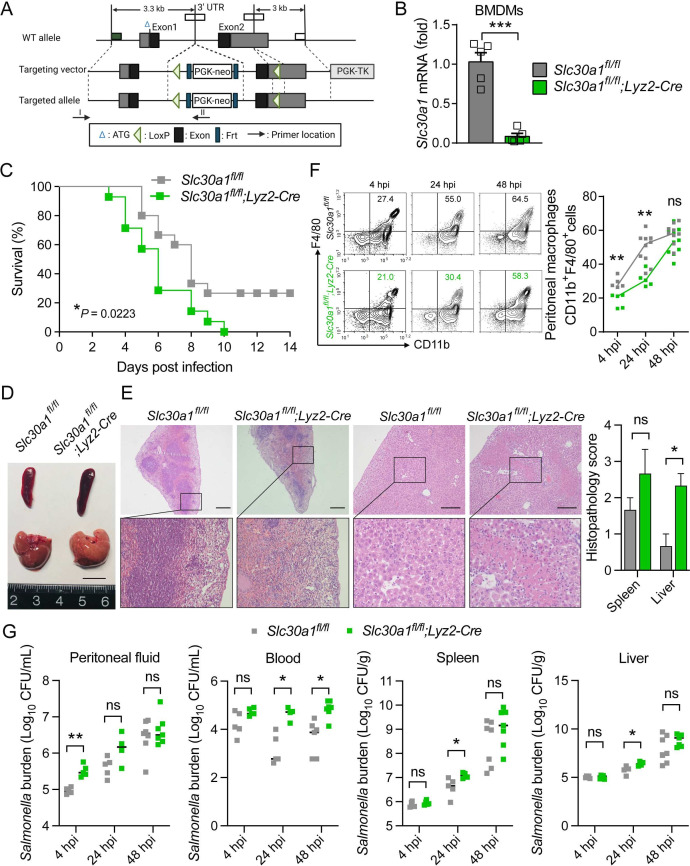
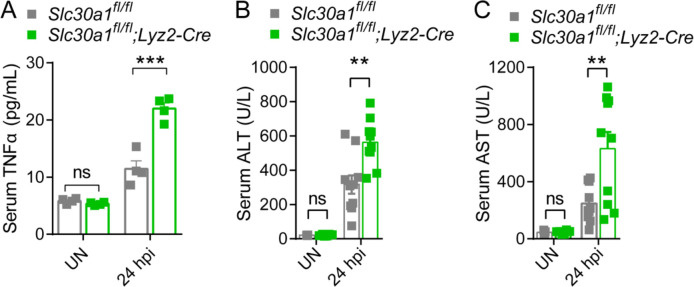
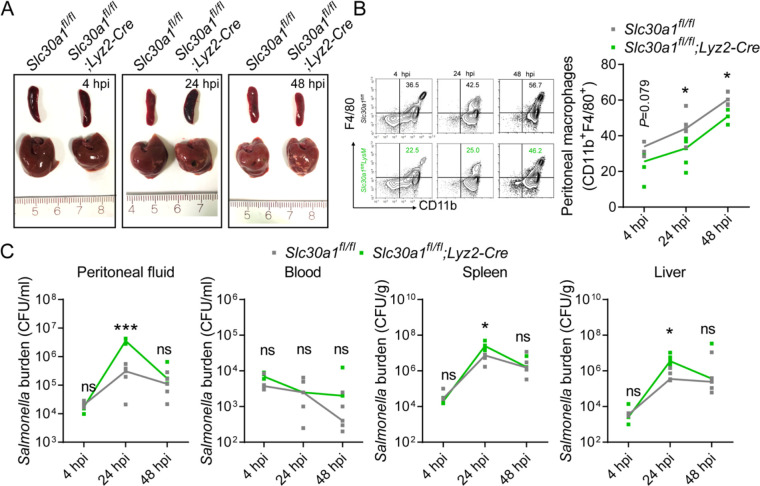
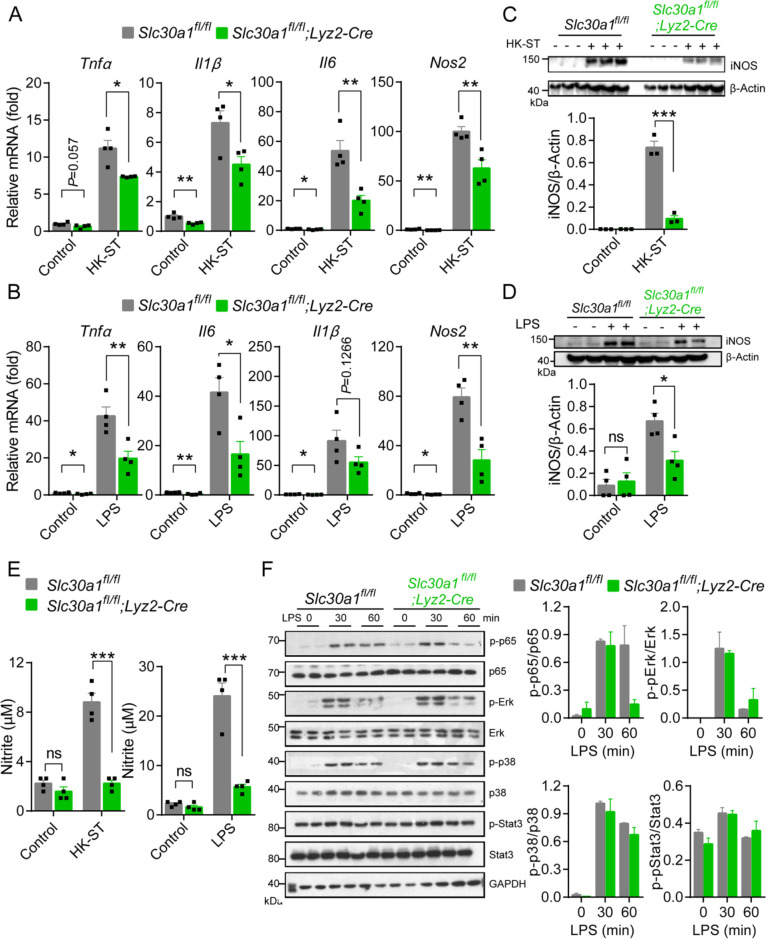
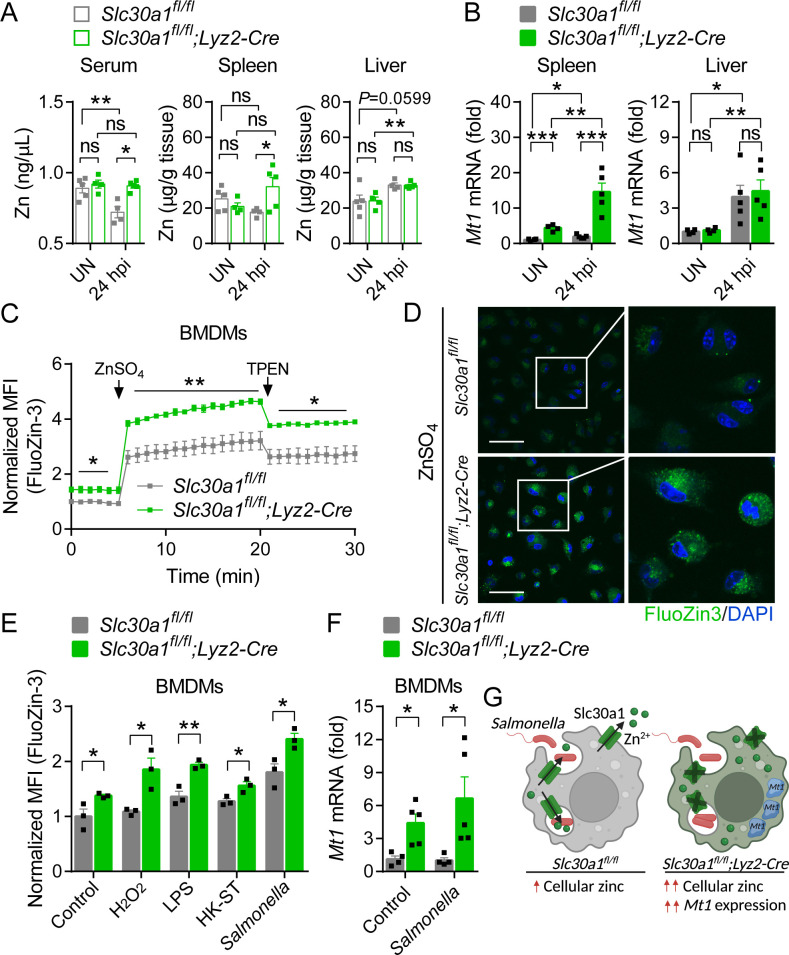
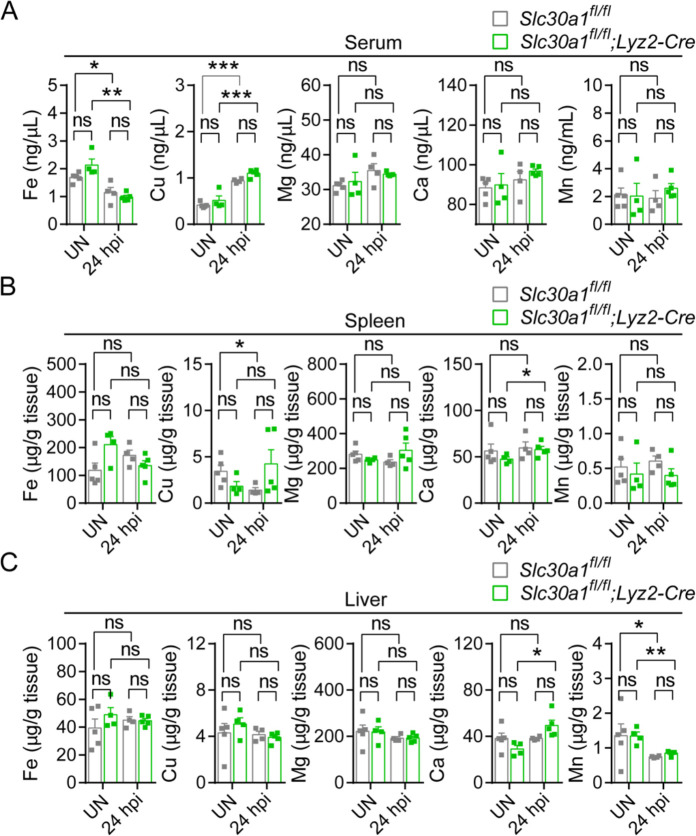
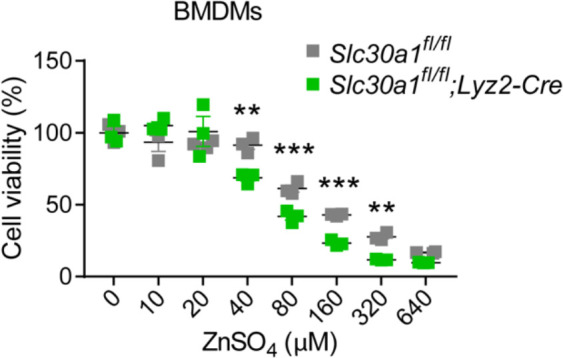
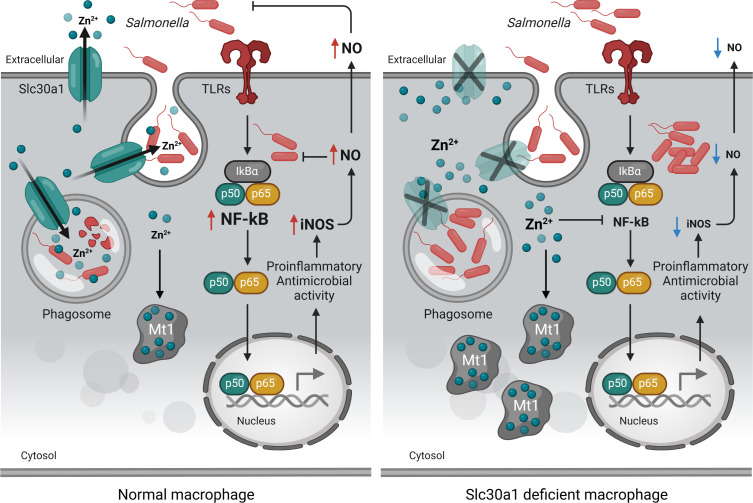
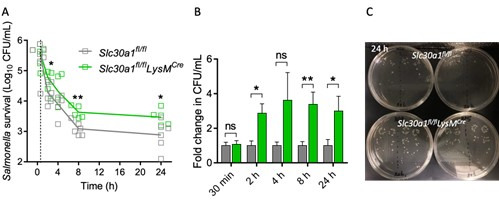
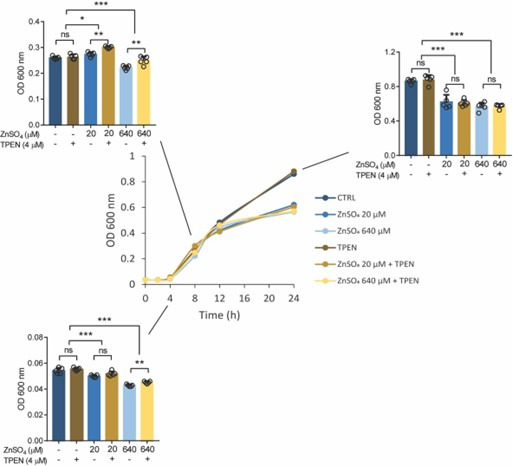
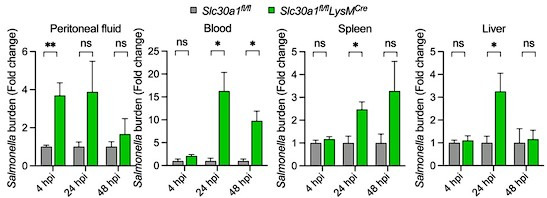
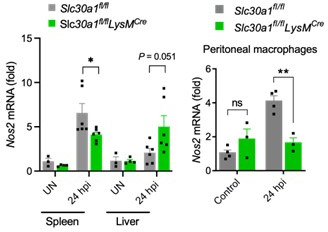
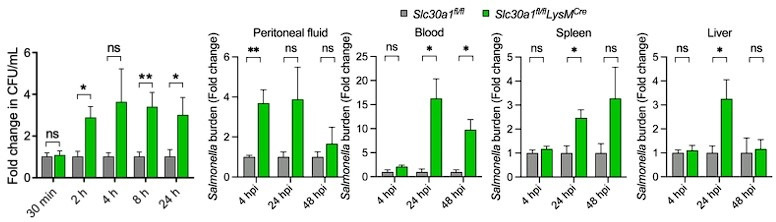
The zinc transporter Slc30a1 plays an essential role in maintaining cellular zinc homeostasis. Despite this, its functional role in macrophages remains largely unknown. Here, we examine the function of Slc30a1 in host defense using mice models infected with an attenuated stain of Salmonella enterica Typhimurium and primary macrophages infected with the attenuated Salmonella. Bulk transcriptome sequencing in primary macrophages identifies Slc30a1 as a candidate in response to Salmonella infection. Whole-mount immunofluorescence and confocal microscopy imaging of primary macrophage and spleen from Salmonella-infected Slc30a1flag-EGFP mice demonstrate Slc30a1 expression is increased in infected macrophages with localization at the plasma membrane and in the cytosol. Lyz2-Cre-driven Slc30a1 conditional knockout mice (Slc30a1fl/fl;Lyz2-Cre) exhibit increased susceptibility to Salmonella infection compared to control littermates. We demonstrate that Slc30a1-deficient macrophages are defective in intracellular killing, which correlated with reduced activation of nuclear factor kappa B and reduction in nitric oxide (NO) production. Notably, the model exhibits intracellular zinc accumulation, demonstrating that Slc30a1 is required for zinc export. We thus conclude that zinc export enables the efficient NO-mediated antibacterial activity of macrophages to control invading Salmonella.

Keywords: Salmonella infection; Slc30a1; ZnT1; iNOS; macrophages; medicine; mouse; zinc accumulation.


Conflict of interest statement

PN, SS, EX, JW, JM, FW No competing interests declared

Figures

Figure 1.
Figure 1.. Slc30a1 expression is upregulated in Salmonella-infected macrophages.
(A) Pie chart summarizing the percentage of unchanged genes and differentially expressed genes (DEGs) in wild-type (WT) bone marrow-derived macrophages (BMDMs) 2 h after Salmonella infection (multiplicity of infection [MOI] = 1) (n = 3) using RNA sequencing (RNA-seq) analysis. (B) Bar graph displaying the number of DEGs including up- and downregulated genes identified by p < 0.05 and an absolute log2 fold change >1; shown at the right is the total number of down- and upregulated genes. (C) Volcano plot displaying the fold change in gene expression and corresponding p values for Salmonella-infected cells versus control (uninfected) cells. (D) Heatmap showing the pattern of DEGs in BMDMs measured between Salmonella-infected cells and control cells. (E) Kyoto Encyclopedia of Genes and Genomes (KEGG) enrichment pathways (p < 0.05) of DEGs between Salmonella-infected cells and control cells. (F) Schematic diagram (left) illustrating the use of RNA-seq analysis on human monocyte-derived macrophages (MDMs) infected with Salmonella for 4 hr and volcano plot (right) of DEGs in Salmonella-infected MDMs based on a previously published dataset (GSE67427); the Atp2b1, Atp7a, Mt2, Slc30a1, and Trpm7 genes are indicated.
Figure 1—figure supplement 1.
Figure 1—figure supplement 1.. Gene ontology (GO) enrichment analysis of differentially expressed genes (DEGs) in bone marrow-derived macrophages (BMDMs) with or without Salmonella infection.
Figure 1—figure supplement 2.
Figure 1—figure supplement 2.. The gene expression of Slc30a1 in macrophages is induced by Salmonella infection.
Figure 2.
Figure 2.. Characterization of a Slc30a1 reporter mouse with or without Salmonella infection.
(A) Strategy for generating an Slc30a1 reporter mouse line expressing 3xFlag-EGFP under the control of the endogenous Slc30a1 promotor (Slc30a1flag-EGFP/+). (B) Western blot analysis of Slc30a1-flag in bone marrow-derived macrophages (BMDMs) isolated from Slc30a1flag-EGFP/+mice and exposed to ZnSO4 treatment (40 µM) or Salmonella (multiplicity of infection [MOI] = 1) for 4 hr. (C) Confocal fluorescence images of BMDMs treated as shown in B and immunostained using an anti-flag antibody (magenta); the nuclei were counterstained with DAPI(4′,6-diamidino-2-phenylindole) (blue), and GFP(Green fluorescent protein) was visualized directly based on green fluorescence. Scale bars, 20 µm. Shown at the right is the summary of the normalized pixel intensity of Slc30a1-flag expression in BMDMs in each group. (D) Confocal fluorescence images of spleen samples obtained from a Salmonella-infected mouse at 4 hpi; also shown are samples of uninfected WT and Slc30a1flag-EGFP/+ mice. The samples were stained with anti-flag (magenta) and anti-F4/80 (cyan), and the nuclei were counterstained with DAPI (blue). Scale bars, 50 µm. Shown at the right is the summary of the normalized pixel intensity of Slc30a1-flag expression in the spleen in each group. Data are presented as mean ± SEM(Standard Error of the Mean). p values were determined using two-tailed unpaired Student’s t-test. *p < 0.05, **p < 0.01, ***p < 0.001, and ns, not significant.
Figure 3.
Figure 3.. Induction of Slc30a1 expression in macrophages of a Slc30a1 reporter mouse upon Salmonella infection.
(A) FACS(Fluorescence-activated cell sorting) plots of GFP expression in CD11b+F4/80+ macrophages isolated from the peritoneal cavity of Salmonella-infected WT mice and Salmonella-infected Slc30a1flag-EGFP/+ mice at 4 hpi (n = 3–5 mice/group). (B) Fluorescence microscopy images of spleen samples obtained from a Salmonella-infected mouse at 4 hpi; also shown are samples of uninfected WT and Slc30a1flag-EGFP/+ mice. The green region indicated the Slc30a1-GFP expression, and the blue region indicated the nuclei staining by DAPI. Scale bar, 500 μm. FACS plots of GFP expression in CD11b+F4/80+ splenic macrophages (C) and CD11b+Gr-1+ splenic PMN/monocyte (D) isolated from the spleens of uninfected WT mice, uninfected Slc30a1flag-EGFP/+ mice, and Salmonella-infected Slc30a1flag-EGFP/+ mice at 4 hpi (n = 3–5 mice/group). Shown at the right is the summary of the percentage of CD11b+F4/80+ splenic macrophages and CD11b+Gr-1+ splenic PMN/monocyte in each group. Data in this figure are represented as mean ± SEM. p values were determined using two-tailed unpaired Student’s t-test. *p < 0.05, **p < 0.01, ***p < 0.001, and ns, not significant.
Figure 3—figure supplement 1.
Figure 3—figure supplement 1.. Proportion of splenic white blood cells in Slc30a1flag-EGFP/+ after Salmonella infection.
FACS plots of GFP expression in CD45+B220+ splenic B cells (A) and CD45+CD3+ splenic T cells (B) isolated from the spleens of uninfected WT mice, uninfected Slc30a1flag-EGFP/+ mice, and Salmonella-infected Slc30a1flag-EGFP/+ mice at 4 hpi (n = 3-5 mice/group). Shown at the right is the summary of the percentage of CD45+B220+ splenic B cells and CD45+CD3+ splenic T cells in each group. Data in this figure are represented as mean ± SEM. P values were determined using 2-tailed unpaired Student’s t-test. **P<0.01 and ns, not significant.
Figure 4.
Figure 4.. Lyz2-Cre-driven Slc30a1 conditional knockout mice are highly susceptible to Salmonella infection.
(A) Strategy for generating floxed Slc30a1 mice. Crossing this mouse with a heterozygous Lyz2-Cre mouse produces Slc30a1fl/fl;Lyz2-Cre and Slc30a1fl/fl littermates. (B) RT-qPCR analysis of relative Slc30a1 mRNA levels in bone marrow-derived macrophages (BMDMs) isolated from Slc30a1fl/fl;Lyz2-Cre and Slc30a1fl/fl mice (n = 5). (C) Kaplan–Meier survival curve of Salmonella-infected mice (n = 14–15 mice/group). (D, E) Gross and hematoxylin and eosin (H&E)-stained images of spleen and liver obtained from Salmonella-infected mice at 24 hpi. Scale bars, 1 cm, 5 mm and 10 mm, respectively. (F) FACS plots (left) and summary (right) of CD11b+F4/80+ peritoneal macrophages obtained from Salmonella-infected mice at 4, 24, and 48 hpi (n = 5–10 mice/group). (G) Summary of Salmonella CFUs measured in the peritoneal fluid, blood, spleen, and liver of Salmonella-infected mice at 4, 24, and 48 hpi (n = 3–5 mice/group). Data in this figure are represented as mean ± SEM. p values of survival in D were determined using Log-rank test, in B and F–K using two-tailed unpaired Student’s t-test. *p < 0.05, **p < 0.01, ***p < 0.001, and ns, not significant.
Figure 4—figure supplement 1.
Figure 4—figure supplement 1.. Elevated levels of proinflammatory cytokine and injury markers in the serum of Slc30a1fl/fl;Lyz2-Cre mice.
(A) Serum TNFα, (B) ALT, and (C) AST were measured in uninfected (UN) and Salmonella-infected mice at 24 hpi (n = 4-10 mice/group). Data are represented as mean ± SEM. P values were determined using 2-tailed unpaired Student’s t-test. *P<0.05 and ns, not significant.
Figure 4—figure supplement 2.
Figure 4—figure supplement 2.. Salmonella infection leads to significantly decreased macrophages and increased tissue bacterial burden in Slc30a1fl/fl;Lyz2-Cre mice.
(A) Gross image of spleen and liver of mice after infection with a non-lethal dose of Salmonella (1x10⁴ CFU/mouse) 4, 24, and 48 hpi. Scale bars, 1 cm. (B) FACS plots of CD11b+F4/80+ peritoneal macrophages obtained from Salmonella-infected Slc30a1fl/fl and Slc30a1fl/fl;Lyz2-Cre mice (n = 3-5 mice/group). (C) Bacterial burden (in CFU/ml) measured in the peritoneal fluid, blood, spleen, and liver of Salmonellainfected Slc30a1fl/fl and Slc30a1fl/fl;Lyz2-Cre mice (n = 3-5 mice/group). Data are represented as mean ± SEM. P values were determined using 2-tailed unpaired Student’s t-test. *P<0.05, ***P<0.001, and ns, not significant.
Figure 5.
Figure 5.. Slc30a1 is required for iNOS/nitric oxide (NO) production and intracellular pathogen-killing capacity of macrophages in response to Salmonella infection.
(A) Time course of the intracellular pathogen-killing capacity of Salmonella-infected Slc30a1fl/fl;Lyz2-Cre and Slc30a1fl/fl bone marrow-derived macrophages (BMDMs) measured in colony-forming units per ml (n = 5). (B) Transmission electron microscopy images of Salmonella-infected BMDMs at 24 hpi. Red arrows indicate bacterial-containing phagosomes, and the insets show magnified images of bacterial engulfment. Scale bars, 5 µm. (C–E) RT-qPCR analysis of mRNAs encoding inflammatory cytokines (Tnfα, Il1β, and Il6), chemokines (Ccr2, Ccl2, Cxcl1, and Cxcl10) and macrophage biomarkers (Nos2 and Arg1) in BMDMs measured at the indicated times after Salmonella infection (multiplicity of infection [MOI] = 1) (n = 5). (F) Western blot analysis and summary of iNOS protein in Slc30a1fl/fl;Lyz2-Cre and Slc30a1fl/fl BMDMs either untreated or stimulated with Salmonella for 24 hr (n = 3). (G) Summary of nitrite concentration measured in the cell culture supernatant of BMDMs either untreated or stimulated with Salmonella for 24 hr (n = 5). (H) Western blot analysis and summary of p-p65 and p65 measured at the indicated times in Salmonella-infected BMDMs (n = 3). (I) RT-qPCR analysis of mRNA levels of genes involved in nuclear factor kappa B (NF-κB) signaling (p65, MyD88, Ikkα, and Ikkβ) measured in BMDMs 60 min after Salmonella infection (n = 5). (J) Western blot analysis and summary of p-p65 and p65 measured in uninfected and Salmonella-infected BMDMs either with or without N,N,N′,N′-tetrakis-(2-pyridyl-methyl)-ethylenediamine (TPEN) (4 µM) for 60 min (n = 4). (K) RT-qPCR analysis of p65, MyD88, Ikkα, and Ikkβ mRNA in uninfected and Salmonella-infected BMDMs either with or without TPEN for 60 min (n = 6). Data in this figure are represented as mean ± SEM. p values were determined using two-tailed unpaired Student’s t-test. *p < 0.05, **p < 0.01, ***p < 0.001, and ns, not significant.
Figure 5—figure supplement 1.
Figure 5—figure supplement 1.. Loss of Slc30a1 in the murine macrophages reduces iNOS and nitric oxide (NO) production by inhibiting the nuclear factor kappa B (NF-κB) pathway.
Figure 6.
Figure 6.. Loss of Slc30a1 in macrophages causes intracellular zinc accumulation.
(A) Summary of zinc (Zn) content measured in the serum, spleen, and liver of uninfected (UN) and Salmonella-infected mice at 24 hpi (n = 4–5 mice/group). (B) RT-qPCR analysis of Mt1 mRNA in the spleen and liver of the indicated mice. (C) Time course of normalized FluoZin-3 mean fluorescence intensity (MFI) measured in bone marrow-derived macrophages (BMDMs); where indicated, ZnSO4 (100 µM) and N, N,N′,N′-tetrakis-(2-pyridyl-methyl)-ethylenediamine (TPEN) (4 µM) were applied to the cells. (D) Confocal fluorescence images of BMDMs stained with FluoZin-3 (green) after treatment with ZnSO4 for 15 min; the nuclei were counterstained with DAPI (blue). Scale bars, 50 µm. (E) Summary of normalized FluoZin-3 MFI measured in BMDMs 30 min after application of H2O2 (1 mM), lipopolysaccharide (LPS; 1 µg/ml), heat-killed Salmonella typhimurium (HK-ST) (multiplicity of infection [MOI] = 100), or Salmonella (MOI = 10) (n = 3). (F) RT-qPCR analysis of Mt1 mRNA in uninfected and Salmonella-infected BMDMs (n = 5). (G) Model showing the predicted effects of the loss of Slc30a1 on cellular zinc trafficking and intracellular zinc accumulation in BMDMs in response to Salmonella infection. Data in this figure are represented as mean ± SEM. p values were determined using two-tailed unpaired Student’s t-test. *p < 0.05, **p < 0.01, ***p < 0.001, and ns, not significant.
Figure 6—figure supplement 1.
Figure 6—figure supplement 1.. Except for Zn, Lyz2-Cre-mediated genetic deletion of Slc30a1 in mice does not affect the content of other trace minerals.
Figure 6—figure supplement 2.
Figure 6—figure supplement 2.. Slc30a1 deficiency increase sensitivity to zinc stress.
Figure 7.
Figure 7.. Putative protective function of Slc30a1 in macrophages during Salmonella infection.
Under normal conditions, Slc30a1 is upregulated in response to Salmonella infection, generating a short-term decrease in cytosolic zinc concentration and increasing zinc toxicity in Salmonella-containing phagosomes. Loss of Slc30a1 leads to an accumulation of intracellular zinc, thereby upregulating Mt1 overexpression and reducing iNOS and nitric oxide (NO) production via reduced nuclear factor kappa B (NF-κB) signaling, reducing the cell’s bacterial clearance capacity.
Figure 8.
Figure 8.. PCR-based genotyping.
(A) List of primers used for routine genotyping. PCR was performed using genomic DNA from mouse tail biopsies. (B) Genotyping of Slc30a1-3xflag-EGFP (Slc30a1flag-EGFP/+) mouse line. The PCR fragment length for the wild-type (WT) Slc30a1 allele is 612 and 469 bp for the mutant allele, respectively. (C) The conditional knockout (Slc30a1fl/fl;Lyz2-Cre) mice were recognized by genomic PCR rendering one band of flox/flox allele (512 bp) with two bands of Lyz2-Cre heterozygous (410 and 340 bp). Each lane represents one individual mice.
Figure 9.
Figure 9.. Lyz2-Cre-mediated genetic deletion of Slc30a1 in mice does not affect the differentiation of bone marrow-derived macrophages (BMDMs).
(A) Schematic illustration depicting the strategy used to measure the BMDM differentiation procedure. Bone marrow (BM) cells were harvested from the femur and tibia and cultured in L929 cell-conditioned medium (LCM) for 7 days. (B) Flow cytometry analysis and summary of the percent BMDM differentiation (CD11b+F4/80+) from BM samples obtained from the indicated mice measured at day 7 (n = 3). (C) Percent BMDM purification and absolute number of BMDMs measured after removing floating cells and measuring cell concentration. Data in this figure are represented as mean ± SEM. p values were determined using two-tailed unpaired Student’s t-test. ns, not significant.
Author response image 1.
(A) Time course of the intracellular pathogen-killing capacity of Salmonella infected Slc30a1fl/flLysMCre and Slc30a1fl/fl BMDMs measured in colony-forming units per ml (n = 5). (B) Fold change in Salmonella survival (CFU/mL) at different time points from A. (C) Representative images of Salmonella colonies on solid agar medium at 24 hours. Data are represented as mean ± SEM. P values were determined using 2-tailed unpaired Student’s t-test. *P<0.05, **P<0.01, and ns, not significant.
Author response image 2.
Author response image 2.. Growth curve (optical density, OD 600 nm) of Salmonella in LB medium at different concentrations of ZnSO4 and/or TPEN.
Bar graph indicating Salmonella growth at specific time points. Each value was expressed as mean of triplicates for each testing and data were determined using 2-tailed unpaired Student’s t-test. *P<0.05, **P<0.01, ***P<0.001 and ns, not significant.
Author response image 3.
Author response image 3.. Bar graph indicates fold change in Salmonella burden of Slc30a1fl/flLysMCre normalized to Slc30a1fl/fl.
Data are represented as mean ± SEM. P values were determined using 2-tailed unpaired Student’s t-test. *P<0.05, ***P<0.001, and ns, not significant.
Author response image 4.
Author response image 4.. RT-qPCR analysis of mRNA encoding Nos2 in the spleen, liver, and peritoneal macrophages of uninfected and Salmonella infected mice for 24 h.
Data are represented as mean ± SEM. P values were determined using 2-tailed unpaired Student’s t-test, *P<0.05, **P<0.01 and ns, not significant.
Author response image 5.
Author response image 5.. Bar graph indicates fold change in Salmonella survival (CFU/mL) (Right).
P values were determined using 2-tailed unpaired Student’s t-test. *P<0.05, **P<0.01, ***P<0.001, and ns, not significant.

Update of

  • doi: 10.1101/2023.06.06.543958

References

    1. Ahuja A, Kim E, Sung GH, Cho JY. STAT3 differentially regulates tlr4-mediated inflammatory responses in early or late phases. International Journal of Molecular Sciences. 2020;21:7675. doi: 10.3390/ijms21207675. - DOI - PMC - PubMed
    1. Alker W, Haase H. Zinc and Sepsis. Nutrients. 2018;10:976. doi: 10.3390/nu10080976. - DOI - PMC - PubMed
    1. Andrews GK, Wang H, Dey SK, Palmiter RD. Mouse zinc transporter 1 gene provides an essential function during early embryonic development. Genesis. 2004;40:74–81. doi: 10.1002/gene.20067. - DOI - PubMed
    1. Botella H, Peyron P, Levillain F, Poincloux R, Poquet Y, Brandli I, Wang C, Tailleux L, Tilleul S, Charrière GM, Waddell SJ, Foti M, Lugo-Villarino G, Gao Q, Maridonneau-Parini I, Butcher PD, Castagnoli PR, Gicquel B, de Chastellier C, Neyrolles O. Mycobacterial p1-type atpases mediate resistance to zinc poisoning in human macrophages. Cell Host & Microbe. 2011;10:248–259. doi: 10.1016/j.chom.2011.08.006. - DOI - PMC - PubMed
    1. Brennan MA, Cookson BT. Salmonella induces macrophage death by caspase-1-dependent necrosis. Molecular Microbiology. 2000;38:31–40. doi: 10.1046/j.1365-2958.2000.02103.x. - DOI - PubMed

Associated data