. 2024 Oct 30:12:RP88414.
doi: 10.7554/eLife.88414.

Spatial transcriptomics of meningeal inflammation reveals inflammatory gene signatures in adjacent brain parenchyma

Affiliations

Spatial transcriptomics of meningeal inflammation reveals inflammatory gene signatures in adjacent brain parenchyma

Sachin P Gadani et al. Elife. .

Abstract

While modern high efficacy disease modifying therapies have revolutionized the treatment of relapsing-remitting multiple sclerosis, they are less effective at controlling progressive forms of the disease. Meningeal inflammation is a recognized risk factor for cortical gray matter pathology which can result in disabling symptoms such as cognitive impairment and depression, but the mechanisms linking meningeal inflammation and gray matter pathology remain unclear. Here, we performed magnetic resonance imaging (MRI)-guided spatial transcriptomics in a mouse model of autoimmune meningeal inflammation to characterize the transcriptional signature in areas of meningeal inflammation and the underlying brain parenchyma. We found broadly increased activity of inflammatory signaling pathways at sites of meningeal inflammation, but only a subset of these pathways active in the adjacent brain parenchyma. Subclustering of regions adjacent to meningeal inflammation revealed the subset of immune programs induced in brain parenchyma, notably complement signaling and antigen processing/presentation. Trajectory gene and gene set modeling analysis confirmed variable penetration of immune signatures originating from meningeal inflammation into the adjacent brain tissue. This work contributes a valuable data resource to the field, provides the first detailed spatial transcriptomic characterization in a model of meningeal inflammation, and highlights several candidate pathways in the pathogenesis of gray matter pathology.

Keywords: experimental autoimmune encephalomyelitis; gray matter degeneration; immunology; inflammation; meningeal inflammation; mouse; multiple sclerosis; neuroscience; spatial transcriptomics.


Conflict of interest statement

SG, SS, SK, JH, MS, PC, PB No competing interests declared

Figures
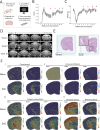
Figure 1.
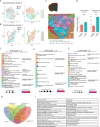
Figure 1.. Magnetic resonance imaging (MRI)-guided spatial transcriptomics of meningeal-based inflammation in Swiss Jim Lambert (SJL) experimental autoimmune encephalomyelitis (EAE).
(A) Schematic describing the experimental paradigm. SJL mice underwent brain MRI 6, 8, and 10 weeks’ post-immunization with PLP139-151. Brain slices from regions with meningeal inflammation were collected and processed for spatial transcriptomics on the 10x Genomics platform. (B–C) Behavior scores (B) and mouse weights (C) of the EAE cohort. Red arrows indicate MRI time points, black arrow indicates time of tissue harvesting (N=4). (D) Representative post-contrast MRI brain images, white arrows indicate areas of meningeal-based inflammation. (E) Representative images of hematoxylin and eosin (H&E)-stained tissue sections mounted on spatial transcriptomics slides (left, naïve; right, EAE). (F) Spatial feature plots from naïve (top row) and EAE (bottom row) representative samples demonstrate altered expression of genes related to complement (i), immune infiltration (ii), antigen presentation (iii), dendritic spines, and astrocyte activation (iv).
Figure 1—figure supplement 1.
Figure 1—figure supplement 1.. Contrast enhancing meningeal inflammation in Swiss Jim Lambert (SJL) experimental autoimmune encephalomyelitis (EAE) does not change at chronic time points or with clinical disease scores.
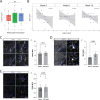
(A) Box plot of lesion number vs. week post-immunization. ANOVA with Tukey’s HSD post hoc test. (B) Lesion number plotted against EAE score demonstrates no strong correlation (R2<0.4 in all cases). N=16, data is representative of three pooled experiments. (C–E) Immunofluorescence analysis of glial reactivity in naïve and CFA only groups, 11 weeks after injection. Representative staining at low and high magnification and MFI (mean fluorescence intensity) calculations of (C) GFAP, (D) IBA1, (E) CD68. N=5, Mann-Whitney tests.
Figure 1—figure supplement 2.
Figure 1—figure supplement 2.. Quality control analysis of spatial transcriptomic data.
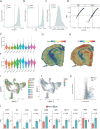
(A) Density of read counts, (B) number of unique molecular identifiers (UMI), (C) and the ratio of read count/UMI per spot for naïve and experimental autoimmune encephalomyelitis (EAE) samples. Most spots had >500 read count (A), >250 UMI (B), and >0.80 log(nCount/UMI) (C). (D) Dot plot shows most spots having linear correlation between UMI and read count. (E–F) Violin plots of read counts (E) and UMI (F) per sample. (G–H) Representative spatial feature plots of read count (G) and UMI (H) demonstrate expected anatomic variability in transcript amount and diversity. (I–J) UMAP dimensionality reduction plots, colored by mouse (I) or slide (J). (K) MA plot of genes enriched in EAE compared to naïve samples. Data was pseudobulked by sample and groups were compared using DESeq2 for gene enrichment (adjusted p-value<0.05, log 2 fold change >1). (L) Comparison of average expression for select transcripts in naïve and EAE samples. N=4, Student’s t-test.
Figure 2.
Figure 2.. PROGENy analysis reveals spatially restricted pathway activity differences between naïve and experimental autoimmune encephalomyelitis (EAE).
(A) Heatmap displaying averaged PROGENy pathway analysis results. (B) Representative spatial plot showing activity of the JAK-STAT, NFkB, and TNFa signaling pathways. (C) Comparison of JAK-STAT, NFkB, and TNFa pathway activities between groups. (D) Representative spatial plot showing activity of the Trail, PI3K, and TGFb signaling pathways. (E) Comparison of Trail, PI3K, and TGFb pathway activities between groups. (Naïve mouse N=4, sample N=5; EAE mouse N=4, sample N=6; multiple t-tests corrected for multiple comparisons with the Benjamini, Krieger, and Yekutieli method; *p<0.05, **p<0.01, ***p<0.001.)
Figure 3.
Figure 3.. Unbiased clustering reveals a group of spots enriched in inflammatory genes.
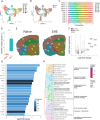
(A–B) UMAP dimensionality reduction plots colored by (A) cluster or (B) group. (C) Bar plot showing the proportion of spots in each cluster by sample. (D) Number of spots in cluster 11 by group (N=11; Student’s two-tailed t-test). (E) Representative spatial feature plots of naïve and experimental autoimmune encephalomyelitis (EAE) samples showing the spatial distribution of each cluster. (F) MA plot comparing differences in gene expression between cluster 11 and all other clusters averaged across samples. Red and blue spots represent genes in cluster 11 that are significantly increased or decreased, respectively (adjusted p-value<0.05, log 2 fold change >1). (G) Bar plot of top 15 genes enriched in cluster 11 compared to other clusters. (H) Tree plot displaying gene set enrichment results using the gene ontology (GO) database. Spots in cluster 11 were compared to other spots and gene set sizes ranging from 10 to 500 were included (adjusted p-value<0.05).
Figure 3—figure supplement 1.
Figure 3—figure supplement 1.. Spatial and transcriptional properties of inflammatory clusters.
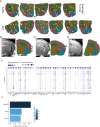
(A) Representative spatial feature plots of naïve (top row) and experimental autoimmune encephalomyelitis (EAE) (bottom row) samples colored by cluster show consistent labeling of anatomic regions and the distribution of meningeal inflammation (cluster 11). (B–D) Representative images of gadolinium-enhanced magnetic resonance imaging (MRI) scans collected 10 weeks after immunizations and samples collected from the same animal. Areas of meningeal enhancement (red arrows) correlate with cluster 11. (E) Dot plot of the top 100 significantly enriched genes (sorted by adjusted p-value) in cluster 11 compared to other clusters. Dot color represents expression value and dot size represents the percent of spots within that cluster expressing the gene.
Figure 4.
Figure 4.. Subclustering of spots adjacent to meningeal immune follicles reveals a subset of active immune patterns.
(A) UMAP dimensionality reduction plots showing subclustering of cluster 1 colored by (left) group or (right) cluster. (B) UMAP dimensionality reduction plots showing subclustering of cluster 2 colored by (left) group or (right) cluster. (C) Representative spatial feature plot showing the locations of cluster 1 and 2 subclusters. (D) Distance from the center of indicated subclusters to the nearest point of cluster 11 (N=11; Student’s two-tailed t-test). (E–G) Tree plot displaying gene set enrichment results using the gene ontology (GO) database for subcluster 1_3 (E), 1_4 (F), and 2_6 (G) compared to other spots in their respective clusters. (H) Venn diagram shows overlap of significantly enriched GO gene sets between cluster 11 and subclusters 1_3, 1_4, and 2_6, with (I) 31 gene sets elevated in all. GO gene set of size ranging from 10 to 500 were included (adjusted p-value<0.05).
Figure 4—figure supplement 1.
Figure 4—figure supplement 1.. Subcluster analysis reveals experimental autoimmune encephalomyelitis (EAE)-specific subclusters and gene enrichment.
(A–K) Data from each individual cluster was extracted and unbiased subclustering performed based on gene expression; (A) cluster 0, (B) cluster 1, (C) cluster 2, (D) cluster 3, (E) cluster 4, (F) cluster 5, (G) cluster 6, (H) cluster 7, (I) cluster 8, (J) cluster 9, (K) cluster 10. UMAP plots are shown colored by subcluster (left panel) and group (middle panel). Data from each cluster was isolated, pseudobulked by sample, and groups were compared using DESeq2 for gene enrichment (right panel; adjusted p-value<0.05, log 2 fold change >1).
Figure 4—figure supplement 2.
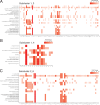
Figure 4—figure supplement 2.. Gene contributions to enriched gene sets in subclusters 1_3, 1_4, and 2_6.
(A–C) Heatmaps of gene ontology (GO) gene sets enriched in subcluster 1_3 (A), 1_4 (B), and 2_6 (C). Individual genes contributing to gene sets are displayed on the x axis. Data from each subcluster was pseudobulked by sample and groups were compared using DESeq2 for gene enrichment (adjusted p-value<0.05, log 2 fold change >1). Heatmaps of select gene sets were generated using the enrichPlot package.
Figure 5.
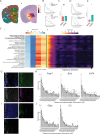
Figure 5.. Trajectory analysis reveals gradients of gene expression originating from meningeal lymphoid follicles.
(A) Trajectories were drawn based on spatial cluster plot (i) from C11 to C2 (ii). (B) Representative plot of B2m relative expression along the trajectory length. Green line: B2m expression; black line: ideal model fit, ‘logarithmic descending’ (top) or ‘gradient descending’ (bottom); red line: residual area under the curve (AUC) representing the difference between B2m expression and the ideal model. (C) Bar plot showing residual AUC of B2m relative expression along the trajectory direction compared to ‘logarithmic descending’ or ‘gradient descending’ (Student’s two-tailed t-test). (D) Representative plot of C3 relative expression along the trajectory length. Green line: C3 expression; black line: ideal model fit, ‘logarithmic descending’ (top) or ‘gradient descending’ (bottom); red line: residual area under the curve (AUC) representing the difference between C3 expression and the ideal model. (C) Bar plot showing residual AUC of C3 relative expression along the trajectory direction compared to ‘logarithmic descending’ or ‘gradient descending’ (Student’s t-test). (F) Gene sets that were previously identified as significantly enriched in C11 were selected for trajectory analysis. Residual AUCs were calculated for ‘logarithmic descending’, ‘gradient descending’, ‘logarithmic ascending’, and ‘gradient ascending’ ideal fits and displayed on (i) a heatmap sorted by ‘gradient descending’. (ii) Representative feature plot demonstrating deeper penetration of upper gene sets (related to antigen presentation and processing, microglial activation, IL-6 production, interferon gamma) response relative to other gene sets (B cell activation, T cell activation, TNF production, complement, humoral immune response). (G, I) Representative images of RNAscope labeling for (G) Fcgr3, B2m, Cd74, and (I) Gfap, C3 in Swiss Jim Lambert (SJL) mice 11 weeks after experimental autoimmune encephalomyelitis (EAE) induction. Yellow dashed lines indicate the areas of leptomeningeal inflammation, scale bars represent 100 μM. (H, J) Bar plots representing the percent of marker-positive cells present at distances from leptomeningeal inflammation. Lines represent best fit curves from exponential regression. N=3 animals per group; bars represent mean, error bars represent standard error.
Figure 5—figure supplement 1.
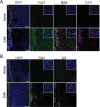
Figure 5—figure supplement 1.. Representative images of RNAscope labeling in naïve and experimental autoimmune encephalomyelitis (EAE) tissues.
RNAscope labeling of (A) Fcgr3, B2m, Cd74, and (B) Gfap, C3. Images are representative of N=3 animals per group. Yellow dashed lines outline the subarachnoid space. Scale bars represent 100 μM (main image) and 10 μM (inset).

Update of

  • doi: 10.1101/2023.06.02.543421
  • doi: 10.7554/eLife.88414.1
  • doi: 10.7554/eLife.88414.2
  • doi: 10.7554/eLife.88414.3

References

    1. Absinta M, Vuolo L, Rao A, Nair G, Sati P, Cortese ICM, Ohayon J, Fenton K, Reyes-Mantilla MI, Maric D, Calabresi PA, Butman JA, Pardo CA, Reich DS. Gadolinium-based MRI characterization of leptomeningeal inflammation in multiple sclerosis. Neurology. 2015;85:18–28. doi: 10.1212/WNL.0000000000001587. - DOI - PMC - PubMed
    1. Arellano G, Ottum PA, Reyes LI, Burgos PI, Naves R. Stage-specific role of interferon-gamma in experimental autoimmune encephalomyelitis and multiple sclerosis. Frontiers in Immunology. 2015;6:492. doi: 10.3389/fimmu.2015.00492. - DOI - PMC - PubMed
    1. Ashburner M, Ball CA, Blake JA, Botstein D, Butler H, Cherry JM, Davis AP, Dolinski K, Dwight SS, Eppig JT, Harris MA, Hill DP, Issel-Tarver L, Kasarskis A, Lewis S, Matese JC, Richardson JE, Ringwald M, Rubin GM, Sherlock G. Gene Ontology: tool for the unification of biology. Nature Genetics. 2000;25:25–29. doi: 10.1038/75556. - DOI - PMC - PubMed
    1. Azevedo CJ, Cen SY, Khadka S, Liu S, Kornak J, Shi Y, Zheng L, Hauser SL, Pelletier D. Thalamic atrophy in multiple sclerosis: a magnetic resonance imaging marker of neurodegeneration throughout disease. Annals of Neurology. 2018;83:223–234. doi: 10.1002/ana.25150. - DOI - PMC - PubMed
    1. Bedussi B, van der Wel NN, de Vos J, van Veen H, Siebes M, VanBavel E, Bakker EN. Paravascular channels, cisterns, and the subarachnoid space in the rat brain: a single compartment with preferential pathways. Journal of Cerebral Blood Flow and Metabolism. 2017;37:1374–1385. doi: 10.1177/0271678X16655550. - DOI - PMC - PubMed

Associated data