. 2024 Nov 1;31(Pt 6):1609-1621.
doi: 10.1107/S1600577524009342. Epub 2024 Oct 30.

Five-analyzer Johann spectrometer for hard X-ray photon-in/photon-out spectroscopy at the Inner Shell Spectroscopy beamline at NSLS-II: design, alignment and data acquisition

Affiliations

Five-analyzer Johann spectrometer for hard X-ray photon-in/photon-out spectroscopy at the Inner Shell Spectroscopy beamline at NSLS-II: design, alignment and data acquisition

Akhil Tayal et al. J Synchrotron Radiat. .

Abstract

Here, a recently commissioned five-analyzer Johann spectrometer at the Inner Shell Spectroscopy beamline (8-ID) at the National Synchrotron Light Source II (NSLS-II) is presented. Designed for hard X-ray photon-in/photon-out spectroscopy, the spectrometer achieves a resolution in the 0.5-2 eV range, depending on the element and/or emission line, providing detailed insights into the local electronic and geometric structure of materials. It serves a diverse user community, including fields such as physical, chemical, biological, environmental and materials sciences. This article details the mechanical design, alignment procedures and data-acquisition scheme of the spectrometer, with a particular focus on the continuous asynchronous data-acquisition approach that significantly enhances experimental efficiency.

Keywords: Johann geometry; X-ray emission spectrometers; X-ray spectroscopy.


Figures

Figure 1
Figure 1
The ISS spectrometer design. (a) A design drawing showing the CA assembly, its XY motion, the detector arm with two goniometers and the arm’s X motion. The five CAs are labeled as shown with respect to the X-ray beam direction. The beamline coordinate system is shown for reference. (b) A photograph of the analyzer assembly taken at the beamline.
Figure 2
Figure 2
The design of the SBCA mechanical stack. (a) The mechanical stack with four motion axes viz. x, y, pitch and roll shown. (b) The location of the four motion stages and a spring-loaded mechanism with a hollow stud (magenta) used to adjust the angle offset manually. Hollow studs with different lengths (magenta) are available for different angular offsets and are kept on the sides of the stacks.
Figure 3
Figure 3
(a, b) Elastic and (c, d) emission scans for the alignment of the five-analyzer spectrometer with a nominal radius of curvature of 1000 mm. The elastic scans were performed on water and emission scans were performed on Cu foil, using the fourth reflection of Si(111) crystal with the 79.43° Bragg angle. (a) Elastic peaks measured at selected values of the Rowland circle radius, R, showing that large deviations from the optimal value result in peak broadening and reduction in the peak height. (b) Elastic peaks measured at the optimal R for all analyzers. The peaks for each SBCA are normalized by the peak maximum intensity observed in the corresponding scan series (c, d). In (c, d) a similar alignment procedure to the one used for the elastic scans is followed, but these scans display the Cu Kα1 emission peak. (e) The elastic peak maximum intensity as a function of R for all SBCAs. Colored circles show the values obtained from each scan. Solid lines show the third-order polynomial fit of the data. The average of the polynomial fits of all SBCA data (dashed black line) is used to determine the position of the curve maximum, which is used as the optimal R value (dashed blue line). For clarity, all the curves are normalized by the maximum of the corresponding polynomial fits. Panel (f) is the same as (e), but for the Cu Kα1 emission peak. Panels (b), (d), (e), and (f) use the same color scheme to show SBCA-specific data.
Figure 4
Figure 4
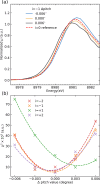
SBCA Bragg angle calibration with HERFD-XANES scans performed at different SBCA pitch values. (a) Selected alignment scans, performed on a dilute CuO sample, for SBCAs with i = +1 at different pitch values are compared with the HERFD-XANES measured for the i = 0 crystal. The pitch values are indicated as deviations from the values corresponding to the maximum of the elastic peak. (b) The sum of squared residuals, χ2 value, between HERFD-XANES data recorded for SBCAs with i = ±1, ±2 and the SBCA with i = 0 as a function of SBCA pitch-angle deviation. The dashed lines are second-order polynomial fits to the data.
Figure 5
Figure 5
Examples of HERFD-XANES spectra recorded at ISS. (a) HERFD and TFY data collected on Cu-zeolite samples with ∼1.5 wt% metal loading; the single scan was measured in 5.7 s. (b) An example of a HERFD-XANES spectrum at the Hg L3 edge on a sample of muscle tissue from an Atlantic bottle nose dolphin (T. truncates) containing an Hg concentration of 19.3 p.p.m. by weight. The measurement details are given in the main text.
Figure 6
Figure 6
Implementation of continuous XES scanning. At the beginning, the spectrometer is set to the relevant emission energy, typically in the middle of the scanning range. The detector is then positioned outside of the intersecting Rowland circles to separate the individual SBCA reflections, as explained in the main text. The order of SBCA reflections is inverted on the detector sensor with respect to the SBCA arrangement. The scan is performed by asynchronously moving the SBCA pitch motors according to the user-supplied trajectory while collecting images with the Pilatus 100K detector using an external trigger source. The data consist of the image stream, individual SBCA positioning streams and ion-chamber currents (not shown). The coordinate system of the beamline is given for reference.
Figure 7
Figure 7
Raw data recorded during a continuous XES scan performed on the Cu Kα emission lines. (a) The recorded SBCA pitch positions as a function of time. The positions are shown as deviations from the position at which the spectrometer was configured prior to the continuous scan (Bragg angle of 79.81° corresponding to 8035 eV). The SBCA pitch was configured to move with a slower speed in the regions corresponding to the Kα1 and Kα2 peaks and faster otherwise. The inset shows the recorded pitch positions during the first few seconds and shows the 150–200 ms delay between the individual SBCA pitch positions arising due to the asynchronous motion. Black circles display the representative times selected for the Pilatus 100K images shown in panel (b). Labels (i), (ii) and (iii) correspond to the peak of the Kα1 line, a point in between the Kα1 and Kα2 lines, and the peak of the Kα2 line, respectively. (b) Recorded Pilatus 100K images demonstrating the changes in the position and the intensity of the SBCA reflections during the SBCA pitch motion.
Figure 8
Figure 8
Processing of the continuous XES scan data. (a) A sum of all images recorded during the scan, demonstrating the footprint of each SBCA reflection as they traverse the detector. The footprints help to define polygonal ROIs that are then used to compute individual SBCA XES intensities as a function of time using recorded images. The polygonal ROIs are marked with their corresponding SBCA index. (b) A set of elastic scans performed to experimentally determine the conversion between the pitch angle and energy for the central SBCA (i = 0). The pitch data are shown as deviations from the central positions that correspond to the Bragg angle of 79.81° (8035 eV). Prior to scanning, the spectrometer was set to the Bragg angle of 79.81° corresponding to 8035 eV, i.e. in between the Kα1 and Kα2 peaks, and the area detector was moved 75 mm out of the Rowland circle. The black lines show elastic signal computed as the sum of intensities recorded by the pixels located within the corresponding polygonal ROI shown in (a) and normalized by the incoming beam intensity. By fitting the data with Gaussian peaks, shown as red lines, we determined the peak positions for the calibration. (c) Comparison of the experimentally determined conversion from SBCA pitch (i = 0) to energy (black circles) with a line computed based on the Bragg law. (d) XES signals obtained for individual SBCAs. (e) Comparison of the continuous XES scan with the step scan performed on the same Cu foil.

References

    1. Abraham, B., Nowak, S., Weninger, C., Armenta, R., Defever, J., Day, D., Carini, G., Nakahara, K., Gallo, A., Nelson, S., Nordlund, D., Kroll, T., Hunter, M. S., van Driel, T., Zhu, D., Weng, T.-C., Alonso-Mori, R. & Sokaras, D. (2019). J. Synchrotron Rad.26, 629–634. - PMC - PubMed
    1. Albrahim, M., Thompson, C., Leshchev, D., Shrotri, A., Unocic, R. R., Hong, J., Hoffman, A. S., Meloni, M. J., Runnebaum, R. C., Bare, S. R., Stavitski, E. & Karim, A. M. (2021). J. Phys. Chem. C, 125, 11048–11057.
    1. Allan, D., Caswell, T., Campbell, S. & Rakitin, M. (2019). Synchrotron Radiat. News, 32(3), 19–22.
    1. Alonso-Mori, R., Kern, J., Sokaras, D., Weng, T.-C., Nordlund, D., Tran, R., Montanez, P., Delor, J., Yachandra, V. K., Yano, J. & Bergmann, U. (2012). Rev. Sci. Instrum.83, 073114. - PMC - PubMed
    1. Amidani, L., Naldoni, A., Malvestuto, M., Marelli, M., Glatzel, P., Dal Santo, V. & Boscherini, F. (2015). Angew. Chem. Int. Ed.54, 5413–5416. - PubMed

LinkOut - more resources