

Using intrahost single nucleotide variant data to predict SARS-CoV-2 detection cycle threshold values
- PMID: 39475880
- PMCID: PMC11524481
- DOI: 10.1371/journal.pone.0312686
Using intrahost single nucleotide variant data to predict SARS-CoV-2 detection cycle threshold values
Abstract
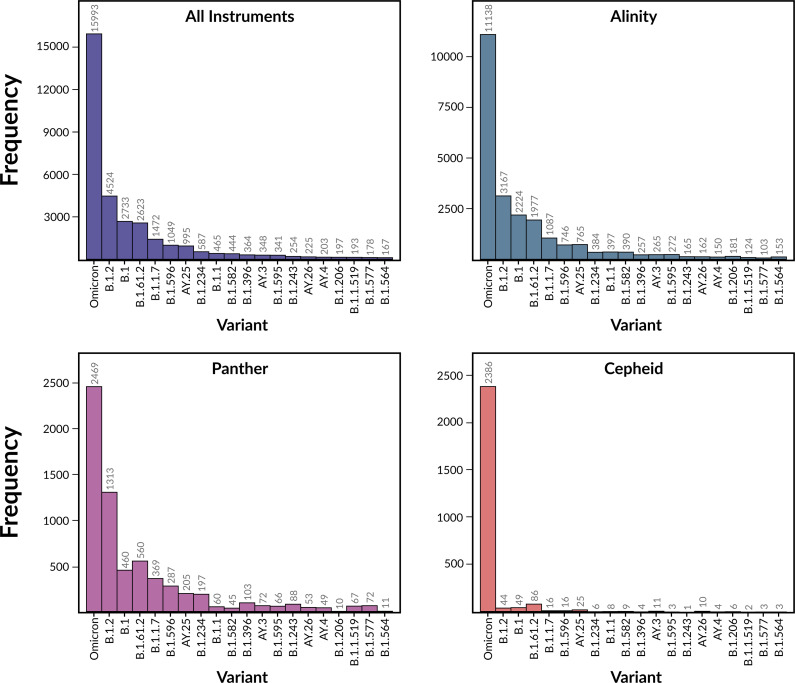
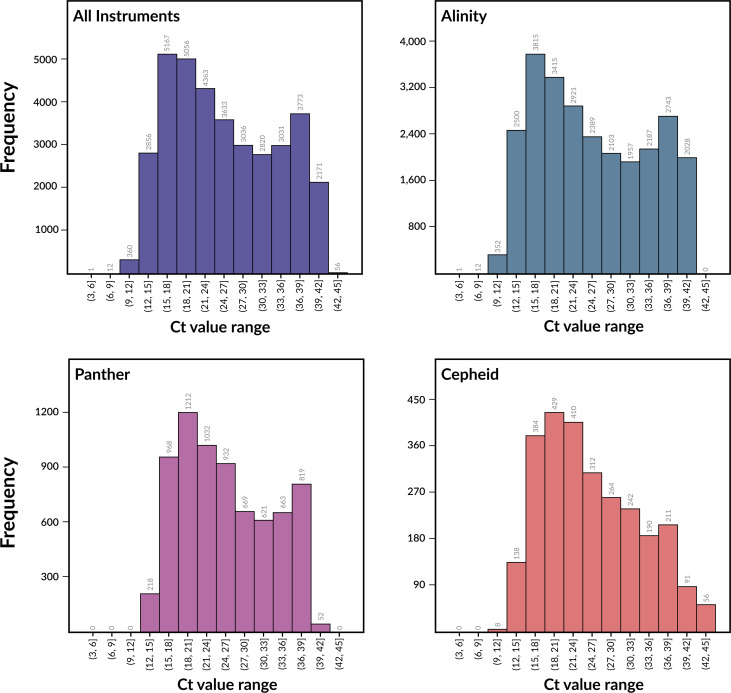
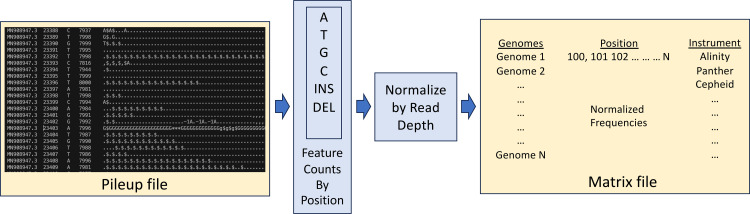
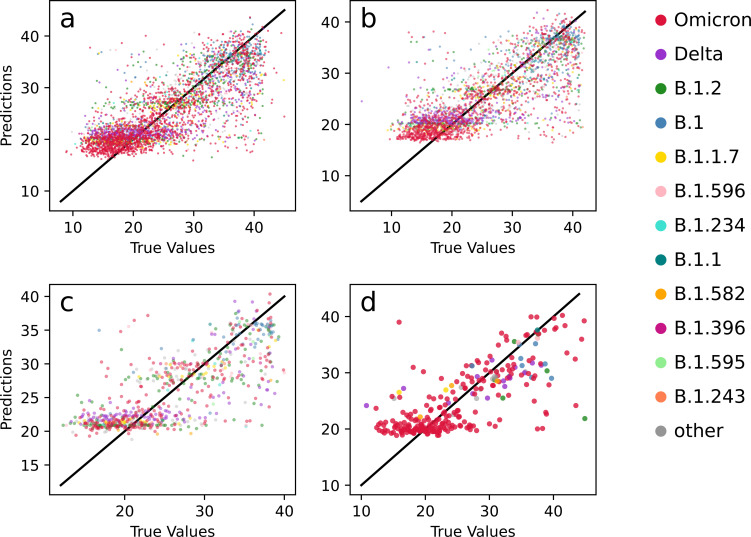
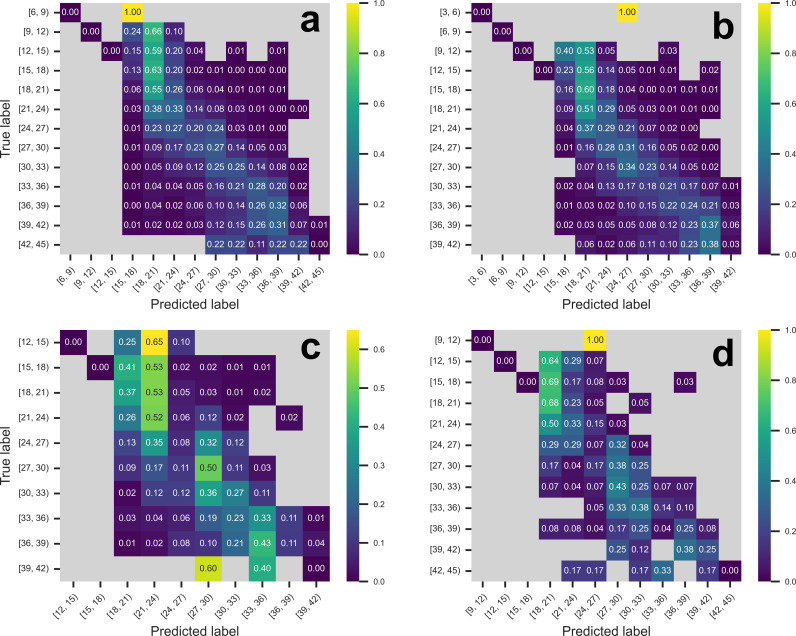
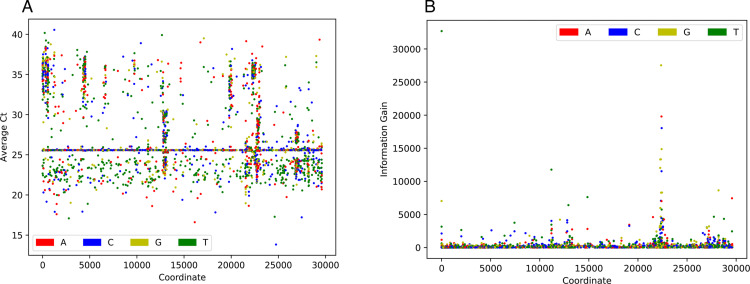
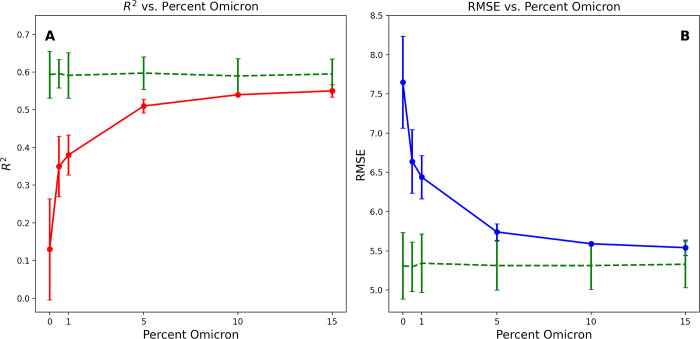
Over the last four years, each successive wave of the COVID-19 pandemic has been caused by variants with mutations that improve the transmissibility of the virus. Despite this, we still lack tools for predicting clinically important features of the virus. In this study, we show that it is possible to predict the PCR cycle threshold (Ct) values from clinical detection assays using sequence data. Ct values often correspond with patient viral load and the epidemiological trajectory of the pandemic. Using a collection of 36,335 high quality genomes, we built models from SARS-CoV-2 intrahost single nucleotide variant (iSNV) data, computing XGBoost models from the frequencies of A, T, G, C, insertions, and deletions at each position relative to the Wuhan-Hu-1 reference genome. Our best model had an R2 of 0.604 [0.593-0.616, 95% confidence interval] and a Root Mean Square Error (RMSE) of 5.247 [5.156-5.337], demonstrating modest predictive power. Overall, we show that the results are stable relative to an external holdout set of genomes selected from SRA and are robust to patient status and the detection instruments that were used. This study highlights the importance of developing modeling strategies that can be applied to publicly available genome sequence data for use in disease prevention and control.
Copyright: This is an open access article, free of all copyright, and may be freely reproduced, distributed, transmitted, modified, built upon, or otherwise used by anyone for any lawful purpose. The work is made available under the Creative Commons CC0 public domain dedication.
Conflict of interest statement
The authors have declared that no competing interests exist.
Figures
Similar articles
-
SARS-CoV-2 genomic diversity and the implications for qRT-PCR diagnostics and transmission.Genome Res. 2021 Apr;31(4):635-644. doi: 10.1101/gr.268961.120. Epub 2021 Feb 18. Genome Res. 2021. PMID: 33602693 Free PMC article.
-
Distinct mutations and lineages of SARS-CoV-2 virus in the early phase of COVID-19 pandemic and subsequent 1-year global expansion.J Med Virol. 2022 May;94(5):2035-2049. doi: 10.1002/jmv.27580. Epub 2022 Jan 18. J Med Virol. 2022. PMID: 35001392 Free PMC article.
-
Precision Response to the Rise of the SARS-CoV-2 B.1.1.7 Variant of Concern by Combining Novel PCR Assays and Genome Sequencing for Rapid Variant Detection and Surveillance.Microbiol Spectr. 2021 Sep 3;9(1):e0031521. doi: 10.1128/Spectrum.00315-21. Epub 2021 Aug 11. Microbiol Spectr. 2021. PMID: 34378966 Free PMC article.
-
Advancements in detection of SARS-CoV-2 infection for confronting COVID-19 pandemics.Lab Invest. 2022 Jan;102(1):4-13. doi: 10.1038/s41374-021-00663-w. Epub 2021 Sep 8. Lab Invest. 2022. PMID: 34497366 Free PMC article. Review.
-
SARS-CoV-2 variants evolved during the early stage of the pandemic and effects of mutations on adaptation in Wuhan populations.Int J Biol Sci. 2021 Jan 1;17(1):97-106. doi: 10.7150/ijbs.47827. eCollection 2021. Int J Biol Sci. 2021. PMID: 33390836 Free PMC article. Review.
References
-
- WHO COVID-19 Dashboard Geneva: World Health Organization; 2020 [cited 2022 09/06/2022]. Available from: https://covid19.who.int/.
-
- Anonymous. SARS-CoV-2 Variant Classifications and Definitions: Centers for Disease Control and Prevention, National Center for Immunization and Respiratory Diseases (NCIRD), Division of Viral Diseases; [10–24–2022]. Available from: https://www.cdc.gov/coronavirus/2019-ncov/variants/variant-classificatio....
-
- SARS-CoV-2 Variant Classifications and Definitions: Centers for Disease Control and Prevention; 2022 [cited 2022 09/06/2022]. Available from: https://www.cdc.gov/coronavirus/2019-ncov/variants/variant-classificatio....
MeSH terms
Supplementary concepts
Grants and funding
LinkOut - more resources
Full Text Sources
Medical
Miscellaneous
