

Exploring common biomarkers of ischemic stroke and obstructive sleep apnea through bioinformatics analysis
- PMID: 39475897
- PMCID: PMC11524449
- DOI: 10.1371/journal.pone.0312013
Exploring common biomarkers of ischemic stroke and obstructive sleep apnea through bioinformatics analysis
Abstract
Background: Clinical observations have shown that many patients with ischemic stroke (IS) have a history of obstructive sleep apnea (OSA) both before and after the stroke's onset, suggesting potential underlying connections and shared comorbid mechanisms between the two conditions. The aim of this study is to identify the genetic characteristics of OSA patients who develop IS and to establish a reliable disease diagnostic model to assess the risk of IS in OSA patients.
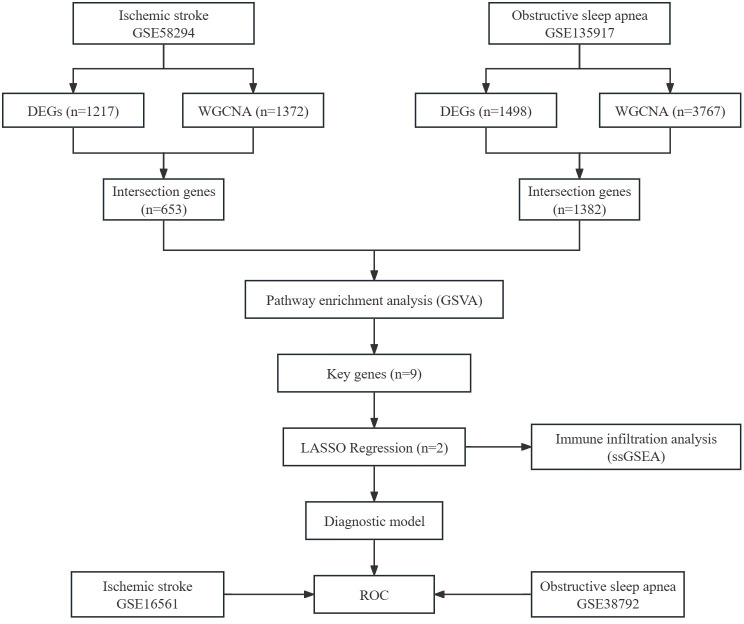
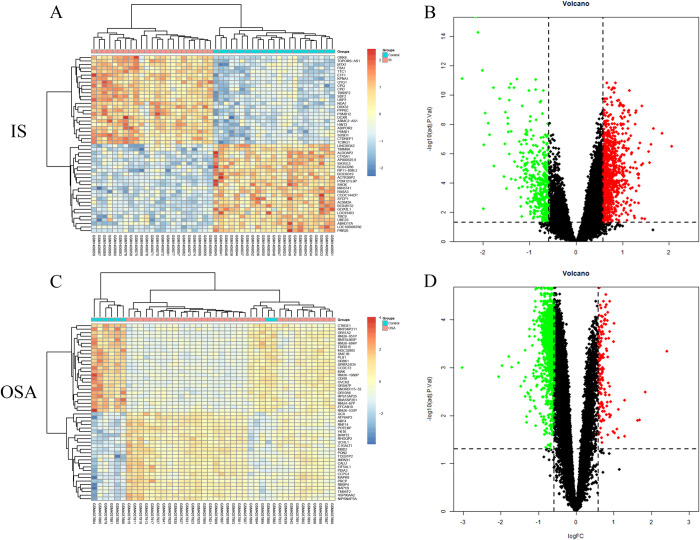
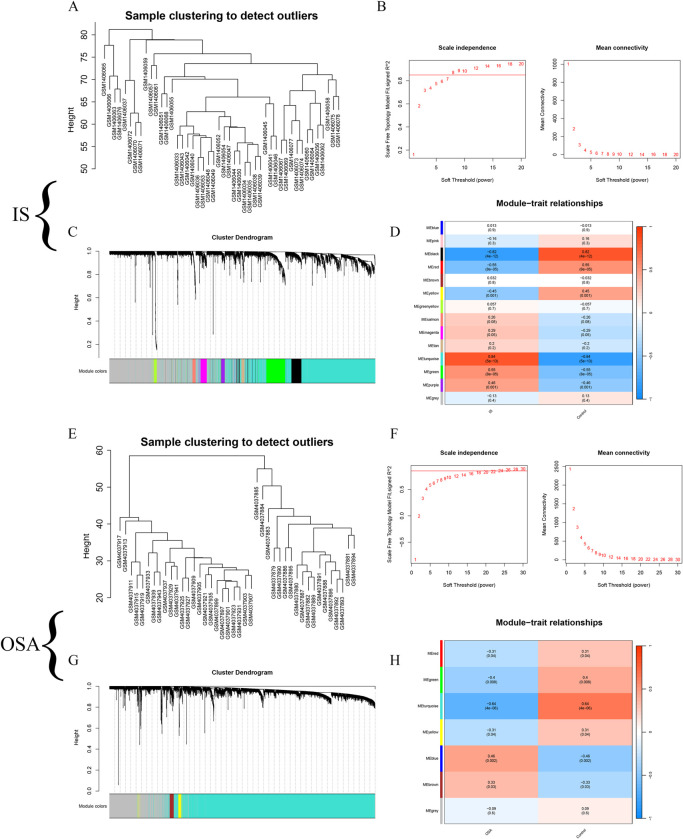
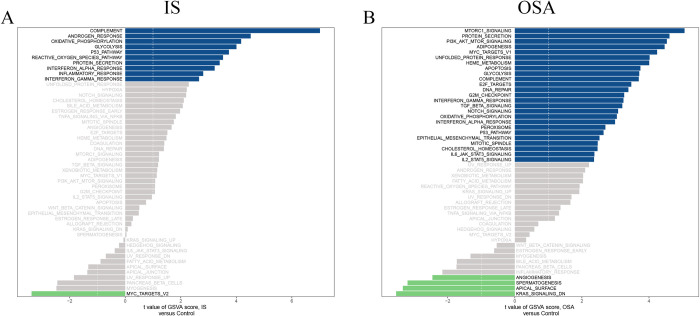
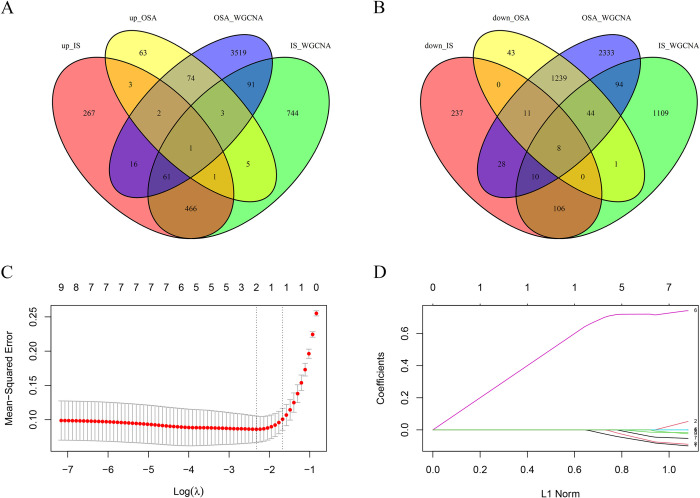
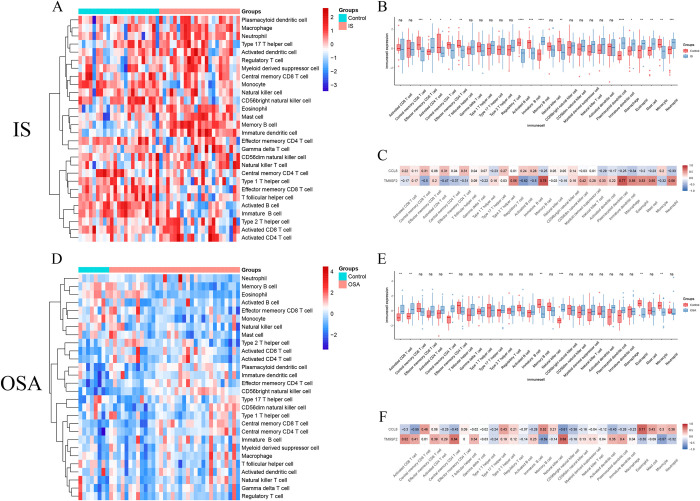
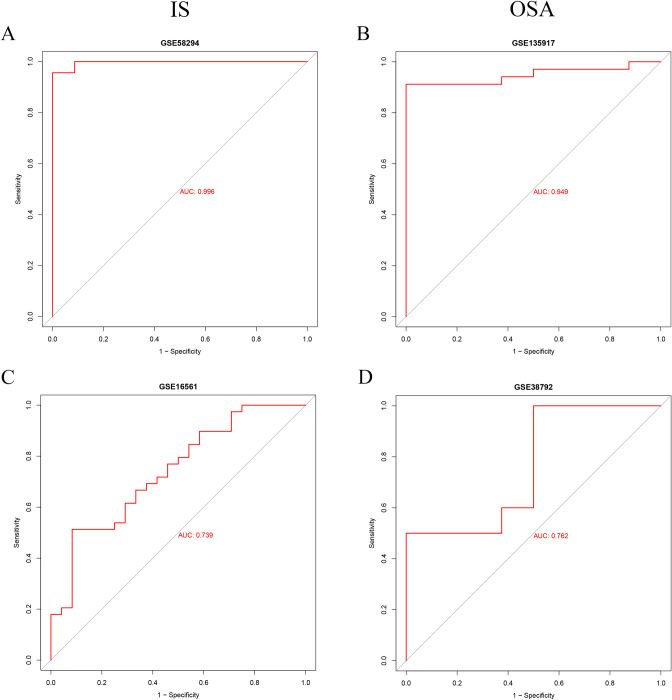
Methods: We selected IS and OSA datasets from the Gene Expression Omnibus (GEO) database as training sets. Core genes were identified using the Limma package, Weighted Gene Co-expression Network Analysis (WGCNA), and machine learning algorithms. Gene Set Variation Analysis (GSVA) was conducted for pathway enrichment analysis, while single-sample gene set enrichment analysis (ssGSEA) was employed for immune infiltration analysis. Finally, a diagnostic model was developed using Least Absolute Shrinkage and Selection Operator (LASSO) regression, with its diagnostic efficacy validated using receiver operating characteristic (ROC) curves across two independent validation sets.
Results: The results revealed that differential analysis and machine learning identified two common genes, TM9SF2 and CCL8, shared between IS and OSA. Additionally, seven signaling pathways were found to be commonly upregulated in both conditions. Immune infiltration analysis demonstrated a significant decrease in monocyte levels, with TM9SF2 showing a negative correlation and CCL8 showing a positive correlation with monocytes. The diagnostic model we developed exhibited excellent predictive value in the validation set.
Conclusions: In summary, two immune-related core genes, TM9SF2 and CCL8, were identified as common to both IS and OSA. The diagnostic model developed based on these genes may be used to predict the risk of IS in OSA patients.
Copyright: © 2024 Wu et al. This is an open access article distributed under the terms of the Creative Commons Attribution License, which permits unrestricted use, distribution, and reproduction in any medium, provided the original author and source are credited.
Conflict of interest statement
The authors have declared that no competing interests exist.
Figures
Similar articles
-
Exploring the potential biomarkers between stroke and obstructive sleep apnea by WGCNA and machine learning.Sleep Breath. 2025 Jun 20;29(4):219. doi: 10.1007/s11325-025-03369-1. Sleep Breath. 2025. PMID: 40540134
-
Identification of novel biomarkers in obstructive sleep apnea via integrated bioinformatics analysis and experimental validation.PeerJ. 2023 Dec 4;11:e16608. doi: 10.7717/peerj.16608. eCollection 2023. PeerJ. 2023. PMID: 38077447 Free PMC article.
-
Screening of obstructive sleep apnea and diabetes mellitus -related biomarkers based on integrated bioinformatics analysis and machine learning.Sleep Breath. 2025 Jan 13;29(1):74. doi: 10.1007/s11325-024-03240-9. Sleep Breath. 2025. PMID: 39804507 Free PMC article.
-
Exploration of the shared diagnostic genes and mechanisms between periodontitis and primary Sjögren's syndrome by integrated comprehensive bioinformatics analysis and machine learning.Int Immunopharmacol. 2024 Nov 15;141:112899. doi: 10.1016/j.intimp.2024.112899. Epub 2024 Aug 13. Int Immunopharmacol. 2024. PMID: 39142001
-
Identification of Novel Biomarkers for Ischemic Stroke Through Integrated Bioinformatics Analysis and Machine Learning.J Mol Neurosci. 2025 Jan 25;75(1):13. doi: 10.1007/s12031-025-02309-8. J Mol Neurosci. 2025. PMID: 39862324
References
MeSH terms
Substances
LinkOut - more resources
Full Text Sources
Medical
