. 2025 Jan 2;85(1):32-51.
doi: 10.1158/0008-5472.CAN-24-0529.

H4K20me3-Mediated Repression of Inflammatory Genes Is a Characteristic and Targetable Vulnerability of Persister Cancer Cells

Affiliations

H4K20me3-Mediated Repression of Inflammatory Genes Is a Characteristic and Targetable Vulnerability of Persister Cancer Cells

Valentina Ramponi et al. Cancer Res. .

Abstract

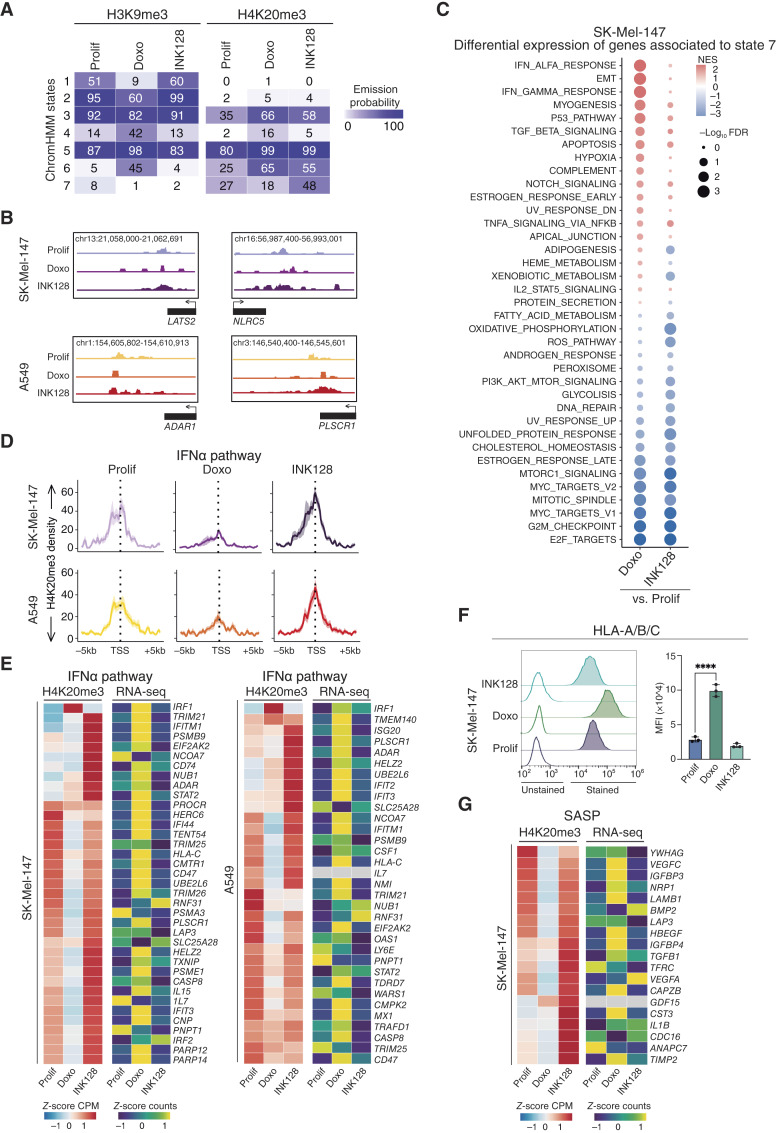
Anticancer therapies can induce cellular senescence or drug-tolerant persistence, two types of proliferative arrest that differ in their stability. While senescence is highly stable, persister cells efficiently resume proliferation upon therapy termination, resulting in tumor relapse. Here, we used an ATP-competitive mTOR inhibitor to induce and characterize persistence in human cancer cells of various origins. Using this model and previously described models of senescence, we compared the same cancer cell lines under the two types of proliferative arrest. Persister and senescent cancer cells shared an expanded lysosomal compartment and hypersensitivity to BCL-XL inhibition. However, persister cells lacked other features of senescence, such as loss of lamin B1, senescence-associated β-galactosidase activity, upregulation of MHC-I, and an inflammatory and secretory phenotype (senescence-associated secretory phenotype or SASP). A genome-wide CRISPR/Cas9 screening for genes required for the survival of persister cells revealed that they are hypersensitive to the inhibition of one-carbon (1C) metabolism, which was validated by the pharmacologic inhibition of serine hydroxymethyltransferase, a key enzyme that feeds methyl groups from serine into 1C metabolism. Investigation into the relationship between 1C metabolism and the epigenetic regulation of transcription uncovered the presence of the repressive heterochromatic mark H4K20me3 at the promoters of SASP and IFN response genes in persister cells, whereas it was absent in senescent cells. Moreover, persister cells overexpressed the H4K20 methyltransferases KMT5B/C, and their downregulation unleashed inflammatory programs and compromised the survival of persister cells. In summary, this study identifies distinctive features and actionable vulnerabilities of persister cancer cells and provides mechanistic insight into their low inflammatory activity. Significance: Cell persistence and senescence are distinct states of proliferative arrest induced by cancer therapy, with persister cells being characterized by the silencing of inflammatory genes through the heterochromatic mark H4K20me3. See related commentary by Schmitt, p. 7.


Conflict of interest statement

M. Kovatcheva reports personal fees from mesoestetic and Galapagos outside the submitted work. A.E. Lord reports grants and personal fees from Barry Reed Fund outside the submitted work. M. Serrano reports grants from AECC during the conduct of the study, as well as other support from Altos Labs, Inc, Rejuversen, AG, Senolytic Therapeutics, SL, Life Biosciences, Inc., and grants from Galapagos, NV outside the submitted work. No disclosures were reported by the other authors.

Figures

None
Graphical abstract
Figure 1.
Figure 1.
INK128-treated cells undergo a reversible cell-cycle arrest with features of persistence and embryonic diapause. A, Brightfield pictures of SK-Mel-147 and A549 cells untreated (proliferating), treated with INK128 (100 and 200 nmol/L, respectively) for 7 days, and after INK128 withdrawal for 3 days. Scale bar, 100 μm. B, Proliferation curve of SK-Mel-147 and A549 cells untreated (proliferating), treated with INK128, and after INK128 withdrawal (n = 3). Cells were counted using a hemocytometer after 24 hours from plating, 3, 5, 7, and 10 days (or 3 days after INK128 withdrawal; n = 3). *, P < 0.05; **, P < 0.01; ***, P < 0.001; multiple unpaired Student t test. C, mRNA expression levels of DEC2 (BHLHE41) and p27 (CDKN1B) in untreated (proliferating) and INK128-treated SK-Mel-147 and A549 cells, measured by qRT-PCR (relative to the average expression of housekeeping genes ACTB and GAPDH). *, P < 0.05; **, P < 0.01; unpaired Student t test, compared with proliferating controls (n = 3 or 4). D, GSEA of INK128-treated SK-Mel-147 and A549 cells in comparison to untreated (proliferating) controls. Normalized enrichment score (NES) is color-coded, whereas statistical significance (FDR) is encoded in the size of the dots. E, GSEA of a signature of embryonic diapause, on the left genes upregulated in diapause and on the right genes downregulated in diapause. The signatures were analyzed in INK128-treated vs. proliferating SK-Mel-147 cells. F, Signature scores of control proliferating cells, DTP in response to irinotecan, cells that had exited persistence upon withdrawal of irinotecan (recovery), and cells that were resistant to irinotecan and did not undergo DTP (resistant; published datasets from Rehman and colleagues, ref. 24), when interrogated for the expression of the INK128 downregulated signature and the INK128 upregulated signature (proliferating n = 8; all the other conditions n = 3). *, P < 0.05; ***, P < 0.001; one-way ANOVA compared with proliferating cancer cells.
Figure 2.
Figure 2.
Shared features between persister and senescent cancer cells. A, Flow cytometry analysis of LysoTracker Red in proliferating, senescent [palbociclib (palbo) and doxorubicin (doxo)], and persister (INK128) SK-Mel-147 and A549 cells. Representative histograms showing the fluorescence signal of each stained sample and its unstained control (uncolored histogram). Quantification of the mean fluorescence intensity (MFI) after autofluorescence subtraction (n = 3 SK-Mel-147; n = 4 A549). *, P < 0.05; **, P < 0.01; ***, P < 0.001; ****, P < 0.0001; one-way ANOVA compared with proliferating control cells. B, Crystal violet viability assay of proliferating, palbociclib-treated, doxorubicin-treated, and INK128-treated SK-Mel-147 and A549 cells after navitoclax treatment (72 hours) at 5 and 1 μmol/L. Percentage of survival was calculated in comparison to each respective untreated control (n = 3). Quantification was done using the Synergy HTX absorbance microplate reader. *, P < 0.05; **, P < 0.01; ***, P < 0.001; ****, P < 0.0001; two-way ANOVA compared with proliferating controls. C, BCL2, BCL-W, and BCL-XL and γ-tubulin protein levels in proliferating, palbociclib-treated, doxorubicin-treated, and INK128-treated SK-Mel-147 cells. A representative immunoblot is shown (n = 3 for BCL2 and BCL-W; n = 5 for BCL-XL). *, P < 0.05; **, P < 0.01; one-way ANOVA compared with proliferating controls. D, Schematic of the protocol used for siRNA transfection and viability assessment. E, CellTiter-Glo viability assay of proliferating, palbociclib-treated, doxorubicin-treated, and INK128-treated SK-Mel-147 cells treated with siRNAs targeting BCL2, BCL-W (BCL2L2), and BCL-XL (BCL2L1). Viability was assessed 5 days after siRNA transfection (n = 3). Raw data for quantification were acquired by measuring luminescence in a VICTOR Multilabel Plate Reader (PerkinElmer). *, P < 0.05; **, P < 0.01; ***, P < 0.001; one-way ANOVA compared with proliferating controls. F, Schematic of the cancer treatment protocol used in this study. G, Left, percentage of cells stained positive for DEC2 by IHC in vehicle, BEZ235, and BEZ235 + Navi tumors, at the end of the treatment (day 9; n = 6–8). Right, mRNA expression levels of p27 (CDKN1B) in vehicle, BEZ235, and BEZ235 + Navi tumors at the end of the treatment (day 9), measured by qRT-PCR (relative to the average expression of housekeeping genes ACTB and GAPDH). *, P < 0.05; **, P < 0.01; one-way ANOVA compared with proliferating controls (n = 6–8). H, Tumor volume at sacrifice of SK-Mel-147 tumor-bearing animals treated with vehicle, navitoclax, BEZ235, and BEZ235 + navitoclax (n = 4/5). *, P < 0.05; ****, P < 0.001; two-way ANOVA analysis considering all the groups and all the days (for full graphs see Supplementary Fig. S4).
Figure 3.
Figure 3.
Distinctive features between persister and senescent cancer cells. A, SA-β-GAL staining (blue) of proliferating, palbociclib-treated, doxorubicin-treated, and INK128-treated SK-Mel-147 after 7 days from the beginning of the treatment. B, Flow cytometry analysis of total ROS in proliferating, palbociclib (palbo)-treated, doxorubicin (doxo)-treated, and INK128-treated SK-Mel-147 cells. Representative histograms showing the fluorescence signal of each stained sample and its unstained control (uncolored histogram). Quantification of the mean fluorescence intensity (MFI) after autofluorescence subtraction (n = 3). ***, P < 0.001; ****, P < 0.0001; one-way ANOVA compared with proliferating control cells. C, LMNB1 and γ-tubulin protein levels in proliferating, palbociclib-treated, doxorubicin-treated, and INK128-treated SK-Mel-147 cells. A representative immunoblot is shown (n = 2). *, P < 0.05; one-way ANOVA compared with proliferating controls. D, Proliferation curve of SAOS2 and U2OS cells untreated (proliferating), treated with palbociclib (5 μmol/L) and treated with INK128 (100 nmol/L). Cells were counted using a hemocytometer after 24 hours from plating, 3, 5, 7, and 10 days (n = 3). *, P < 0.05; ***, P < 0.001; ****, P < 0.0001; multiple unpaired Student t test. E, SA-β-GAL staining (blue) of proliferating, palbociclib-treated, and INK128-treated SAOS2 and U2OS after 7 days from the beginning of the treatment. Scale bar, 50 μm.
Figure 4.
Figure 4.
Persister cancer cells lack a SASP. A, Principal component (PC) analysis of proliferating, palbociclib-treated, doxorubicin-treated, and INK128-treated SK-Mel-147 cells (n = 4). B, GSEA of palbociclib-treated, doxorubicin-treated, and INK128-treated vs. proliferating SK-Mel-147 and A549 cells. Only pathways significantly differentially regulated in SK-Mel-147 or A549 cells are represented. Normalized enrichment scores (NES) and log10 FDR are indicated. C, Dot plot summarizing the results of preranked GSEA analysis testing the differential enrichment of SASP gene sets (49) in palbociclib-treated, doxorubicin-treated, and INK128-treated vs. proliferating SK-Mel-147 and A549 cells. NES and log10 (FDR) are indicated. D, Signature scores of proliferating, DTP, recovery, and resistant colorectal cancer cells (published datasets from Rehman and colleagues, ref. 24) when interrogated for the expression of the SASP gene sets (proliferating, n = 8; all the other conditions, n = 3; ref. 49). ***, P < 0.01; one-way ANOVA compared with proliferating controls.
Figure 5.
Figure 5.
Whole-genome CRISPR/Cas9 screen identifies 1C metabolism as a specific vulnerability of persister cancer cells. A, Schematic of the CRISPR/Cas9 screening experiment used in this study. B, Venn diagram displaying sgRNAs depleted in proliferating and diapause mESCs with a log2FC cutoff of −1. C,Prdx1 sgRNA counts in proliferating and diapause mESCs untreated (Cas9 off) and treated (Cas9 on) with doxycycline (proliferating Cas9 off mESCs, n = 2; all the other conditions, n = 3). ****, P < 0.0001; one-way ANOVA vs. Cas9 off diapause mESC. D, Top 10 significantly enriched terms from EnrichR BioPlanet 2019 when analyzing the genes found depleted in the diapause mESCs treated with doxycycline. Combined score is performed using the EnrichR software by multiplying the log P value from the Fisher exact test by the z-score of the deviation from the expected rank. E, Schematic of the 1C metabolism. Red dots, the genes identified as depleted in the screen in diapause mESC. F, Representation of the log2FC of all the sgRNAs detected in the screen in proliferating mESC and diapause mESC (fold change of Cas9 on vs. Cas9 off for each condition). Red points, genes associated with 1C metabolism; blue point, Prdx1, the most depleted gene in the diapause mESC condition. G, CellTiter-Glo viability assay of proliferating, palbociclib (palbo)-treated, doxorubicin (doxo)-treated, and INK128-treated SK-Mel-147 cells transfected with siMS (MTR) and siBHMT for 5 days (n = 3 or 4). The percentage of survival was calculated in comparison to the respective siNT. Raw data for quantification were acquired by measuring luminescence in a VICTOR Multilabel Plate Reader (PerkinElmer). **, P < 0.01; ****, P < 0.0001; one-way ANOVA compared with proliferating controls. H, Cell count. Proliferating, doxorubicin-treated, and INK128-treated SK-Mel-147 cells (doxorubicin and INK128 treatments lasted 7 days) were counted before (day 0) or after 4 days of (+)SHIN2 treatment (50 and 100 μmol/L). Cells were counted using the CellDrop CellCounter (DeNovix). ***, P < 0.001; two-way ANOVA compared with cell count at day 0. I, CellTiter-Glo viability assay of proliferating and INK128-treated SK-Mel-147 cells with supplementation of homocysteine at three different concentrations: 1.67, 5, 15 mmol/L (n = 3). Viability was assessed 72 hours after Hcy supplementation. Raw data for quantification were acquired by measuring luminescence in a VICTOR Multilabel Plate Reader (PerkinElmer). **, P < 0.01; two-way ANOVA.
Figure 6.
Figure 6.
Persister cancer cells present H4K20me3 foci. A, H4K20me3, total H4, H3K9me3, H3K27me3, H3K4me3, H3K4me1, and total H3 protein levels in proliferating, palbociclib (palbo)-treated, doxorubicin (doxo)-treated, and INK128-treated SK-Mel-147 cells. A representative immunoblot is shown (n = 5 for H4K20me3 and n = 3 for H3K9me3, H3K27me3, H3K4me3, and H3K4me1). Quantification in Supplementary Fig. S6. B, Immunostaining of H4K20me3 (red) and DAPI (blue) in proliferating, palbociclib-treated, doxorubicin-treated, and INK128-treated SK-Mel-147 cells. Scale bar, 10 μm. Right, quantification of foci per cell. ***, P < 0.001; ****, P < 0.0001; one-way ANOVA compared with proliferating controls. n = 53, proliferating; n = 43, palbociclib; n = 38, doxorubicin; n = 44, INK128. C, mRNA expression levels of KMT5B (SUV420H1) and KMT5C (SUV420H2) in untreated (proliferating) and INK128-treated SK-Mel-147 cells, measured by qRT-PCR (relative to the average expression of housekeeping genes ACTB and GAPDH). *, P < 0.05; ***, P < 0.001; unpaired Student t test, compared with proliferating controls (n = 4). D, H4K20me3 and total H4 protein levels in proliferating, INK128-treated (6 hours, 12 hours, 7 days) and INK128-recovery (7 days of INK128 treatment, folowed by 3 days of withdrawal) SK-Mel-147 cells. A representative immunoblot (left) and quantification (right) from n = 2 is shown. H4K20me3 levels were normalized on total H4 levels. *, P < 0.05; **, P < 0.01; one-way ANOVA compared with INK128 (7 days). E, Immunostaining of H4K20me3 (red) and DAPI (blue) of SK-Mel-147 cells in the following conditions: proliferating, INK128-treated, and cells after 3 days from INK128 withdrawal. Representative images are shown. Scale bar, 10 μm. Right, quantification of mean fluorescence intensity (MFI). ****, P < 0.0001; one-way ANOVA compared with INK128 (7 days). Cell numbers were n = 46 (proliferating), n = 40 (INK128), n = 60 (recovery 3 days).
Figure 7.
Figure 7.
H4K20me3 is differentially associated with IFN and SASP promoter regions in senescent and persister cancer cells. A, Heatmap summarizing the ChromHMM emission matrix of H3K9me3 and H4K20me3 over the ChromHMM states 1–7 in proliferating, doxorubicin (doxo)-treated, INK128-treated SK-Mel-147 and A549 cells (n = 3). B, Bigwigs of examples of promoter regions that exhibit increased H4K20me3 signal in chromatin from INK128-treated compared with proliferating and doxorubicin-treated SK-Mel-147 and A549 cells. C, Dotplots of preranked GSEA associated with the ChromHMM state 7 of SK-Mel-147 and A549 cells, where genes were ranked according to their fold change between treated and controls cells. Normalized enrichment score (NES) is color-coded, whereas statistical significance (FDR) is encoded in the size of the dots. D, H4K20me3 signal over promoters of genes in the GSEA hallmark gene sets related to IFNα pathway that intersect with ChromHMM state 7 in proliferating, doxorubicin-treated, INK128-treated A549 and SK-Mel-147 cells. E, Heatmaps plotting the levels of H4K20me3 over promoters in gene set “Hallmark interferon alpha response” that intersect with ChromHMM state 7 in proliferating, doxorubicin-treated, INK128-treated SK-Mel-147 and A549 cells. This is accompanied by a heatmap plotting the normalized RNA-seq counts for these genes, averaging replicates (n = 4). F, Flow cytometry analysis of human (HLA-A/B/C) MHC-I expression in proliferating, palbociclib-treated, doxorubicin-treated, and INK128-treated SK-Mel-147 cells. Representative histograms showing the fluorescence signal of each stained sample and its unstained control (uncolored histogram). Quantification of the mean fluorescence intensity (MFI) after autofluorescence subtraction (n = 3). ****, P < 0.0001; one-way ANOVA compared with proliferating control cells. G, Heatmaps plotting the levels of H4K20me3 over promoters of SASP genes (previously defined in Supplementary Fig. S4B) that intersect with ChromHMM state 7 in proliferating, doxorubicin-treated, and INK128-treated SK-Mel-147 cells. This is accompanied by a heatmap plotting the normalized RNA-seq counts for these genes, averaging replicates (n = 4).
Figure 8.
Figure 8.
Persister cancer cells activate inflammatory programs upon inhibition of methyltransferases KMT5B/C. A, Gene expression levels of IFN-related genes measured by qRT-PCR (relative to the average expression of housekeeping genes ACTB and GAPDH) of INK128-treated SK-Mel-147 cells transfected with siNT, siKMT5B, siKMT5C, and siKMT5B/C (7 days of treatment with INK128, followed by siRNA transfection and analysis 2 days later; n = 4). Please note that in the case of siKMT5B/C, only two replicates have been considered for further analysis, based on the efficiency of the silencing. B, Viability as measured by CellTiter-Glo assay of proliferating SK-Mel-147 cells transfected with siKMT5B+C for 5 days, SK-Mel-147 cells treated with INK128 and transfected at the same time with siKMT5B/C until the end of the assay at day 12 (d0–d12), and SK-Mel-147 cells treated with INK128 and transfected 7 days later with siKMT5B+C until day 12 (d7–d12; n = 3 or 4). The percentage of survival was calculated in comparison to the respective siNT. Raw data for quantification were acquired by measuring luminescence in a VICTOR Multilabel Plate Reader (PerkinElmer). **, P < 0.01; one-way ANOVA compared with proliferating controls. C, Graphical summary of the mechanism of differential inflammatory profiles in senescent and persister cancer cells. See text for details.

Similar articles

Cited by

References

    1. De Conti G, Dias MH, Bernards R. Fighting drug resistance through the targeting of drug-tolerant persister cells. Cancers (Basel) 2021;13:1118. - PMC - PubMed
    1. Wang B, Kohli J, Demaria M. Senescent cells in cancer therapy: friends or foes? Trends Cancer 2020;6:838–57. - PubMed
    1. Cabanos HF, Hata AN. Emerging insights into targeted therapy-tolerant persister cells in cancer. Cancers 2021;13:2666. - PMC - PubMed
    1. Vallette FM, Olivier C, Lézot F, Oliver L, Cochonneau D, Lalier L, et al. . Dormant, quiescent, tolerant and persister cells: four synonyms for the same target in cancer. Biochem Pharmacol 2019;162:169–76. - PubMed
    1. Montagner M, Sahai E. In vitro models of breast cancer metastatic dormancy. Front Cell Dev Biol 2020;8:37. - PMC - PubMed

MeSH terms