. 2025 Jan 15;85(2):378-398.
doi: 10.1158/0008-5472.CAN-24-0886.

The Functional Transcriptomic Landscape Informs Therapeutic Strategies in Multiple Myeloma

Affiliations

The Functional Transcriptomic Landscape Informs Therapeutic Strategies in Multiple Myeloma

Praneeth Reddy Sudalagunta et al. Cancer Res. .

Abstract

Several therapeutic agents have been approved for treating multiple myeloma, a cancer of bone marrow-resident plasma cells. Predictive biomarkers for drug response could help guide clinical strategies to optimize outcomes. In this study, we present an integrated functional genomic analysis of tumor samples from patients multiple myeloma that were assessed for their ex vivo drug sensitivity to 37 drugs, clinical variables, cytogenetics, mutational profiles, and transcriptomes. This analysis revealed a multiple myeloma transcriptomic topology that generates "footprints" in association with ex vivo drug sensitivity that have both predictive and mechanistic applications. Validation of the transcriptomic footprints for the anti-CD38 mAb daratumumab (DARA) and the nuclear export inhibitor selinexor (SELI) demonstrated that these footprints can accurately classify clinical responses. The analysis further revealed that DARA and SELI have anticorrelated mechanisms of resistance, and treatment with a SELI-based regimen immediately after a DARA-containing regimen was associated with improved survival in three independent clinical trials, supporting an evolutionary-based strategy involving sequential therapy. These findings suggest that this unique repository and computational framework can be leveraged to inform underlying biology and to identify therapeutic strategies to improve treatment of multiple myeloma. Significance: Functional genomic analysis of primary multiple myeloma samples elucidated predictive biomarkers for drugs and molecular pathways mediating therapeutic response, which revealed a rationale for sequential therapy to maximize patient outcomes.


Conflict of interest statement

P.R. Sudalagunta reports personal fees from FORUS Therapeutics Inc. outside the submitted work; in addition, P.R. Sudalagunta has a patent for “A model of clinical synergy in cancer, PCT/US2020/062232 (WO/2021/108551-A1)” pending, a patent for “A multiomic approach to modeling of gene regulatory networks in multiple myeloma, PCT/US2022/024217 (WO/2022/217136-A1)” pending, and a patent for “Altering epigenetic landscapes control progression and refractory disease states in multiple myeloma, PCT/US2023/078667 (WO/2024/097981)” pending. R.R. Canevarolo reports a patent for WO2024097981A1 pending to Moffitt Cancer Center, a patent for WO2022217136A1 pending to Moffitt Cancer Center, and a patent for WO2021108551A1 pending to Moffitt Cancer Center. M.B. Meads reports a patent for “A model of clinical synergy in cancer,” PCT/US2020/062232 (WO/2021/108551-A1), priority date November 25, 2019, pending to H. Lee Moffitt Cancer Center and Research Institute, a patent for “A multiomic approach to modeling of gene regulatory networks in multiple myeloma,” PCT/US2022/024217 (WO/2022/217136-A1), priority date October 04, 2021, pending to H. Lee Moffitt Cancer Center and Research Institute, and a patent for “Altering epigenetic landscapes control progression and refractory disease states in multiple myeloma,” PCT/US2023/078667 (WO/2024/09798-A1), priority date March 11, 2022, pending to H. Lee Moffitt Cancer Center and Research Institute. O. Hampton reports O. Hampton was a paid employee of Aster Insights while conduction of research. J.K. Teer reports grants from the NIH during the conduct of the study; in addition, J.K. Teer has a patent for Negative Information Storage Model issued. B.D. Shah reports grants, personal fees, and other support from Kite/Gilead, other support from Servier and Pepromene Bio, personal fees and other support from Jazz, and personal fees from Novartis, Deciphera, Takeda, Beigene, Pfizer, Bristol Myers Squibb, Amgen, Adaptive, Lilly/Loxo, from Autolus, and Syndax outside the submitted work. L. Hazlehurst reports being a cofounder of Modulation Therapeutics, but this work is not related to the current pipeline at Modulation Therapeutics. Y. Chai reports other support from Karyopharm Therapeutics during the conduct of the study. A. DeCastro reports was a former employee of one of the therapeutics tested in the study (Karyopharm Therapeutics). E.M. Siegel reports grants from the NIH NCI outside the submitted work. M. Alsina reports grants from Bristol Myers Squibb and other support from Janssen and Sanofi outside the submitted work. T. Nishihori reports other support from Novartis and Karyopharm Therapeutics outside the submitted work. J.L. Cleveland reports grants from the NCI/NIH during the conduct of the study. W. Dalton reports grants from Karyopharm Therapeutics during the conduct of the study and personal fees from AsterInsights outside the submitted work. C.J. Walker reports other support from Karyopharm Therapeutics during the conduct of the study. Y. Landesman used to work for Karyopharm Therapeutics and still holds stock of the company. R. Baz reports personal fees and other support from Janssen, other support from Abbvie, Regeneron, and Bristol Myers Squibb, and personal fees from Pfizer and Cellectar outside the submitted work. A.S. Silva reports a patent for A.S. Silva, K.H. Shain, P.R. Sudalagunta, R.R. Canevarolo, and M.B. Meads, “A model of clinical synergy in cancer,” PCT/US2020/062232 (WO/2021/108551-A1), priority date November 25, 2019, issued, a patent for A.S. Silva, K.H. Shain, P.R. Sudalagunta, R.R. Canevarolo, and M.B. Meads, “A multiomic approach to modeling of gene regulatory networks in multiple myeloma,” PCT/US2022/024217 (WO/2022/217136-A1), priority date October 04, 2021, pending, and a patent for A.S. Silva, K.H. Shain, P.R. Sudalagunta, R.R. Canevarolo, and M.B. Meads, “Altering epigenetic landscapes control progression and refractory disease states in multiple myeloma,” U.S. Provisional Application No. 63/422,106, priority date March 11, 2022, pending. K.H. Shain reports grants and personal fees from Karyopharm Therapeutics during the conduct of the study and grants from Abbvie and personal fees from Bristol Myers Squibb, Janssen, Amgen, Regeneron, Adaptive, and Sanofi outside the submitted work; in addition, K.H. Shain has a patent for 10110-243US1 pending and a patent for 10110-363WO1 issued. No disclosures were reported by the other authors.

Figures

None
Graphical abstract
Figure 1.
Figure 1.
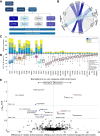
Overview of the approach, ex vivo drug sensitivity database, and biomarkers for drug sensitivity in multiple myeloma. A, An overview of the proposed computational approach and integrating disparate sources of patient data, cytogenetics, WES, RNA-seq, and ex vivo drug sensitivity measures to synergistically identify novel therapeutic strategies in multiple myeloma. B, A circle plot showing the number of patients from each data source and the number of matched samples used in each type of analysis. C, A stacked bar plot of the number of patients in each disease state for each drug tested using the ex vivo drug sensitivity assay. Each bar represents the total number of samples tested with a given drug, in which most standard-of-care drugs are tested in more than 300 samples each. Samples are also denoted by four disease statuses: smoldering multiple myeloma (SMOL), newly diagnosed multiple myeloma (ND), early relapsed/refractory multiple myeloma (ER; 1–3 prior lines of therapy), and late relapsed/refractory multiple myeloma (LR; >3 lines of therapy). D, The ex vivo response measures by 96-hour AUCs of all patients tested with each drug as a box-and-whisker plot grouped by the class of the drug and arranged from most sensitive to least sensitive within each class. Disease states, cytogenetic abnormalities, and driver mutations in multiple myeloma that are associated with a statistically significant association with resistance or sensitivity to each drug are listed on the y-axis by the AUC. E, The volcano plot shows biomarkers identified for each drug by comparing ex vivo AUCs between patients with multiple myeloma who have the biomarker vs. those who do not. In this bubble plot, the size of the bubble represents −log10-adjusted P value, and the color signifies the extent of association with resistance (red) and sensitivity (blue) estimated by the median difference in AUCs. Multi-test correction and Benjamini–Hochberg correction were carried out across all comparisons across drugs and candidate biomarkers, which include disease states, cytogenetic abnormalities, and mutations. The y-axis of the volcano plot signifies statistical significance of the identified biomarker for each drug/biomarker pair, and the x-axis shows the median difference between the groups compared in each comparison. The drug/biomarker pairs on the left (blue) signify biomarkers for sensitivity, and the ones featured on the right (red) signify biomarkers for resistance.
Figure 2.
Figure 2.
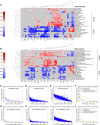
GSEA identifies cancer hallmarks and KEGG pathways enriched for sensitivity and resistance. A, A clustergram of the normalized enrichment score computed using cancer hallmarks as supervised gene sets, in which normalized enrichment score represents the enrichment of a cancer hallmark by overexpression of genes implicated in resistance (red) or underexpression of genes implicated in sensitivity (blue) using GSEA. B, A clustergram using KEGG pathways as the supervised gene sets to carry out GSEA. C–E, All pairwise correlations (R2) of z-normalized gene expression of any two genes within each cancer hallmark, KEGG pathway, and coexpressing Moffitt gene cluster are plotted with the ranked percentile of each gene set on x-axis and their respective R2 values on the y-axis. Red line, median correlation within each gene set; blue bars, interquartile range of R2. F, A plot showing median pairwise correlations within each gene set as a function of the ranked (by median correlation) percentile of gene sets for each of cancer hallmarks (red), KEGG pathways (blue), and Moffitt unsupervised clusters (green). G–J, These plots reproduce plots (C–F) using coexpressing gene clusters obtained from CoMMpass (36) RNA-seq data.
Figure 3.
Figure 3.
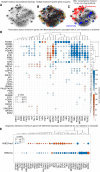
The transcriptomic landscape in multiple myeloma identifies gene expression footprints of drug resistance and sensitivity. A, The multiple myeloma transcriptomic landscape identified by carrying out dimensionality reduction using t-SNE on normalized gene expression data from RNA-seq. B, Clusters of coexpressing genes identified by fuzzy c-means clustering, which serve as multiple myeloma–specific gene programs. C, Gene programs that are enriched for resistance (red) and sensitivity (blue) to SELI using GSEA. D and E, Bubble plots showing combined Enrichr score for sensitivity in blue and resistance in red, with the size of the bubble signifying the P value of the enrichment as identified by a one-sided Fisher exact test.
Figure 4.
Figure 4.
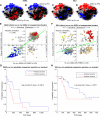
Validation of transcriptomic footprints identified for ex vivo drug sensitivity and resistance. A and B, Enriched gene programs for ex vivo resistance (red) and sensitivity (blue) for DARA (A) and the gene sets enriched for clinical response (PFS; B). C and D, Comparison of enriched gene programs from ex vivo (C) and clinical response (PFS; D) for SELI. E and F, Correlation of GSEA ESs for gene programs that are featured in both ex vivo and clinical gene sets for DARA (E) and SELI (F), respectively. Gray represents nonsignificant gene sets, and yellow represents gene sets that GSEA suggested opposing enrichments for that gene cluster in ex vivo and clinical contexts. FWER, family-wise error rate. G, Median gene expressions of enriched gene programs identified from ex vivo response (A and C) are used to predict the AUC using a regression tree model. This predicted AUC from gene expression is used to classify patients as sensitive and resistant, whereas the PFS for these patients (who received DARA in the clinic immediately after the biopsy used for RNA-seq) is used to compare probability of progression using a Kaplan–Meier plot. H, Kaplan–Meier plot showing the ability of ex vivo–identified gene programs to classify patients clinically for SELI.
Figure 5.
Figure 5.
Correlations of GSEA ESs suggest novel therapeutic strategies. A, Clustergram of correlations of GSEA ESs for each cluster for every pair of drugs tested ex vivo identifies pairs of drugs that have positively correlated and negatively correlated transcriptomic footprints. B, A scatter plot showing the relationship between correlation of GSEA transcriptomic footprints and differences in the median of combination and additive responses (AUC combination effect). Each bubble (or circle) represents a two-drug combination that has a corresponding pairwise correlation between the constituent single agents in A. The blue and red bubbles represent statistically significant synergistic and antagonistic combinations, respectively, whereas the gray bubbles represent a nonsignificant combination effect or additivity. C, A scatter plot showing only statistically significant two-drug combinations from B or Supplementary Fig. S2, in which the correlation of GSEA transcriptomic footprints and the AUC combination effect are subjected to Pearson linear correlation. D, A box-and-whisker plot showing the difference in correlation of GSEA transcriptomic footprints between statistically significant synergistic and antagonistic combinations from B or Supplementary Fig. S2. The correlations from the two groups were subjected to a two-tailed unpaired t test, and the P value for this comparison is shown.
Figure 6.
Figure 6.
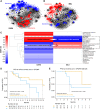
SELI and DARA: a novel sequential therapy informed by multiple myeloma functional transcriptomics. A and B, A clustergram of enriched cancer hallmarks for ex vivo drug sensitivity or resistance to SELI and DARA. C, The anticorrelative ex vivo transcriptomic footprints of SELI and DARA. D and E, The probability of PFS compared between the two groups shows improved survival in patients treated with a SELI-based regimen combined with a DARA-based regimen as an immediate prior line in STOMP and XPORT-MM-028.

References

    1. Moore DC, Oxencis CJ, Shank BR. New and emerging pharmacotherapies for management of multiple myeloma. Am J Health Syst Pharm 2022;79:1137–45. - PubMed
    1. Mimura N, Hideshima T, Anderson KC. Novel therapeutic strategies for multiple myeloma. Exp Hematol 2015;43:732–41. - PMC - PubMed
    1. Dimopoulos MA, Jakubowiak AJ, McCarthy PL, Orlowski RZ, Attal M, Bladé J, et al. Developments in continuous therapy and maintenance treatment approaches for patients with newly diagnosed multiple myeloma. Blood Cancer J 2020;10:17. - PMC - PubMed
    1. Wallington-Beddoe CT, Mynott RL. Prognostic and predictive biomarker developments in multiple myeloma. J Hematol Oncol 2021;14:151. - PMC - PubMed
    1. Kumar SK, Callander NS, Adekola K, Anderson L, Baljevic M, Campagnaro E, et al. Multiple myeloma, version 3.2021, NCCN clinical practice guidelines in oncology. J Natl Compr Canc Netw 2020;18:1685–717. - PubMed

MeSH terms