

A New Intraocular Lens Power Formula Integrating an Artificial Intelligence-Powered Estimation for Effective Lens Position Based on Chinese Eyes
- PMID: 39476087
- PMCID: PMC11534016
- DOI: 10.1167/tvst.13.10.40
A New Intraocular Lens Power Formula Integrating an Artificial Intelligence-Powered Estimation for Effective Lens Position Based on Chinese Eyes
Abstract
Purpose: To develop and evaluate a new intraocular lens (IOL) formula based on Chinese eyes.
Methods: A training dataset of 709 eyes undergoing uneventful cataract surgery was used to train the algorithm for effective lens position estimation. The algorithm was then integrated with Gaussian optics to develop the new IOL formula (Jin-AI). From the same center, 177 eyes served as an internal test dataset. An independent dataset of 557 eyes served as an external test dataset. The standard deviation (SD) of prediction errors was compared among the Jin-AI formula, traditional third-generation formulas (SRK/T, Holladay 1, Hoffer Q), and newer generation formulas (Kane, Barrett Universal II [BUII], Hill-radial basis function [RBF] 3.0, and PEARL-DGS).
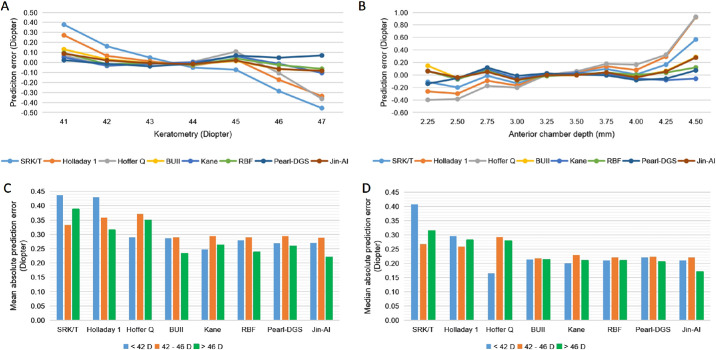
Results: In the internal test dataset, the Jin-AI formula showed the lowest SD (0.25 D), followed by the BUII (0.31 D), Kane (0.33 D), and PEARL-DGS (0.33 D) formulas. In the external test dataset, the Jin-AI, Kane, and PEARL-DGS formulas had the lowest SD (0.38 D), followed by the BUII (0.39 D), Hill-RBF 3.0 (0.39 D), SRK/T (0.45 D), Holladay 1 (0.48 D), and Hoffer Q (0.48 D) formulas. The SD of the Jin-AI formula was significantly lower than the third-generation formulas and comparable to the four newer generation formulas. Predictive accuracy of the Jin-AI formula was similar to the newer generation formulas across all axial length, keratometry, and anterior chamber depth ranges.
Conclusions: The new formula has exhibited good performance in predicting postoperative refractions. Its overall predictive accuracy was better than the third-generation formulas and comparable to the newer generation ones.
Translational relevance: The Jin-AI formula could be a reliable alternative for IOL power calculation in Chinese.
Conflict of interest statement
Disclosure:
Figures


References
-
- Kane JX, Chang DF.. Intraocular lens power formulas, biometry, and intraoperative aberrometry: a review. Ophthalmology. 2021; 128: e94–e114. - PubMed
-
- Norrby S. Sources of error in intraocular lens power calculation. J Cataract Refract Surg. 2008; 34: 368–376. - PubMed
-
- Haigis W, Lege B, Miller N, Schneider B.. Comparison of immersion ultrasound biometry and partial coherence interferometry for intraocular lens calculation according to Haigis. Graefes Arch Clin Exp Ophthalmol. 2000; 238: 765–773. - PubMed
Publication types
MeSH terms
LinkOut - more resources
Full Text Sources
Research Materials
