Clinical Trial
. 2025 Jan 9;145(2):202-219.
doi: 10.1182/blood.2024025987.

Forimtamig, a novel GPRC5D-targeting T-cell bispecific antibody with a 2+1 format, for the treatment of multiple myeloma

Affiliations
Clinical Trial

Forimtamig, a novel GPRC5D-targeting T-cell bispecific antibody with a 2+1 format, for the treatment of multiple myeloma

Jan Eckmann et al. Blood. .

Abstract

Despite several approved therapies, multiple myeloma (MM) remains an incurable disease with high unmet medical need. "Off-the-shelf" T-cell bispecific antibodies (TCBs) targeting B-cell maturation antigen (BCMA) and G protein-coupled receptor class C group 5 member D (GPRC5D) have demonstrated high objective response rates in heavily pretreated patients with MM; however, primary resistance, short duration of response, and relapse driven by antigen shift frequently occur. Although GPRC5D represents the most selective target in MM, recent findings indicate antigen loss occurs more frequently than with BCMA. Thus, anti-GPRC5D immunotherapies must hit hard during a short period of time. Here, we characterize forimtamig, a novel GPRC5D-targeting TCB with 2+1 format. Bivalent binding of forimtamig to GPRC5D confers higher affinity than classical 1+1 TCB formats correlating with formation of more stable immunological synapses and higher potency in tumor cell killing and T-cell activation. Using an orthotopic mouse model of MM, forimtamig recruited T effector cells to the bone marrow and induced rapid tumor killing even after the introduction of step-up dosing to mitigate cytokine release. Combination of forimtamig with standard-of-care agents including anti-CD38 antibodies, immunomodulatory drugs, and proteasome inhibitors improved depth and duration of response. The combination of forimtamig with novel therapeutic agents including BCMA TCB and cereblon E3 ligase modulatory drugs was potent and prevented occurrence of GPRC5D -negative tumor relapse. Forimtamig is currently being evaluated in phase 1 clinical trials in patients with relapsed and refractory MM for monotherapy and in combination treatments. This trial was registered at www.ClinicalTrials.gov as #NCT04557150.


Conflict of interest statement

Conflict-of-interest disclosure: J.E., T.F., R.R., C.H., T.P., G.H., R.F., S.G., R.A., C. Kirstenpfad, L.K., S. Lechner, A.B., I.D., A.-M.B., J.A., I.L., F.C., S. Leclair, T.C., G.F., C.D., L.M., C.B., Q.D., F.O., F.B., C.G., S.D., T.K., M.K., M.B., S. Lechner, and P.U. are employees of Roche. C.K., A.C., M.M., L. Bernasconi, and W.X. are former employees of Roche. S.D., F.B., C. Klein, I.D., T.F., J.A., L.K., C.H., F.C., M.B., and M.M. hold stock options of F. Hoffmann-La Roche. J.E., T.F., M.B., S.L., T.C., A.C., A.B., A.-M.B., I.D., F.B., L.K., F.C., G.F., C.G., S.D., C. Kirstenpfad, T.K., C.H., M.M., L.B., S. Leclair, W.X., C. Klein, and P.U. declare patents with Roche. The remaining authors declare no competing financial interests.

Figures
None
Graphical abstract
Figure 1.
Figure 1.
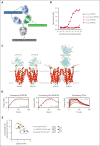
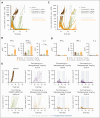
Biochemical characterization of forimtamig and synapse formation. (A) The molecular model of forimtamig was generated and visualized with discovery studio 2021; residues involved in the P329G LALA silent Fc mutations are shown as spheres colored in cyan. (B) Binding kinetics was measured using horseradish peroxidase (HRP)-based colorimetric analysis in Chinese hamster ovary (CHO) cells transfected with mouse, cynomolgus, or human GPRC5D or human GPRC5A and incubated with increasing concentrations of forimtamig. (C) The likely epitope of forimtamig could be mapped to the unstructured N terminus of GPRC5D and is shown in the context of 2 recently published cryo-electro magnetic (EM) structures of GPRC5D homodimer, in complex with 2 scFvs (protein data bank (PDB) ID 8yzk) and in complex with a single talquetamab Fab anti-GPRC5D (PDB ID 9ima); the core epitope (yellow ball and stick representation) consists of GPRC5D residues 5 to 10, but an additional involvement of residues 11 to 16 (gray stick representation) cannot be ruled out; as the unstructured N terminus is not or only partially resolved in the published structures, the missing N-terminal segments (purple ribbon representation) were remodeled from the AlphaFold model and the shown conformations represent only a placeholder for a whole ensemble of possible conformations; the actual conformation of GPRC5D’s N-terminal segment in complex with forimtamig anti-GPRC5D has yet to be determined. (D) Grating-coupled interferometry (GCI) was used to determine affinities (equilibrium dissociation constant, KD) of forimtamig and forimtamig monovalent Fab to human GPRC5D and of forimtamig to human CD3ε; black lines indicate fit according to a 1:1 Langmuir model. (E) Correlation of contact duration and speed of fluorescently labeled T cells as measured by confocal live cell imaging to determine the stability of immunological synapses; all treatments are at 200 ng/mL. scFv, single-chain variable fragment.
Figure 2.
Figure 2.
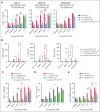
GPRC5D protein expression in patients with RRMM and evaluation of TCB potency in vitro. (A) GPRC5D receptor density on MMPCs in bone marrow aspirates from 61 patients with RRMM enrolled in study NCT04557150 (3 samples from 64 could not be reported due to technical issues); these values are depicted on the y-axis of the plot and each dot represents 1 sample; dashed lines on the graph represent mean values for GPRC5D receptor density for 7 cell lines with names of the cell lines specified respectively; GPRC5D receptor density was determined by bead quantification using MESF beads for patient samples and Quantum Simply Cellular kit for cell lines (technical details are described in supplemental Materials and methods). (B) Association between overall cytogenetic risk or individual chromosomal aberrations and GPRC5D binding sites on MM cells in BM; high risk was defined as having ≥1 of the following chromosomal aberrations (regardless of 1q21gain/ampl): del(17p), t(4;14), t(14;16); the 1q21gain/ampl group was defined as having only 1q21gain/ampl reported; N indicates the number of samples that could be evaluated for the target expression. (C-G) MM cell lines with different GPRC5D and BCMA receptor densities (RDs) were cocultured with human peripheral blood mononuclear cells (PBMCs) from 4 to 5 individual healthy donors at an effector-to-target (E:T) ratio of 5:1 and treated with increasing concentrations of forimtamig, 2+1 BCMA TCB, 1+1 GPRC5D TCB, or a untargeted TCB control; LDH release was measured as a surrogate for tumor cell lysis after 40 hours; Triton X-100–treated samples were used to determined maximum tumor lysis and untreated samples to determine spontaneous tumor lysis; expression levels of CD69 and CD25 were measured by flow cytometry as a surrogate for CD8 T-cell activation after 40 hours; EC50 values were calculated from dose-response curves from individual donors; in case curve fits did not allow valid EC50 calculations (if curves either did not reach the top or bottom plateau or had a very wide confidence interval), data were not plotted; and statistical differences between treatment groups were determined per cell line using 1-way analysis of variance (ANOVA) with Tukey posttest analysis. ∗P < .05; ∗∗P < .005. EC50, median effective concentration; LDH, lactate dehydrogenase; MESF, molecules of equivalent soluble fluorophore; ns, not significant.
Figure 2.
Figure 2.
GPRC5D protein expression in patients with RRMM and evaluation of TCB potency in vitro. (A) GPRC5D receptor density on MMPCs in bone marrow aspirates from 61 patients with RRMM enrolled in study NCT04557150 (3 samples from 64 could not be reported due to technical issues); these values are depicted on the y-axis of the plot and each dot represents 1 sample; dashed lines on the graph represent mean values for GPRC5D receptor density for 7 cell lines with names of the cell lines specified respectively; GPRC5D receptor density was determined by bead quantification using MESF beads for patient samples and Quantum Simply Cellular kit for cell lines (technical details are described in supplemental Materials and methods). (B) Association between overall cytogenetic risk or individual chromosomal aberrations and GPRC5D binding sites on MM cells in BM; high risk was defined as having ≥1 of the following chromosomal aberrations (regardless of 1q21gain/ampl): del(17p), t(4;14), t(14;16); the 1q21gain/ampl group was defined as having only 1q21gain/ampl reported; N indicates the number of samples that could be evaluated for the target expression. (C-G) MM cell lines with different GPRC5D and BCMA receptor densities (RDs) were cocultured with human peripheral blood mononuclear cells (PBMCs) from 4 to 5 individual healthy donors at an effector-to-target (E:T) ratio of 5:1 and treated with increasing concentrations of forimtamig, 2+1 BCMA TCB, 1+1 GPRC5D TCB, or a untargeted TCB control; LDH release was measured as a surrogate for tumor cell lysis after 40 hours; Triton X-100–treated samples were used to determined maximum tumor lysis and untreated samples to determine spontaneous tumor lysis; expression levels of CD69 and CD25 were measured by flow cytometry as a surrogate for CD8 T-cell activation after 40 hours; EC50 values were calculated from dose-response curves from individual donors; in case curve fits did not allow valid EC50 calculations (if curves either did not reach the top or bottom plateau or had a very wide confidence interval), data were not plotted; and statistical differences between treatment groups were determined per cell line using 1-way analysis of variance (ANOVA) with Tukey posttest analysis. ∗P < .05; ∗∗P < .005. EC50, median effective concentration; LDH, lactate dehydrogenase; MESF, molecules of equivalent soluble fluorophore; ns, not significant.
Figure 3.
Figure 3.
Benchmarking of forimtamig against other TCBs in preclinical models of MM. (A-B) Fresh bone marrow aspirates from patients with NDMM were depleted of CD138+ plasma cells and cocultured with RPMI-8226 (6 samples enrolled), MOLP-8 (9 samples enrolled), or AMO-1 (12 samples enrolled) tumor cells with a wide range of GPRC5D and BCMA RDs at a final E:T ratio of 5:1 in the presence of increasing concentrations of forimtamig, 1+1 GPRC5D TCB, 2+1 BCMA TCB, or an untargeted TCB control antibody at 0.007 nM; expression of CD25 on CD8 TILs was measured by flow cytometry after 48 hours; baseline CD25 expression, as detected by an untargeted TCB control, is represented by the horizontal black dotted line; cytokine secretion was analyzed in the supernatant of T-cell–myeloma cell line cocultures after 36 hours; graphs summarizing the mean + standard error of the mean (SEM) expression and statistics between groups were determined by 1-way ANOVA with Tukey posttest analysis. ∗P < .05; ∗∗P < .005; ∗∗∗P < .0005; ∗∗∗∗P < .0001. (C-D) Total BM cells from 9 patients with NDMM were cultured in the presence of increasing concentrations of forimtamig, 1+1 GPRC5D TCB, 2+1 BCMA TCB, or an untargeted TCB control at 0.007 nM; expression of CD25 on CD4 and CD8 TILs was measured by flow cytometry after 36 hours; baseline CD25 expression, as detected by an untargeted TCB control, is represented by the horizontal black dotted line; and graphs summarizing the mean + SEM expression and statistics between groups were determined by 1-way ANOVA with Tukey posttest analysis. ∗P < .05; ∗∗P < .005; ∗∗∗P < .0005. (E) Total BM cells from 13 patients with NDMM were cultured in the presence of the indicated concentration of TCBs for 36 hours; graphs summarizing the mean + SEM depletion of MMPCs as calculated by the frequency of CD38+CD138+ double-positive cells in relation to untreated TCB control; graphs summarizing the mean + SEM expression and statistics between groups were determined by 1-way ANOVA with Tukey posttest analysis. ∗P < .05; ∗∗P < .005; ∗∗∗P < .0005. (F) Humanized NSG mice (huNSG) were subcutaneously implanted with 2.5 × 106 NCI-H929 tumor cells and when tumors reached 200 to 250 mm3 injected once a week IV with indicated TCB doses; tumor growth was measured over time using caliper and was plotted as individual spider plots for each of the 9 animals per group; animals treated with 2+1 BCMA TCB at 10 mg/kg were taken down after 2 cycles as they reached predefined termination criteria (see “Materials and methods”). TNFα, tumor necrosis factor α.
Figure 3.
Figure 3.
Benchmarking of forimtamig against other TCBs in preclinical models of MM. (A-B) Fresh bone marrow aspirates from patients with NDMM were depleted of CD138+ plasma cells and cocultured with RPMI-8226 (6 samples enrolled), MOLP-8 (9 samples enrolled), or AMO-1 (12 samples enrolled) tumor cells with a wide range of GPRC5D and BCMA RDs at a final E:T ratio of 5:1 in the presence of increasing concentrations of forimtamig, 1+1 GPRC5D TCB, 2+1 BCMA TCB, or an untargeted TCB control antibody at 0.007 nM; expression of CD25 on CD8 TILs was measured by flow cytometry after 48 hours; baseline CD25 expression, as detected by an untargeted TCB control, is represented by the horizontal black dotted line; cytokine secretion was analyzed in the supernatant of T-cell–myeloma cell line cocultures after 36 hours; graphs summarizing the mean + standard error of the mean (SEM) expression and statistics between groups were determined by 1-way ANOVA with Tukey posttest analysis. ∗P < .05; ∗∗P < .005; ∗∗∗P < .0005; ∗∗∗∗P < .0001. (C-D) Total BM cells from 9 patients with NDMM were cultured in the presence of increasing concentrations of forimtamig, 1+1 GPRC5D TCB, 2+1 BCMA TCB, or an untargeted TCB control at 0.007 nM; expression of CD25 on CD4 and CD8 TILs was measured by flow cytometry after 36 hours; baseline CD25 expression, as detected by an untargeted TCB control, is represented by the horizontal black dotted line; and graphs summarizing the mean + SEM expression and statistics between groups were determined by 1-way ANOVA with Tukey posttest analysis. ∗P < .05; ∗∗P < .005; ∗∗∗P < .0005. (E) Total BM cells from 13 patients with NDMM were cultured in the presence of the indicated concentration of TCBs for 36 hours; graphs summarizing the mean + SEM depletion of MMPCs as calculated by the frequency of CD38+CD138+ double-positive cells in relation to untreated TCB control; graphs summarizing the mean + SEM expression and statistics between groups were determined by 1-way ANOVA with Tukey posttest analysis. ∗P < .05; ∗∗P < .005; ∗∗∗P < .0005. (F) Humanized NSG mice (huNSG) were subcutaneously implanted with 2.5 × 106 NCI-H929 tumor cells and when tumors reached 200 to 250 mm3 injected once a week IV with indicated TCB doses; tumor growth was measured over time using caliper and was plotted as individual spider plots for each of the 9 animals per group; animals treated with 2+1 BCMA TCB at 10 mg/kg were taken down after 2 cycles as they reached predefined termination criteria (see “Materials and methods”). TNFα, tumor necrosis factor α.
Figure 4.
Figure 4.
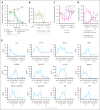
Evaluation of forimtamig’s mode of action in an orthotopic mouse model of MM. (A) Luciferase-labeled NCI-H929 cells were injected into the femur of humanized NSG (huNSG) mice and randomized into 4 different treatment arms based on bioluminescent signals measured as photons per second (p/s); animals were treated once weekly with indicated doses of forimtamig and tumor growth was monitored over time; background signals were determined in nontumor-bearing mice; each group included 10 animals and is presented as mean + SEM. (B) Orthotopically engrafted huNSG mice (n = 5) were treated once weekly with 0.1 mg/kg forimtamig and sBCMA levels were detected in serum of animals before, 4, 24, 48, 72, and 168 hours after dosing using enzyme-linked immunosorbent assay (ELISA). (C-E) Orthotopically engrafted humanized mice (n = 40) were treated once weekly with 0.1 mg/kg forimtamig; BM, blood and serum were harvested from n = 5 animals at 4, 24, 48, 72, and 168 hours, after C1 and C2 dosing, and subjected to fluorescence-activated cell sorting (FACS) or cytokine analysis; CD8 T-cell counts in the tumor tissue (right femur) were normalized against CD8 counts from healthy BM from the same animal (left femur); naïve CD8 T cells were defined as CD62L+CD45RA+ and effector memory T cells as CD4RACD62L. (F) Orthotopically engrafted huNSG mice (n = 15 animals per group) were treated once weekly with 0.5 mg/kg forimtamig flat or 0.005, 0.05, and 0.5 mg/kg SUD at C1D1, C1D8, and C1D15; serum was harvested from n = 5 animals at 10 minutes, 4 hours, and 72 hours after dosing and cytokine levels were measured by bioplex; and fold change in cytokine release was calculated by normalization to vehicle animals at the same time points. (G) Orthotopically engrafted huNSG mice (n = 15 animals per group) were treated once weekly with 0.5 mg/kg forimtamig flat or 0.005, 0.05, and 0.5 mg/kg SUD at C1D1, C1D8, and C1D15, and tumor monitored over time by bioluminescence imaging; and background signals were determined in nontumor-bearing mice. TNF-α, tumor necrosis factor α.
Figure 4.
Figure 4.
Evaluation of forimtamig’s mode of action in an orthotopic mouse model of MM. (A) Luciferase-labeled NCI-H929 cells were injected into the femur of humanized NSG (huNSG) mice and randomized into 4 different treatment arms based on bioluminescent signals measured as photons per second (p/s); animals were treated once weekly with indicated doses of forimtamig and tumor growth was monitored over time; background signals were determined in nontumor-bearing mice; each group included 10 animals and is presented as mean + SEM. (B) Orthotopically engrafted huNSG mice (n = 5) were treated once weekly with 0.1 mg/kg forimtamig and sBCMA levels were detected in serum of animals before, 4, 24, 48, 72, and 168 hours after dosing using enzyme-linked immunosorbent assay (ELISA). (C-E) Orthotopically engrafted humanized mice (n = 40) were treated once weekly with 0.1 mg/kg forimtamig; BM, blood and serum were harvested from n = 5 animals at 4, 24, 48, 72, and 168 hours, after C1 and C2 dosing, and subjected to fluorescence-activated cell sorting (FACS) or cytokine analysis; CD8 T-cell counts in the tumor tissue (right femur) were normalized against CD8 counts from healthy BM from the same animal (left femur); naïve CD8 T cells were defined as CD62L+CD45RA+ and effector memory T cells as CD4RACD62L. (F) Orthotopically engrafted huNSG mice (n = 15 animals per group) were treated once weekly with 0.5 mg/kg forimtamig flat or 0.005, 0.05, and 0.5 mg/kg SUD at C1D1, C1D8, and C1D15; serum was harvested from n = 5 animals at 10 minutes, 4 hours, and 72 hours after dosing and cytokine levels were measured by bioplex; and fold change in cytokine release was calculated by normalization to vehicle animals at the same time points. (G) Orthotopically engrafted huNSG mice (n = 15 animals per group) were treated once weekly with 0.5 mg/kg forimtamig flat or 0.005, 0.05, and 0.5 mg/kg SUD at C1D1, C1D8, and C1D15, and tumor monitored over time by bioluminescence imaging; and background signals were determined in nontumor-bearing mice. TNF-α, tumor necrosis factor α.
Figure 5.
Figure 5.
Combination of forimtamig with SoC agents. (A-D) Total BM cells from 4 (carfi) or 11 (dara and pom) patients with NDMM were cultured in the presence of 1 nM forimtamig, 10 nM daratumumab, 1 μM pomalidomide (48 hours before incubation), 3 nM carfilzomib, or combination of forimtamig with either of the SoC agents for 48 hours, and tumor cell lysis as well as expression of CD69, CD25, CD137, and PD-1 by CD8+ lymphocytes was measured by flow cytometry; tumor cell lysis was calculated by the percentage reduction of CD38+CD138+ double-positive cells in relation to untreated TCB control; and graphs summarizing the mean ± SEM expression and statistical differences against forimtamig monotherapy were determined by 1-way ANOVA with Tukey posttest analysis. ∗P < .05; ∗∗P < .005; ∗∗∗P < .0005; ∗∗∗∗P < .0001. (E-G)Humanized NSG (huNSG) mice were subcutaneously implanted with NCI-H929 tumor cells and when tumors reached 200 mm3 injected once weekly with 0.1 mg/kg forimtamig or combination of forimtamig with 8 mg/kg dara (once weekly, IV), 10 mg/kg pomalidomide (every day, by mouth [po]), or 3 mg/kg carfi (twice weekly, IV). Tumor volume was measured over time using a caliper; treatment was stopped after 6 cycles and mice were monitored for at least 2 additional weeks to check for tumor relapse; each group includes 10 animals and is presented as mean + SEM. (H-J) Serum was harvested from n = 5 animals 48 hours after first forimtamig and 24 hours after first SoC dosing and cytokine levels were measured by bioplex analysis; graphs summarizing the mean ± SEM expression and statistical differences between multiple groups were determined by1e-way ANOVA with Tukey posttest analysis. ∗P < .05; ∗∗P < .005; ∗∗∗P < .0005; ∗∗∗∗P < .0001. hu, human; TNF-α, tumor necrosis factor α.
Figure 6.
Figure 6.
Combination of forimtamig with BCMA TCB. (A-B) BCMA and GPRC5D expression was analyzed in ∼1000 mm3 NCI-H929 tumors that relapsed upon forimtamig treatment at 0.1 mg/kg in experiment 5F by immunohistochemistry and quantified using visiopharm (n = 5 animals per group); control tumors were matched in tumor size but were removed from the study at earlier time points; data are shown as mean ± SEM expression and statistical differences between multiple groups were determined using Student t tests. ∗P < .05; ∗∗P < .005; ∗∗∗P < .0005. (C) huNSG mice were subcutaneously implanted with NCI-H929 tumor cells and when tumors reached 200 to 250 mm3 injected once weekly with forimtamig at 0.1 mg/kg or 1+1 BCMA TCB at 1 mg/kg or the combination of both TCBs using a concomitant schedule starting at C1, C2, or C3; an alternating schedule; or different switch schedules in which 1 TCB was dosed after stopping the second TCB; treatment was stopped after 8 injections and tumor escape was monitored for 10 additional days; tumors growth was monitored twice weekly using caliper measurements. (D) Serum was harvested from n = 5 animals 48 hours after C1, C2, C3, and C4 dosing and cytokine levels were measured by bioplex analysis; and graphs summarizing the mean ± SEM expression and statistical differences between multiple groups were determined by 1-way ANOVA with Tukey posttest analysis. ∗P < .05; ∗∗P < .005; ∗∗∗P < .0005. (E) Blood was collected 48 hours after C1, C2, C3, and C4 TCB dosing and human CD3+ T cells were quantified and characterized using spectral flow cytometry; and graphs summarizing the mean ± SEM expression and statistical differences between multiple groups were determined by 1-way ANOVA with Tukey posttest analysis. ∗P < .05; ∗∗P < .005; ∗∗∗P < .0005; ∗∗∗∗P < .0001. TNF-α, tumor necrosis factor α.
Figure 6.
Figure 6.
Combination of forimtamig with BCMA TCB. (A-B) BCMA and GPRC5D expression was analyzed in ∼1000 mm3 NCI-H929 tumors that relapsed upon forimtamig treatment at 0.1 mg/kg in experiment 5F by immunohistochemistry and quantified using visiopharm (n = 5 animals per group); control tumors were matched in tumor size but were removed from the study at earlier time points; data are shown as mean ± SEM expression and statistical differences between multiple groups were determined using Student t tests. ∗P < .05; ∗∗P < .005; ∗∗∗P < .0005. (C) huNSG mice were subcutaneously implanted with NCI-H929 tumor cells and when tumors reached 200 to 250 mm3 injected once weekly with forimtamig at 0.1 mg/kg or 1+1 BCMA TCB at 1 mg/kg or the combination of both TCBs using a concomitant schedule starting at C1, C2, or C3; an alternating schedule; or different switch schedules in which 1 TCB was dosed after stopping the second TCB; treatment was stopped after 8 injections and tumor escape was monitored for 10 additional days; tumors growth was monitored twice weekly using caliper measurements. (D) Serum was harvested from n = 5 animals 48 hours after C1, C2, C3, and C4 dosing and cytokine levels were measured by bioplex analysis; and graphs summarizing the mean ± SEM expression and statistical differences between multiple groups were determined by 1-way ANOVA with Tukey posttest analysis. ∗P < .05; ∗∗P < .005; ∗∗∗P < .0005. (E) Blood was collected 48 hours after C1, C2, C3, and C4 TCB dosing and human CD3+ T cells were quantified and characterized using spectral flow cytometry; and graphs summarizing the mean ± SEM expression and statistical differences between multiple groups were determined by 1-way ANOVA with Tukey posttest analysis. ∗P < .05; ∗∗P < .005; ∗∗∗P < .0005; ∗∗∗∗P < .0001. TNF-α, tumor necrosis factor α.
Figure 7.
Figure 7.
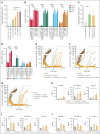
Combination of forimtamig with CELMoDs. (A,C) Humanized NSG (huNSG) mice were subcutaneously implanted with NCI-H929 tumor cells and when tumors reached 200 mm3 injected once weekly IV with forimtamig at 0.1 mg/kg or combination with oral dosing of iberdomide at 10 mg/kg 5 times weekly (5q7d) starting at C1D2 or C3D2; tumor volume of individual mice was measured over time using a caliper; treatment was stopped after 7 forimtamig injections and mice were monitored for at least 2 additional weeks to check for tumor relapse; each group included 10 animals. (B,D) Serum was harvested from n = 5 animals 48 hours after C1 and C3 forimtamig dosing and 24 hours after iberdomide dosing and cytokine levels were measured by bioplex analysis; and graphs summarizing the mean ± SEM expression and statistical differences between multiple groups were determined by 1-way ANOVA with Tukey posttest analysis. ∗P < .05; ∗∗P < .005; ∗∗∗P < .0005. (E) huNSG mice were subcutaneously implanted with NCI-H929 tumor cells and, when tumors reached 200 mm3, injected once weekly with step-up doses of forimtamig at 0.0005, 0.002, and 0.04 mg/kg or combination with oral administration of 1 mg/kg or 3 mg/kg mezigdomide once weekly (1q7d), thrice weekly (3q7d), or 5 times weekly (5q7d). Tumor volume was measured over time using a caliper; treatment was stopped after 7 forimtamig injections and mice were monitored for at least 2 additional weeks to check for tumor relapse; each group included 10 animals. (F) Serum was harvested from n = 5 animals 48 hours after C1D1, C1D8, and C1D15 forimtamig dosing and 24 hours after mezigdomide dosing and cytokine levels were measured by bioplex analysis; graphs summarizing the mean ± SEM expression and statistical differences between multiple groups were determined by 1-way ANOVA with Tukey posttest analysis. ∗P < .05; ∗∗P < .005; ∗∗∗P < .0005. (G) NCI-H929 tumors were isolated from 3 animals of groups A, B, and F (supplemental Figure 7A) 48 hours after 0.002 mg/kg SUD and intratumoral T-cell number and phenotype was analyzed by flow cytometry; graphs summarizing the mean ± SEM expression and statistical differences between multiple groups were determined by 1-way ANOVA with Tukey posttest analysis. ∗P < .05; ∗∗P < .005; ∗∗∗P < .0005. (H-I) Total BM cells from 6 patients with NDMM were cultured in the presence of 0.1 nM forimtamig, 0.1 to 10 nM mezigdomide, or the combination for 96 hours and tumor cell lysis and expression of CD69, CD25, HLADR, CD107a, LAG-3, and PD-1 by CD8 lymphocytes was measured by flow cytometry; untreated and untargeted-TCB treated samples served as reference controls; graphs summarizing the mean ± SEM expression and statistical differences between multiple groups were determined by 2-way ANOVA with Tukey posttest analysis; and statistical analysis for activation markers was referenced against forimtamig monotherapy. ∗P < .05; ∗∗P < .005; ∗∗∗P < .0005; ∗∗∗∗P < .0001. MIG, monokine induced by gamma-interferon; MIP-1a, macrophage inflammatory protein-1 alpha; TNF-α, tumor necrosis factor α.
Figure 7.
Figure 7.
Combination of forimtamig with CELMoDs. (A,C) Humanized NSG (huNSG) mice were subcutaneously implanted with NCI-H929 tumor cells and when tumors reached 200 mm3 injected once weekly IV with forimtamig at 0.1 mg/kg or combination with oral dosing of iberdomide at 10 mg/kg 5 times weekly (5q7d) starting at C1D2 or C3D2; tumor volume of individual mice was measured over time using a caliper; treatment was stopped after 7 forimtamig injections and mice were monitored for at least 2 additional weeks to check for tumor relapse; each group included 10 animals. (B,D) Serum was harvested from n = 5 animals 48 hours after C1 and C3 forimtamig dosing and 24 hours after iberdomide dosing and cytokine levels were measured by bioplex analysis; and graphs summarizing the mean ± SEM expression and statistical differences between multiple groups were determined by 1-way ANOVA with Tukey posttest analysis. ∗P < .05; ∗∗P < .005; ∗∗∗P < .0005. (E) huNSG mice were subcutaneously implanted with NCI-H929 tumor cells and, when tumors reached 200 mm3, injected once weekly with step-up doses of forimtamig at 0.0005, 0.002, and 0.04 mg/kg or combination with oral administration of 1 mg/kg or 3 mg/kg mezigdomide once weekly (1q7d), thrice weekly (3q7d), or 5 times weekly (5q7d). Tumor volume was measured over time using a caliper; treatment was stopped after 7 forimtamig injections and mice were monitored for at least 2 additional weeks to check for tumor relapse; each group included 10 animals. (F) Serum was harvested from n = 5 animals 48 hours after C1D1, C1D8, and C1D15 forimtamig dosing and 24 hours after mezigdomide dosing and cytokine levels were measured by bioplex analysis; graphs summarizing the mean ± SEM expression and statistical differences between multiple groups were determined by 1-way ANOVA with Tukey posttest analysis. ∗P < .05; ∗∗P < .005; ∗∗∗P < .0005. (G) NCI-H929 tumors were isolated from 3 animals of groups A, B, and F (supplemental Figure 7A) 48 hours after 0.002 mg/kg SUD and intratumoral T-cell number and phenotype was analyzed by flow cytometry; graphs summarizing the mean ± SEM expression and statistical differences between multiple groups were determined by 1-way ANOVA with Tukey posttest analysis. ∗P < .05; ∗∗P < .005; ∗∗∗P < .0005. (H-I) Total BM cells from 6 patients with NDMM were cultured in the presence of 0.1 nM forimtamig, 0.1 to 10 nM mezigdomide, or the combination for 96 hours and tumor cell lysis and expression of CD69, CD25, HLADR, CD107a, LAG-3, and PD-1 by CD8 lymphocytes was measured by flow cytometry; untreated and untargeted-TCB treated samples served as reference controls; graphs summarizing the mean ± SEM expression and statistical differences between multiple groups were determined by 2-way ANOVA with Tukey posttest analysis; and statistical analysis for activation markers was referenced against forimtamig monotherapy. ∗P < .05; ∗∗P < .005; ∗∗∗P < .0005; ∗∗∗∗P < .0001. MIG, monokine induced by gamma-interferon; MIP-1a, macrophage inflammatory protein-1 alpha; TNF-α, tumor necrosis factor α.

References

    1. Ludwig H, Durie SN, Meckl A, Hinke A, Durie B. Multiple myeloma incidence and mortality around the globe; interrelations between health access and quality, economic resources, and patient empowerment. Oncol. 2020;25(9):e1406–e1413. - PMC - PubMed
    1. Berdeja JG, Madduri D, Usmani SZ, et al. Ciltacabtagene autoleucel, a B-cell maturation antigen-directed chimeric antigen receptor T-cell therapy in patients with relapsed or refractory multiple myeloma (CARTITUDE-1): a phase 1b/2 open-label study. Lancet. 2021;398(10297):314–324. - PubMed
    1. Munshi NC, Jr., Shah N, Anderson LD, Jr., et al. Idecabtagene vicleucel in relapsed and refractory multiple myeloma. N Engl J Med. 2021;384(8):705–716. - PubMed
    1. San-Miguel J, Dhakal B, Yong K, et al. Cilta-cel or standard care in lenalidomide-refractory multiple myeloma. N Engl J Med. 2023;389(4):335–347. - PubMed
    1. O’Neill C, van de Donk NWCJ. T-cell redirecting bispecific antibodies in multiple myeloma: current landscape and future directions. EJHaem. 2023;4(3):811–822. - PMC - PubMed

Publication types

MeSH terms

Substances

Associated data