. 2024 Nov;63(11):1609-1630.
doi: 10.1007/s40262-024-01434-8. Epub 2024 Oct 30.

Understanding Voriconazole Metabolism: A Middle-Out Physiologically-Based Pharmacokinetic Modelling Framework Integrating In Vitro and Clinical Insights

Affiliations

Understanding Voriconazole Metabolism: A Middle-Out Physiologically-Based Pharmacokinetic Modelling Framework Integrating In Vitro and Clinical Insights

Ayatallah Saleh et al. Clin Pharmacokinet. 2024 Nov.

Abstract

Background and objective: Voriconazole (VRC), a broad-spectrum antifungal drug, exhibits nonlinear pharmacokinetics (PK) due to saturable metabolic processes, autoinhibition and metabolite-mediated inhibition on their own formation. VRC PK is also characterised by high inter- and intraindividual variability, primarily associated with cytochrome P450 (CYP) 2C19 genetic polymorphism. Additionally, recent in vitro findings indicate that VRC main metabolites, voriconazole N-oxide (NO) and hydroxyvoriconazole (OHVRC), inhibit CYP enzymes responsible for VRC metabolism, adding to its PK variability. This variability poses a significant risk of therapeutic failure or adverse events, which are major challenges in VRC therapy. Understanding the underlying processes and sources of these variabilities is essential for safe and effective therapy. This work aimed to develop a whole-body physiologically-based pharmacokinetic (PBPK) modelling framework that elucidates the complex metabolism of VRC and the impact of its metabolites, NO and OHVRC, on the PK of the parent, leveraging both in vitro and in vivo clinical data in a middle-out approach.

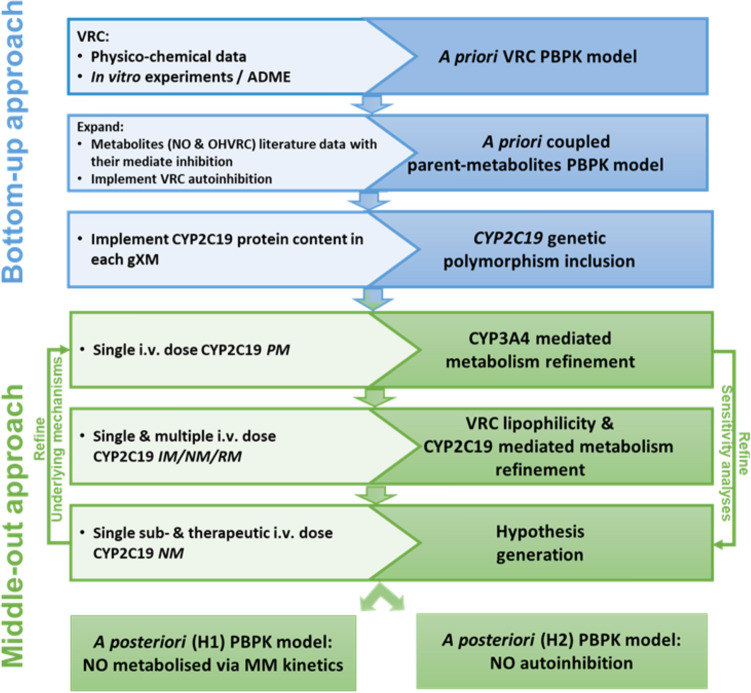
Methods: A coupled parent-metabolite PBPK model for VRC, NO and OHVRC was developed in a stepwise manner using PK-Sim® and MoBi®. Based on available in vitro data, NO formation was assumed to be mediated by CYP2C19, CYP3A4, and CYP2C9, while OHVRC formation was attributed solely to CYP3A4. Both metabolites were assumed to be excreted via renal clearance, with hepatic elimination also considered for NO. Inhibition functions were implemented to describe the complex interaction network of VRC autoinhibition and metabolite-mediated inhibition on each CYP enzyme.

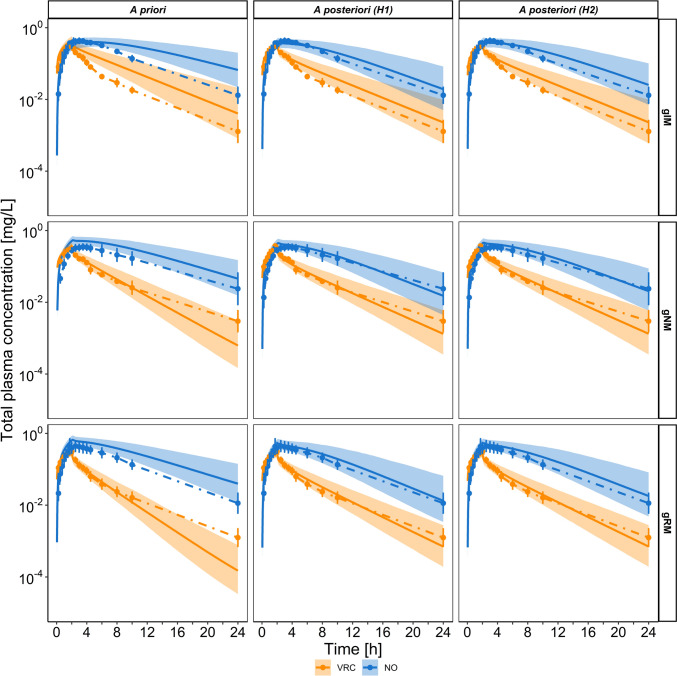
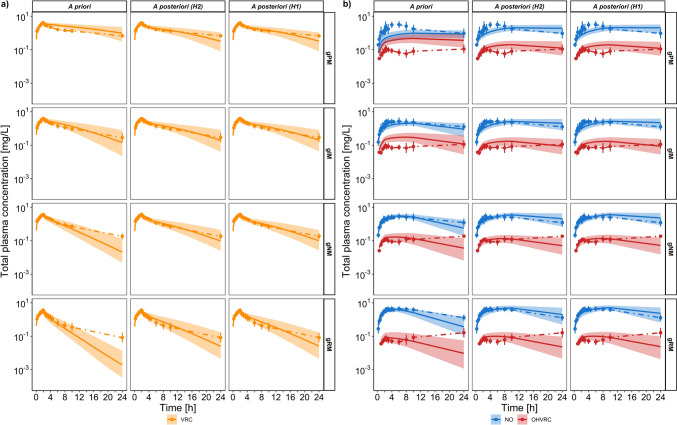
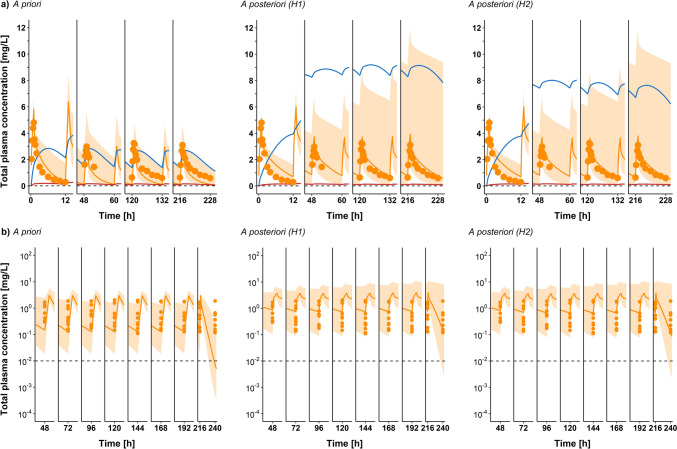
Results: Using a combined bottom-up and middle-out approach, incorporating data from multiple clinical studies and existing literature, the model accurately predicted plasma concentration-time profiles across various intravenous dosing regimens in healthy adults, of different CYP2C19 genotype-predicted phenotypes. All (100%) of the predicted area under the concentration-time curve (AUC) and 94% of maximum concentration (Cmax) values of VRC met the 1.25-fold acceptance criterion, with overall absolute average fold errors of 1.12 and 1.14, respectively. Furthermore, all predicted AUC and Cmax values of NO and OHVRC met the twofold acceptance criterion.

Conclusion: This comprehensive parent-metabolite PBPK model of VRC quantitatively elucidated the complex metabolism of the drug and emphasised the substantial impact of the primary metabolites on VRC PK. The comprehensive approach combining bottom-up and middle-out modelling, thereby accounting for VRC autoinhibition, metabolite-mediated inhibition, and the impact of CYP2C19 genetic polymorphisms, enhances our understanding of VRC PK. Moreover, the model can be pivotal in designing further in vitro experiments, ultimately allowing for extrapolation to paediatric populations, enhance treatment individualisation and improve clinical outcomes.


Conflict of interest statement

Declarations Funding Open Access funding was enabled and organised by Projekt DEAL. Conflicts of Interest Charlotte Kloft and Wilhelm Huisinga report grants from an industry consortium (AbbVie Deutschland GmbH & Co. K.G., AstraZeneca, Boehringer Ingelheim Pharma GmbH & Co. K.G., Grünenthal GmbH, F. Hoffmann-La Roche Ltd, Merck KGaA, Novo Nordisk A/S and Sanofi) for the graduate research training programme PharMetrX. In addition, Charlotte Kloft reports research grants from the Innovative Medicines Initiative-Joint Undertaking (‘DDMoRe’), from H2020-EU.3.1.3 (‘FAIR’), Diurnal Ltd and the Federal Ministry of Education and Research within the Joint Programming Initiative on Antimicrobial Resistance Initiative (‘JPIAMR’), all outside the submitted work. Ayatallah Saleh, Josefine Schulz, Jan-Frederik Schlender, Linda B.S. Aulin, Amrei-Pauline Konrad, Franziska Kluwe, Gerd Mikus, and Robin Michelet declare no competing interests that may be relevant to the contents of this work. Ethics Approval All procedures performed in studies involving human participants were in accordance with the ethical standards of the institutional and/or national research committee and with the 1964 Helsinki Declaration and its later amendments or comparable ethical standards. All trial protocols were approved by the responsible Ethics Committees and the respective competent authorities. Informed Consent Written informed consent was obtained from all individual study participants before inclusion. Written informed consent was obtained from all individual study participants before inclusion. Availability of Data and Material The datasets generated and/or analysed during the current study are not publicly available as patients did not provide consent for sharing their data in a public database. The datasets are available from the corresponding author upon reasonable request. Availability of Code The PBPK model will be available on the AK-Kloft GitHub website and can be freely downloaded. Author Contributions Conceptualisation: AS, RM, CK. Clinical data collection: GM, CK. In vitro data generation: JS, CK. Planning of analysis: AS, FK, RM, CK. Formal analysis and investigation: AS, RM, JFS, WH, GM, CK. Writing – original draft preparation: AS, RM. Writing – review and editing: All authors contributed to discussion of the results as well as reviewing and editing the manuscript.

Figures

Fig. 1
Fig. 1
Overview of the PBPK model development workflow for voriconazole and its metabolites, illustrating the input/data sources (inside boxes, left side) and the achieved steps (inside boxes, right side). ADME absorption, distribution, metabolism, excretion, CYP cytochrome P450, gXM genotype-predicted phenotype, H hypothesis, IM intermediate metaboliser, i.v. intravenous, MM Michaelis–Menten, NM normal metaboliser, NO voriconazole N-oxide, OHVRC hydroxyvoriconazole, PBPK physiologically-based pharmacokinetic, PM poor metaboliser, RM rapid metaboliser, VRC voriconazole
Fig. 2
Fig. 2
Whole-body intravenous physiologically-based pharmacokinetic model for voriconazole and its metabolites (left) and schematic representation of voriconazole elimination pathways (right). Voriconazole is metabolised by CYP2C19, CYP3A4 and CYP2C9 into voriconazole N-oxide, with subsequent elimination via a nonspecific hepatic route and excreted via renal clearance. The remainder of voriconazole absorbed is transformed via CYP3A4 into hydroxyvoriconazole, which is further metabolised and excreted via renal clearance. The parent compound and both metabolites concomitantly inhibit CYP2C19, CYP3A4 and CYP2C9. CYP cytochrome P450
Fig. 3
Fig. 3
Predicted total plasma concentration-time profiles of VRC (orange) and NO (blue) comparing a priori (left) versus a posteriori models of hypothesis 1 (middle) and hypothesis 2 (right) following administration of a single intravenous dose of 50 mg infused over 2 h. Geometric means of the observed data are shown as dots, with error bars indicating geometric standard deviation for CYP2C19 IM (top), CYP2C19 NM (middle), and CYP2C19 RM (bottom) individuals in the study by Hohmann et al. (N = 15) [13]. Solid lines represent the geometric mean of the respective population predictions (N = 1000) and the shaded area represents the 90% population prediction intervals. CYP cytochrome P450, gXM genotype-predicted phenotype, H hypothesis, IM intermediate metaboliser, N number of individuals, NM normal metaboliser, NO voriconazole N-oxide, RM rapid metaboliser, VRC voriconazole
Fig. 4
Fig. 4
Predicted total plasma concentration-time profiles of VRC (orange) and NO (blue) comparing a priori (left) versus a posteriori models of hypothesis 1 (middle) and hypothesis 2 (right) following administration of a single intravenous dose of 100 mg infused over 4 h. Geometric means of the observed data are shown as dots, with error bars indicating geometric standard deviation for CYP2C19 IM (top), CYP2C19 NM (middle), and CYP2C19 RM (bottom) individuals in the study by Hohmann et al. (N = 12) [30]. Solid lines represent the geometric mean of the respective population predictions (N = 1000) and the shaded area represents the 90% population prediction intervals. CYP cytochrome P450, gXM genotype-predicted phenotype, H hypothesis, IM intermediate metaboliser, N number of individuals, NM normal metaboliser, NO voriconazole N-oxide, RM rapid metaboliser, VRC voriconazole
Fig. 5
Fig. 5
Predicted total plasma concentration-time profiles following a single intravenous dose of 400 mg voriconazole infused over 2 h. a Concentration-time profiles for VRC (orange) comparing a priori versus a posteriori models of hypothesis 1 and hypothesis 2. b Concentration-time profiles for NO (blue) and OHVRC (red) comparing a priori versus a posteriori models of hypothesis 1 and hypothesis 2. Geometric means of the observed data are shown as dots, with error bars indicating the geometric standard deviation for CYP2C19 PM (first row), CYP2C19 IM (second row), CYP2C19 NM (third row), and CYP2C19 RM (bottom row) individuals in the studies by Scholz et al. [14], Hohmann et al. [13] and Hohmann et al. [30] (N = 47). Solid lines represent the geometric mean of the respective population predictions (N = 1000) and the shaded area represents the 90% population prediction intervals. CYP cytochrome P450, gXM genotype-predicted phenotype, H hypothesis, IM intermediate metaboliser, N number of individuals, NM normal metaboliser, NO voriconazole N-oxide, OHVRC hydroxyvoriconazole, PM poor metaboliser, RM rapid metaboliser, VRC voriconazole
Fig. 6
Fig. 6
Predicted total plasma concentration-time profiles of VRC (orange) comparing a priori (left) versus a posteriori models of hypothesis 1 (middle) and hypothesis 2 (right) after multiple intravenous administrations of 3 mg/kg qd on the first day, then a MD of 3 mg/kg bid starting day 3 until day 11 of Study A by Purkins et al. [37]. a Arithmetic mean (N = 9) of the observed concentration-time profiles for days 1, 5, 8 and 12. b Individual observed plasma Cmax values for VRC on days 1, 5, 8 and 12. Solid orange lines represent the geometric mean of population predictions (N = 1000); dots represent the observed data for arithmetic means in panel (a) and individual Cmax values in panel (b); shaded area represents the 90% population prediction intervals; solid blue and red lines represent the geometric mean of population predictions (N = 1000) for NO and OHVRC, respectively; and the dashed black line represents the lower limit of quantification for VRC. bid twice daily, Cmax maximum plasma concentration, IV intravenous, MD maintenance dose, N number of individuals, NO voriconazole N-oxide, OHVRC hydroxyvoriconazole, qd once daily, VRC voriconazole
Fig. 7
Fig. 7
Predicted total plasma concentration-time profiles of VRC (orange) comparing a priori (left) versus a posteriori models of hypothesis 1 (middle) and hypothesis 2 (right), after multiple IV administration of an LD of 6 mg/kg bid on the first day, then an MD of 3 mg/kg bid starting on day 2 until day 9 of the Study B by Purkins et al. [37]. a Arithmetic mean (N = 9) of the observed concentration-time profiles for days 1, 3, 6 and 10. b Individual observed plasma Cmin values for VRC for the 1st to 10th days of the MD. Solid orange lines represent the geometric mean of population predictions (N = 1000); the dots represent the observed data for arithmetic means in panel (a) and individual Cmin values in panel (b); shaded area represents the 90% population prediction intervals; solid blue and red lines represent the geometric mean of the population predictions (N = 1000) for NO and OHVRC, respectively; and the dashed black line represents the lower limit of quantification for VRC. bid twice daily, Cmin minimum plasma concentration, H hypothesis, IV intravenous, LD loading dose, MD maintenance dose, N number of individuals, NO voriconazole N-oxide, OHVRC hydroxyvoriconazole, VRC voriconazole
Fig. 8
Fig. 8
Goodness-of-fit plots for plasma concentration predictions. A comparison of a priori (left) versus final a posteriori prediction for hypothesis 1 (middle) and hypothesis 2 (right) across CYP2C19 gXM. (a) Individual observed versus predicted VRC total plasma concentrations from all studies (IVSD and IVMD, n = 1765). (b) Individual observed versus predicted NO total plasma concentrations from all IVSD studies (n = 1591). (c) Individual observed versus predicted OHVRC total plasma concentrations from all IVSD studies (n = 372). The solid line represents the identity line, with dotted and dashed lines indicating 1.25-fold and 2-fold deviations, respectively. CYP cytochrome P450, gXM genotype-predicted phenotype, H hypothesis, IM intermediate metaboliser, IVSD intravenous single dose, IVMD intravenous maintenance dose, n number of samples, NO voriconazole N-oxide, NM normal metaboliser, OHVRC hydroxyvoriconazole, PM poor metaboliser, RM rapid metaboliser, VRC voriconazole
Fig. 9
Fig. 9
Pharmacokinetic parameter goodness-of-fit plots comparing a priori (left) versus a posteriori of hypothesis 1 (middle) and hypothesis 2 (right) models. a Predicted AUClast and b Cmax of VRC, NO and OHVRC compared with observed values for all single IV dose studies. The solid line represents the line of identity; dotted lines indicate 1.25-fold, and dashed lines indicate 2-fold deviation. AUClast area under the concentration-time curve from the time of administration to the last measurable concentration, Cmax maximum plasma concentration, IM intermediate metaboliser, IV intravenous, NO voriconazole N-oxide, NM normal metaboliser, OHVRC hydroxyvoriconazole, PM poor metaboliser, RM rapid metaboliser, VRC voriconazole

Comment in

References

    1. von Lilienfeld-Toal M, Wagener J, Einsele H, et al. Invasive fungal infection. Dtsch Arztebl Int. 2019;116:271–8. 10.3238/arztebl.2019.0271. - PMC - PubMed
    1. Perlin DS, Rautemaa-Richardson R, Alastruey-Izquierdo A. The global problem of antifungal resistance: prevalence, mechanisms, and management. Lancet Infect Dis. 2017;17:e383–92. - PubMed
    1. Ghannoum MA, Rice LB. Antifungal agents: mode of action, mechanisms of resistance, and correlation of these mechanisms with bacterial resistance. Clin Microbiol Rev. 1999;12:501–17. 10.1128/CMR.12.4.501. - PMC - PubMed
    1. Pfizer. VFEND summary of product characteristics (SmPC). Pfizer; 2020.
    1. Pearson MM, Rogers PD, Cleary JD, Chapman SW. Voriconazole: a new triazole antifungal agent. Ann Pharmacother. 2003;37:420–32. 10.1345/aph.1C261. - PubMed

LinkOut - more resources