

doi: 10.1158/2159-8290.CD-24-0187.
Copper Drives Remodeling of Metabolic State and Progression of Clear Cell Renal Cell Carcinoma
Affiliations
- PMID: 39476412
- PMCID: PMC11803400
- DOI: 10.1158/2159-8290.CD-24-0187
Item in Clipboard
Copper Drives Remodeling of Metabolic State and Progression of Clear Cell Renal Cell Carcinoma
Cancer Discov.
.
Abstract
The work establishes a requirement for glucose-dependent coordination between energy production and redox homeostasis, which is fundamental for the survival of cancer cells that accumulate Cu and contributes to tumor growth.
©2024 The Authors; Published by the American Association for Cancer Research.
Conflict of interest statement
B. Vemuri, J.A. Landero Figueroa, J.Meller, J.T. Cunningham, M.F. Czyzyk-Krzeska report a patent for US Patent App.17/327,100, 2022 pending. No disclosures were reported by the other authors.
Figures
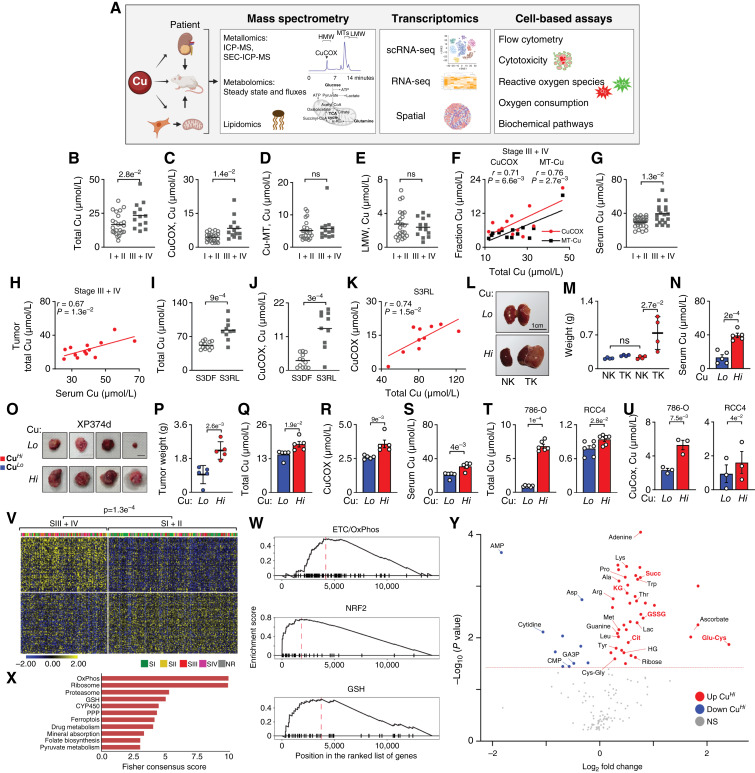
Accumulation of Cu and its allocation to CuCOX are associated with the progression of ccRCC and drive tumor growth. A, Schematic of the experimental workflow. B, Total Cu levels in stage I + II (n = 24) vs. stage III + IV (n = 13) ccRCCs measured using ICP-MS. Allocation of Cu to cytochrome c oxidase (CuCOX; C), MTs (D), and low molecular weight fraction (LMW; E) in stage I + II vs. III + IV tumors (as in A) measured using SEC-ICP-MS. F, Pearson correlation between Cu in CuCOX or MTs and total Cu content in tumors from stage III + IV patients. G, Total Cu levels in sera from patients with stage I + II vs. III + IV tumors. H, Pearson correlation between tumor and serum total Cu levels in stage III + IV patients. I, Total Cu levels in tumors from patients with stage III ccRCC who relapsed (S3RL, n = 10) compared with those who remained disease-free after 2 years (S3DF, n = 12). J, Cu allocated to CuCOX in tumors from patients with S3RL vs. S3DF measured using SEC-ICP-MS. K, Pearson correlation between CuCOX and total Cu in S3RL tumors. L, Gross images of kidneys with orthotopic xenografts tumors from mice fed matched low (4 μmol/L) and high (158 μmol/L) Cu diets (right) as compared with normal kidneys (left). NK, normal kidney; TK, tumor kidney. A dashed white line marks tumor tissue. M, Weight of kidneys with orthotopic xenografts at collection (7 weeks after injection). N, Total Cu levels in sera from mice with orthotopic xenografts. O, Gross images of XP374d tumors from mice fed matched low (4 μmol/L) and high (158 μmol/L) Cu diets. P, Weight of XP374d at collection. Q, Total Cu levels in XP374d measured using ICP-MS. R, Allocation of Cu to CuCOX in XP374d measured using SEC-ICP-MS. S, Total Cu levels in sera from mice bearing XP374d tumors. T, Accumulation of total Cu in the indicated cell lines chronically exposed to high Cu in the media. U, Allocation of Cu to CuCOX measured in the cell lines chronically exposed to high Cu in the media. For RCC4 cells, P values were calculated by paired t test. V, Heatmap shows stratification of ccRCCs from TCGA cohort into clusters enriched in stage I + II vs. III + IV tumors using 200 DEGs between CuHi and CuLo 786-O cells; k-means clustering with k = 2 was used to cluster both samples and genes. P value from the χ2 test. W, Pathways enriched in CuHi cells identified by GSEA. X, Consensus pathways enriched in 786-O CuHi cells and metabolically dynamic cancer cell subpopulation 6 identified in scRNA-seq (see also Fig. 6). Fisher consensus of adjusted P values obtained from individual enrichment analyses is used to rank the pathways. Y, Volcano plot of differentially abundant metabolites in CuHi and CuLo 786-O cells. Means ± SEM are shown. P values from two-tailed t test unless otherwise indicated. Scale bars, 1 cm. See Supplementary Fig. S1 and Supplementary Tables S1A, S1B, and S2. (A was partially created with BioRender.com .)
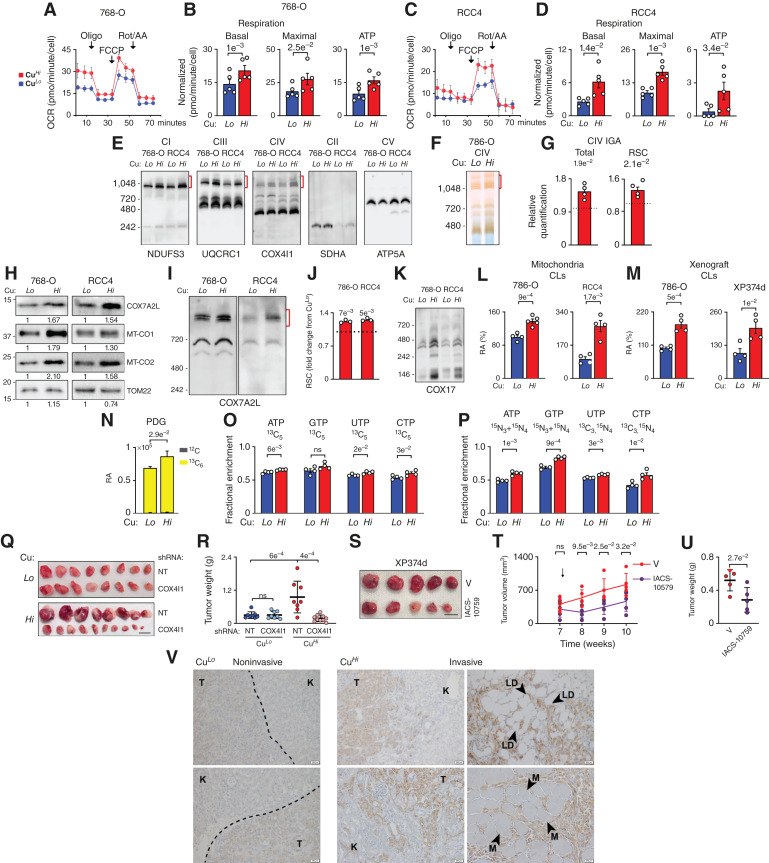
Cu-dependent activation of CuCOX promotes oxygen consumption, reorganization of respiratory supercomplexes, and nucleotide biosynthesis essential for Cu-dependent tumor growth. A–D, OCR from representative Seahorse mitochondrial stress tests in 786-O (A and B) and RCC4 (C and D) cells. Quantification of basal respiration, maximal respiration (post-FCCP injection), and respiration coupled to ATP production. P value from paired t test. E, Blue NativePAGE (BN-PAGE) analysis of respiratory complexes using digitonin permeabilized mitochondria isolated by anti-TOM22 immunopurification from CuHi vs. CuLo cells. Immunoblotting for indicated respiratory complex subunits. Red brackets indicate RSC. F, In-gel activity assay (IGA) for cytochrome c oxidase. RSCs are indicated with red brackets. G, Quantification of CuHi complex IV (COX) IGA relative to CuLo. P values are calculated by a one-sample t test. H, Western blot for COX subunits MT-CO1 and MT-CO2 and RSC assembly factor COX7A2L in mitochondrial lysates. I, BN-PAGE of mitochondria shows enrichment for COX7A2L in RSCs (red bracket) in CuHi cells. J, Quantification of COX7A2L in western blots of RSCs shown in M. P values calculated by one-sample t test. K, BN-PAGE of mitochondria shows enrichment for COX17, chaperone of Cu to CuCOX, in respiratory complexes from CuHi cells. L, Total CL content measured using mitochondrial lipidomics in 786-O and RCC4 cells. RA, relative abundance. M, Total CL content in xenografts formed by 786-O cells or in XP374d tumors in mice fed low and high Cu diet. N, Cu effects on labeling of 6-PDG, intermediate of oxidative branch of PPP, after 5 hours of incubation with [13C6]-glucose. O, Fractional enrichment of [13C5]- nucleotides labeled from [13C6]-glucose in a total pool of each nucleotide in CuLo and CuHi cells after 24 hours of incubation. P, Fractional enrichment of nucleotides labeled from [13C5,15N2]-glutamine in a total pool of each nucleotide in CuLo and CuHi cells after 24 hours of incubation. Q, Gross images of tumors formed by control 786-O cells expressing nontargeting (NT) or cells with COX4I1 knockdown in mice fed matched CuLo or CuHi diets. Scale bar, 1 cm. R, Weight of tumors shown in Q at collection. P values were calculated by one-way ANOVA with the Holm–Šidák posttest. S, Gross images of XP374d tumors in mice fed with a CuHi diet treated with IACS-10579 or vehicle (V). Scale bar, 1 cm. T, Volume of subcutaneous tumors at the indicated time points. U, The weight of tumors shown in S at collection. V, Representative images of staining for MT-CO2 in noninvasive and invasive orthotopic xenografts. K, kidney tissue; LD, lipid droplets; M, muscle; T, tumor tissue. The dashed line indicates the boundary between the tumor and kidney tissue. Scale bars, 200 μm. Means ± SEM are shown; P values were calculated from unpaired two-tailed t test unless indicated. See also Supplementary Fig. S2 and Supplementary Tables S3, S4A, and S4B.
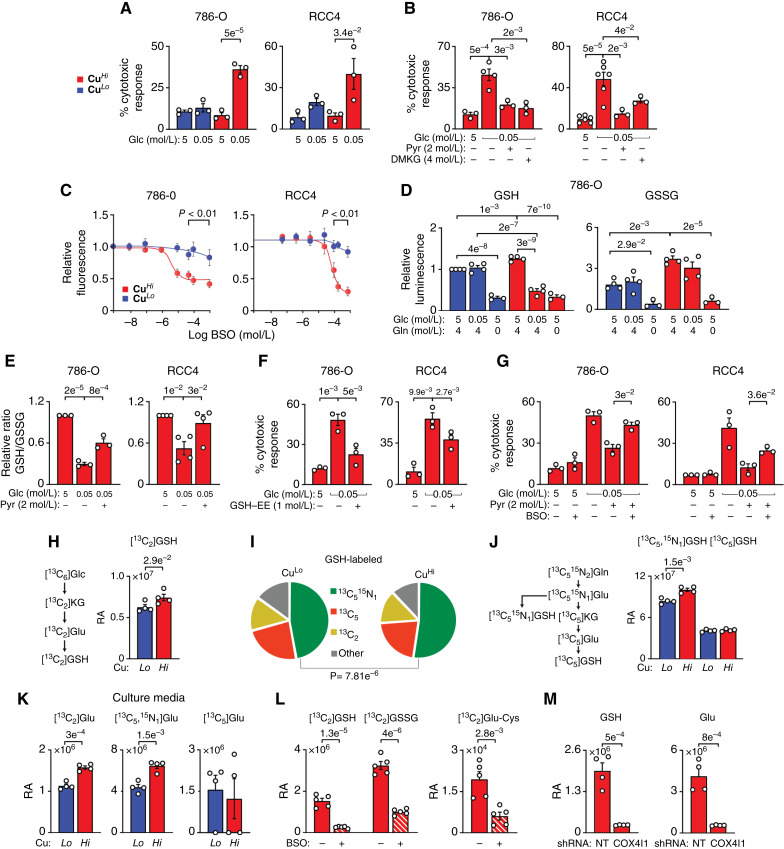
Glucose-derived GSH is necessary for the survival of CuHi cells. A, Cytotoxic effect of glucose (Glc) starvation on CuHi but not CuLo 786-O and RCC4 cells measured using propidium iodide and FITC annexin V staining and flow cytometry. B, Rescue of glucose starvation-induced CuHi cell death with exogenous pyruvate (Pyr) and DMKG in 786-O and RCC4 cells. C, CuHi but not CuLo cells are sensitive to inhibition of GSH biosynthesis by BSO (48 hours) measured using CyQUANT proliferation assay. Because EC50 for BSO dose in CuLo cells could not be determined, the P values were determined for each set of data points in each cell line using a two-tailed t test. D, Effects of glucose and glutamine starvation on GSH and GSSG levels in CuHi and CuLo cells measured using GSH-Glo Assay. E, Exogenous pyruvate reverses glucose starvation-induced decrease in GSH/GSSG ratio. F, Rescue of glucose starvation-induced CuHi cell death with exogenous GSH ethyl ester (GSH-EE). G, Inhibition of GSH biosynthesis with BSO (16 hours) reverses pyruvate-induced rescue of CuHi cells caused by glucose starvation. BSO concentrations: 10 μmol/L (786-O) and 25 μmol/L (RCC4). H, Schematic pathway of 13C labeling of GSH derived from [13C6]Glc and relative abundance (RA) of [13C2]GSH in 786-O cells after 24 hours incubation with labeled glucose. I, Fractions of [13C2]GSH, [13C5,15N1]GSH, and [13C5 ]GSH in CuLo and CuHi 786-O cells. J, Schematic pathway of 13C and 15N labeling of GSH derived from [13C5,15N2]Gln and RA of [13C5,15N1]GSH and [13C5 ]GSH pools in 786-O cells after 24 hours incubation with labeled glutamine. K, Increased RA of [13C2]Glu and [13C5,15N1]Glu but not [13C5 ]Glu in the cell culture media of CuHi 786-O cells after 24 hours of incubation with labeled metabolite. L, BSO inhibits 13C2 labeling of GSH metabolites from [13C2,3]Pyr. M, Effect of COX4I1 knockdown on the abundance of glucose-derived [13C2]GSH and [13C2]Glu. Means ± SEM shown; P values calculated from two-tailed t test (C and I–M), one-tail t test (H), or one-way ANOVA with the Holm–Šidák posttest (A, B, and D–G). See Supplementary Fig. S3 and Supplementary Tables S4C and S4D.
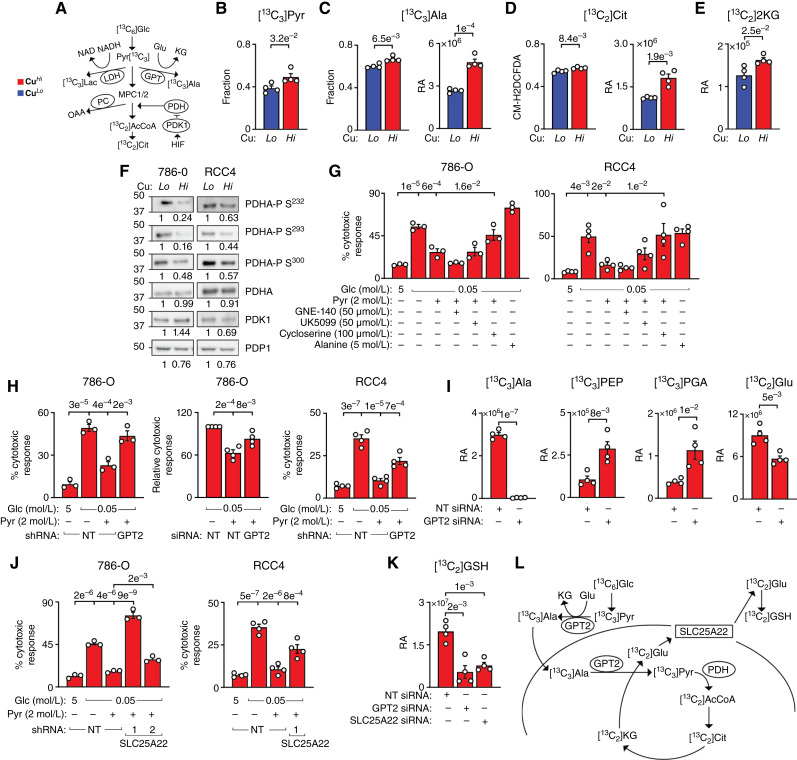
Synthesis of glucose-derived GSH requires the activity of GPT2 and mitochondrial glutamate carrier SLC25A22. A, Pathways of pyruvate utilization. B, Fraction of [13C3]Pyr in CuLo and CuHi 786-O cells treated with [13C6]Glc for 24 hours. C, Fraction and relative abundance (RA) of [13C3]-alanine (Ala) in CuLo and CuHi 786-O cells treated with [13C6]Glc for 24 hours. D, Fraction of total and RA of [13C2]-citrate (Cit) in CuLo and CuHi 786-O cells treated with [13C6]Glc for 24 hours. E, RA of [13C2]-ketoglutarate (KG) in CuLo and CuHi 786-O cells with [13C6]Glc for 24 hours. F, Western blot shows decreased PDHA phosphorylation at the indicated serine residues in CuHi 786-O and RCC4 cells. G, Effects of pharmacologic treatments on pyruvate rescue of cell death induced by glucose starvation in CuHi 786-O and RCC4 cells. GNE-140, LDH inhibitor; UK5099, MPC1/2 inhibitor; Cycloserine, GPT/GPT2 inhibitor. H, Effects of GPT2 knockdowns on the rescue of glucose starvation-induced cell death by exogenous pyruvate in 786-O and RCC4 cells. NT, nontargeting sh or siRNA. I, Effects of GPT2 knockdown on labeling of [13C3]Ala, [13C3]PEP, and [13C3]PGA and [13C2]Glu in 786-O cells treated with [13C6]Glc for 24 hours. J, Effects of SLC25A22 knockdown on pyruvate dependent rescue of glucose starvation-induced cell death in 786-O and RCC4 cells. Data shown in the first three bars for RCC4 cells are the same as in H. K, Effects of GPT2/SLC25A22 knockdowns on carbon flux from [13C6]Glc to [13C2]GSH. L, Model of the proposed pathway. Means ± SEM are shown. P values from two-tailed t test in B–E, I, and K or one-way ANOVA with the Holm–Šidák posttest in G, H, and J. See also Supplementary Fig. S4 and Supplementary Tables S4E and S4F.
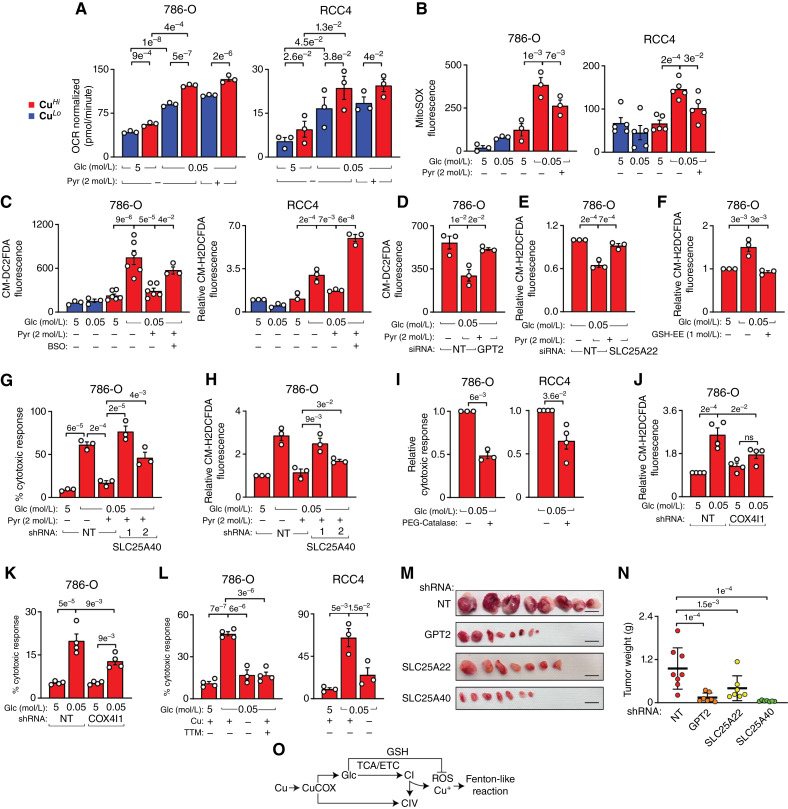
Glucose-derived mitochondrial GSH prevents Fenton reaction-like mediated cell death of CuHi cells. A, Seahorse measurement of basal OCR in response to glucose starvation in CuLo and CuHi in the absence and presence of exogenous pyruvate in 786-O and RCC4 cells. Data are normalized to Hoechst staining. B, MitoSOX measurement of mitochondrial superoxide accumulation in response to glucose starvation (16 hours) and treatment with exogenous pyruvate in CuLo and CuHi 786-O (P value from paired t test) and RCC4 (P values from unpaired t test) cells. C, CM-H2DCFDA measurement of cellular hydrogen peroxide in response to glucose starvation and treatments with exogenous pyruvate and BSO in CuLo and CuHi 786-O and RCC4 cells. BSO concentrations: 10 μmol/L for 786-O and 25 μmol/L for RCC4 cells. D, Effect of GPT2 knockdown on the accumulation of H2O2 in response to pyruvate rescue of glucose starvation in CuHi cells. E, Effect of SLC25A22 knockdown on the accumulation of H2O2 in response to pyruvate rescue of glucose starvation in CuHi cells. F, Effect of exogenous GSH-EE on the accumulation of H2O2 in response to glucose starvation in CuHi cells. G, Effect of SLC25A40 knockdown on the pyruvate rescue of glucose starvation-induced cell death in CuHi cells. H, Effect of SLC25A40 knockdown on the accumulation of H2O2 in response to pyruvate rescue of glucose starvation in CuHi cells. I, Cell death caused by glucose starvation is prevented by treatment with PEG-catalase. 786-O cells: 250 U/mL, RCC4 cells 500 U/mL. P values from two-tailed t test. J, Knockdown of COX4I1 diminishes H2O2 generation in response to glucose starvation. K, Knockdown of COX4I1 partially rescues cytotoxicity induced by glucose starvation. L, Glucose starvation–induced death of CuHi cells was prevented by removing Cu or treatment with Cu chelator [tetrathiomolybdate (TTM), 30 μmol/L] in 786-O and RCC4 cells. M, Gross images of tumors formed by 786-O cells expressing nontargeting (NT) or indicated shRNAs in mice fed with a CuHi diet. Control NT tumors are the same as in Fig. 2Q and R. Scale bar, 1 cm. N, Weight of tumors at collection. O, Model of the proposed role of CuCOX in coupling ROS and GSH production. Means ± SEM shown; unless otherwise indicated, P values were calculated from one-way ANOVA with the Holm–Šidák posttest. See also Supplementary Fig. S5.
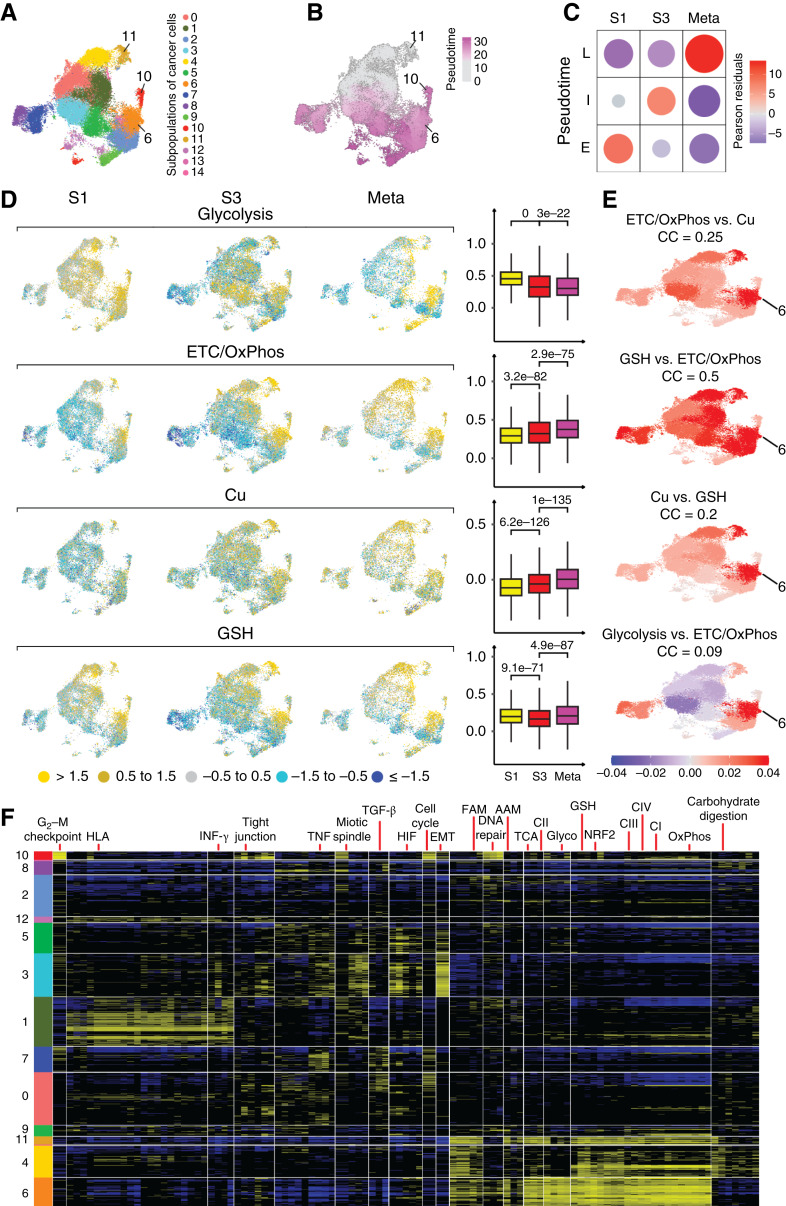
Induction of ETC/OxPhos, Cu, and GSH-related genes during the progression of ccRCC. A, UMAP visualization of 15 subpopulations of cancer cells. B, Pseudotime score indicates evolution of cancer cells from subpopulations 11, with gray color representing early and purple late subpopulations. C, Association of pseudotime with tumor stage. The size of the circles represents the strength of associations, and the red and blue, positive and negative correlations, respectively, are determined by χ2 residual. D, UMAPs (left) show an overall decrease in the expression of genes encoding glycolytic genes whereas induction of ETC/OxPhos-, Cu-, and GSH-related genes in more advanced ccRCCs. Box–whisker plots (right) show the distributions of module scores for each pathway signature across all putative cancer cells. Each column shows the expression of the indicated gene set using the Seurat module score defined relative to a control gene set. E, Pearson correlation residuals of the indicated sets of genes in each subpopulation of cancer cells shown for all tumors (n = 18) combined. F, Patterns of pathways expression in cancer cell subpopulations. Rows represent cells, with clusters identified using Seurat analysis of scRNA-seq data indicated by vertical color bars and sorted according to their overall similarity using cluster centroids. Columns represent supergenes and pathways selected from the union of KEGG pathways, MSigDB Hallmark gene sets, and curated metabolic gene sets. Supergenes/pathways are clustered based on similarity using the 1-Pearson correlation coefficient as the dissimilarity measure. Expression values for a supergene/pathway in a cell are defined as the average normalized expression over all genes in the set and shown using 3-state projection: top quartile (high expression) in the yellow, bottom quartile (low expression) in blue, middle 50% (average expression) in black. AAM, amino acid metabolism; CI/CII/CIII/CIV, respiratory complexes I/II/III/IV; EMT, epithelial–mesenchymal transition; FAM, fatty acid metabolism; Glyco, glycolysis. See also Supplementary Fig. S6 and Supplementary Tables S5A and S5B.
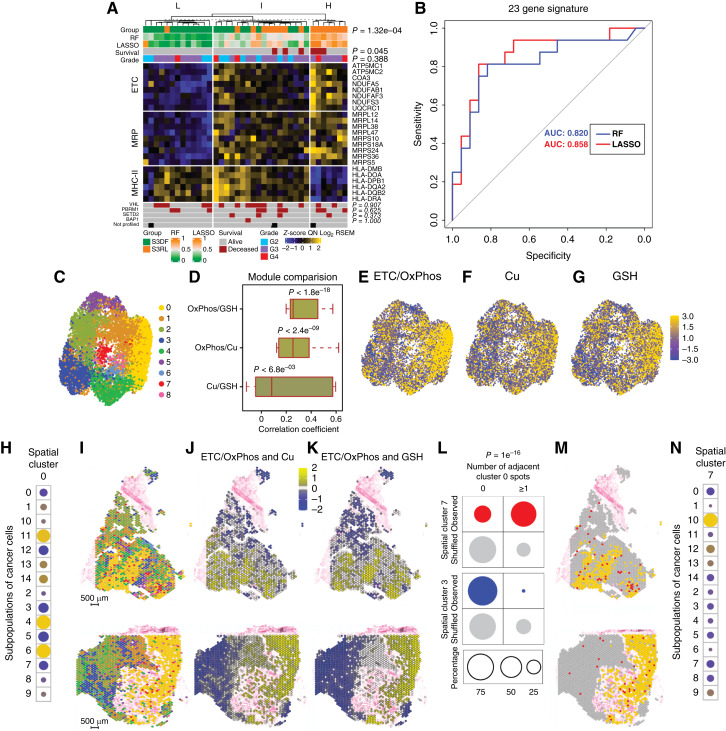
Prognostic application of metabolic signature and adjacent localization of cancer cells with metabolic and proliferative states support the role of metabolic state in tumor progression. A, Unsupervised k-means clustering (k = 3) of tumors from patients with S3DF and S3RL using 23 significantly DEGs belonging to ETC, mitochondrial ribosomal protein (MRP), and MHC class II (MHC-II) gene sets. Samples were stratified into three distinct groups characterized by low (L, n = 13), intermediate (I, n = 18), and high (H, n = 7) risk of disease recurrence, which is further supported by supervised binary classification models, random forest (RF) and penalized regression (LASSO). Fisher exact test P values are shown. B, ROC curves for classifying the samples into S3DF vs. S3RL classes using random forest (RF) or LASSO classification models. A random classifier is drawn as a diagonal gray line, and classification accuracy is represented by the AUC. C, UMAP visualization of nine clusters of spatial spots (spatial clusters) characterized by similar transcriptomic signatures. D, Pearson correlation of expression of the indicated sets of genes across all nine spatial spots. Annotation of spatial clusters by ETC/OxPhos gene set expression (E), by Cu-related gene set expression (F), and by GSH-related gene set expression (G). H, Increased expression of gene signatures of metabolically active scRNA-seq subpopulations 4, 6, and 11 in spatial cluster 0. The color indicates the direction of change in the expression of the scRNA-seq gene signature for each subpopulation compared with the mean expression of this signature across all spots. Yellow indicates higher- and blue lower-than-average expression. The size of the circles represents statistical significance defined as the −log10 of P values obtained using the one-sample t test for the null hypothesis of mean = 0 for scRNA-seq. The P value for subpopulations 4, 6, and 11 is <1e−16. I, Mapping spatial clusters into the H&E-stained sections of two stage III ccRCCs. Scale bar, 500 μm. The color legend as in C. J, Mapping the concordant of ETC/OxPhos and Cu-related gene expression into the tumor sections. K, Mapping concordant ETC/OxPhos and GSH-related gene expression into the tumor sections. L, Percentage of spots in spatial clusters 7 (shown in red) and 3 (shown in blue) that are adjacent to spots of spatial cluster 0 for observed vs. randomly shuffled (shown in gray) data. The χ2 test shows a statistically significant increase in the adjacency between spots of spatial clusters 0 and 7 and decreased adjacency between spots from spatial clusters 0 and 3 in the observed data compared with the shuffled data. M, Mapping spots from spatial cluster 0 (yellow) and 7 (red) on representative sections of ccRCCs. N, Significant overlap in gene expression between spatial cluster 7 and scRNA-seq subpopulation 10 characterized by proliferative phenotype. The color indicates the direction of change in the expression of the gene signature of subpopulation 10 in spatial cluster 7 compared with the mean expression of this signature across all spots. Yellow indicates higher- and blue lower-than-average expression. The size of the circles represents statistical significance defined as the −log10 of P values obtained using the one-sample t test for the null hypothesis of mean = 0 for scRNA-seq. The P value for subpopulation 10 is <1e−16. The yellow-blue scale shown in G applies to E–H and N. See also Supplementary Fig. S7 and Supplementary Tables S6 and S7.
Update of
-
Copper drives remodeling of metabolic state and progression of clear cell renal cell carcinoma.bioRxiv [Preprint]. 2024 Jan 19:2024.01.16.575895. doi: 10.1101/2024.01.16.575895. bioRxiv. 2024. Update in: Cancer Discov. 2025 Feb 07;15(2):401-426. doi: 10.1158/2159-8290.CD-24-0187. PMID: 38293110 Free PMC article. Updated. Preprint.
References
-
- Wood E, Donin N, Shuch B. Adjuvant therapy for localized high-risk renal cell carcinoma. Urol Clin North Am 2020;47:345–58. - PubMed
-
- Choueiri TK, Tomczak P, Park SH, Venugopal B, Ferguson T, Chang Y-H, et al. Adjuvant pembrolizumab after nephrectomy in renal-cell carcinoma. N Engl J Med 2021;385:683–94. - PubMed
MeSH terms
Substances
Grants and funding
- R01 CA259845/CA/NCI NIH HHS/United States
- R01CA259845/National Cancer Institute (NCI)
- R01 GM128216/GM/NIGMS NIH HHS/United States
- R01CA287260/National Cancer Institute (NCI)
- T32ES007250/NIH ESI
- R35 GM146878/GM/NIGMS NIH HHS/United States
- T32 CA236764/CA/NCI NIH HHS/United States
- K08CA273542/National Cancer Institute (NCI)
- R01 CA287260/CA/NCI NIH HHS/United States
- P50 CA196516/CA/NCI NIH HHS/United States
- P50CA196516/National Cancer Institute (NCI)
- T32CA17846/National Cancer Institute (NCI)
- R37 CA272854/CA/NCI NIH HHS/United States
- R35GM146878/National Institute of General Medical Sciences (NIGMS)
- R01 CA230904/CA/NCI NIH HHS/United States
- I01 BX001110/BX/BLRD VA/United States
- P30CA046934/National Cancer Institute (NCI)
- K08 CA273542/CA/NCI NIH HHS/United States
- T32 ES007250/ES/NIEHS NIH HHS/United States
- R01 CA239657/CA/NCI NIH HHS/United States
- R37CA272854/National Cancer Institute (NCI)
- R35 GM133561/GM/NIGMS NIH HHS/United States
- P30 CA046934/CA/NCI NIH HHS/United States
- 2I01BX001110/Veteran Administration
- R01CA239657/National Cancer Institute (NCI)
- R35GM133561/National Institute of General Medical Sciences (NIGMS)
- R01GM128216/National Institute of General Medical Sciences (NIGMS)
- R01CA230904/National Cancer Institute (NCI)
- T32CA236764/National Cancer Institute (NCI)
