. 2025 Jan;637(8044):224-229.
doi: 10.1038/s41586-024-08283-2. Epub 2024 Oct 30.

Pharmacological restoration of GTP hydrolysis by mutant RAS

Affiliations

Pharmacological restoration of GTP hydrolysis by mutant RAS

Antonio Cuevas-Navarro et al. Nature. 2025 Jan.

Abstract

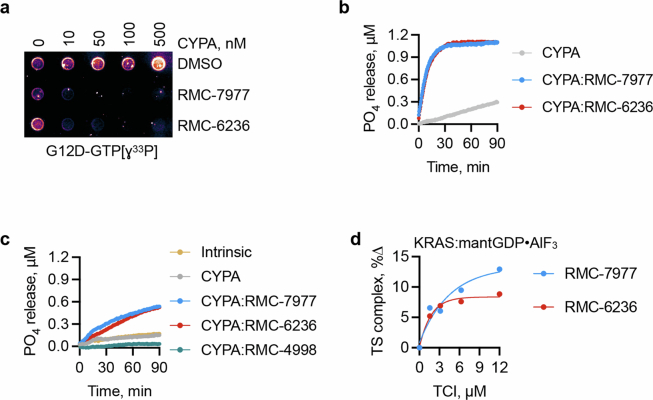
Approximately 3.4 million patients worldwide are diagnosed each year with cancers that have pathogenic mutations in one of three RAS proto-oncogenes (KRAS, NRAS and HRAS)1,2. These mutations impair the GTPase activity of RAS, leading to activation of downstream signalling and proliferation3-6. Long-standing efforts to restore the hydrolase activity of RAS mutants have been unsuccessful, extinguishing any consideration towards a viable therapeutic strategy7. Here we show that tri-complex inhibitors-that is, molecular glues with the ability to recruit cyclophilin A (CYPA) to the active state of RAS-have a dual mechanism of action: not only do they prevent activated RAS from binding to its effectors, but they also stimulate GTP hydrolysis. Drug-bound CYPA complexes modulate residues in the switch II motif of RAS to coordinate the nucleophilic attack on the γ-phosphate of GTP in a mutation-specific manner. RAS mutants that were most sensitive to stimulation of GTPase activity were more susceptible to treatment than mutants in which the hydrolysis could not be enhanced, suggesting that pharmacological stimulation of hydrolysis potentiates the therapeutic effects of tri-complex inhibitors for specific RAS mutants. This study lays the foundation for developing a class of therapeutics that inhibit cancer growth by stimulating mutant GTPase activity.


Conflict of interest statement

Competing interests: P.L. is listed as an inventor on patents filed by MSKCC regarding treatment of KRAS- or BRAF-mutant cancers; reports grants to his institution from Revolution Medicines, Amgen, Mirati and Boehringer Ingelheim; and reports consulting fees or honoraria from Black Diamond Therapeutics, AmMax, OrbiMed, PAQ-Tx, Repare Therapeutics, Boehringer Ingelheim, Menarini Group and Revolution Medicines, as well as membership on the scientific advisory board of Frontier Medicines, Ikena, Biotheryx and PAQ-Tx (consulting fees and equity in each). The other authors declare no competing interests.

Figures

Fig. 1
Fig. 1. Reversible TCI with differential binding capacity for RAS mutants.
a, Live cells expressing a split luciferase reporter detecting the complex between CYPA and the indicated KRAS (left), NRAS (middle) or HRAS (right) variants were treated with a TCI (RMC-7977) for 2 h. b, As described in a, but live cells were assayed over time, either before or after treatment with RMC-7977 (100 nM, added at t0). c, The effect of the indicated KRAS mutations on drug-induced complex formation between KRAS and CYPA in live cells. Y32S was used a negative control, as this residue has been shown to be important for tri-complex formation,. For ac, n = 3. Data are mean ± s.e.m. Unless otherwise indicated, n denotes biological replicates. FC, fold change. Source Data
Fig. 2
Fig. 2. Pharmacological restoration of GTP hydrolysis by mutant RAS.
a, GTP hydrolysis by recombinant WT or mutant KRAS was assayed using an orthophosphate sensor protein, either under intrinsic conditions or in the presence of the indicated agents. The GAP domain of NF1 (GRD), which enhances GTP hydrolysis by WT (but not mutant) KRAS, was used as a control. b, The effect of drug-bound CYPA on enhancing GTP hydrolysis by the indicated KRAS mutants. See also Extended Data Fig. 3. c, The effect of CYPA or CYPA–RMC-7977 complex on the ability of KRAS(G12D) to hydrolyse [γ33P]GTP. d, Purified KRAS(G12D) loaded with mant-GDP (mGDP) and AlF3 was reacted with increasing concentrations of drug-bound CYPA. The transition state (TS) complex was detected by the change in fluorescence and reported as the change in the area under the curve. e, As in d, but with the indicated KRAS variants. A representative experiment of n = 2 independent experiments for each KRAS variant is shown in ae. Source Data
Fig. 3
Fig. 3. The structural basis for enhanced GTP hydrolysis by mutant KRAS.
ac, The key features of the KRAS mutants G12C (a), G12S (b) and G12A (c) loaded with GDP·AlF3 in a complex with CYPA–RMC-7977. d,e, Conformations observed in GDP·AlF3-loaded KRAS(G12D) tri-complex pairs. The missing AlF3 in the typical position due to a steric clash with the mutant Asp12 side chain (d) and a plausible alternative placement (e) are shown. f, Inward rotation of the mutant aspartate in the GDP·AlF3-loaded KRAS(G12D) tri-complex protomer pairs, as compared to the GMPPNP-loaded conformation. Source Data
Fig. 4
Fig. 4. KRAS amino acids with a catalytic effect on tri-complex-induced hydrolysis.
a, The effect of the CYPA–RMC-7977 complex on GTP hydrolysis by the indicated KRAS variants. A representative experiment of n = 2 independent experiments is shown. b,c, Detection of RMC-7977-induced complex formation between CYPA and the KRAS(G12D) (b) or KRAS(G12V) (c) mutant in live cells. n = 3 biological replicates. Data are mean ± s.e.m. d, The structures of the isosteric amino acid substitutions used in e and f. e, The effect of CYPA–RMC-7977 complex on GTP hydrolysis by the indicated KRAS mutants. A representative experiment of n = 2 independent experiments is shown. f, Detection of RMC-7977-induced complex formation between CYPA and the indicated KRAS mutants in live cells. n = 3 biological replicates. Data are mean ± s.e.m. Source Data
Fig. 5
Fig. 5. Implications of stimulating GTP hydrolysis on oncogenic KRAS inhibition.
a, Live cells expressing a split luciferase reporter detecting the complex between the CRAF RBD and WT (n = 1), G12X (n = 6) or non-G12X (n = 9) KRAS variants (n denotes distinct variants) were treated with increasing concentrations of RMC-7977. The half-maximal inhibitory concentration (IC50) is shown. Statistical analysis was performed using a two-tailed t-test; *P = 0.0107. b, Cell lines containing the indicated KRAS variants were treated with increasing concentrations of RMC-7977 for 2 h to determine the effect on pERK using immunoblotting and densitometry. n = 7, 10 and 7 cell lines for the WT, G12X and non-G12X groups, respectively. Statistical analysis was performed using one-way ANOVA followed by Dunnett’s test; **P = 0.0018, ****P = 0.0001. c, Models containing G12D, G12V, G13D or Q61X mutant KRAS (n = 4 cell lines per allele) were treated as shown and the cell extracts were assayed to determine the effect on pERK inhibition over time. Data are mean ± s.e.m. Statistical analysis was performed using two-tailed t-tests; *P = 0.015,**P = 0.008. d, The interactions between the CRAF RBD and the indicated KRAS mutants in cells that were treated with RMC-7977 for 2 h as described in a. e, Cells were treated with increasing concentrations of RMC-7977 for 72 h to determine the effect on viability using ATP glow. n = 4, 12 and 9 for WT, G12X and non-G12X, respectively. The half-maximal growth inhibitory concentration (gIC50) is shown. Statistical analysis was performed using one-way ANOVA followed by Dunnett’s test; *P = 0.0018. f, Mice bearing PDX models containing either a G12X (n = 15) or a non-G12X (n = 7) KRAS mutation were treated with vehicle or RMC-7977 to determine the effect on tumour growth (left). n = 4 or 5 animals per treatment arm. Data are mean ± s.e.m. Right, tumour growth inhibition (TGI) by KRAS mutant groups. Data are mean ± s.e.m. Statistical analysis was performed using a two-tailed t-test; ***P = 0.0009. For a, b and e, the box plots show the median (centre line), interquartile range (box limits) and Tukey whiskers. Source Data
Extended Data Fig. 1
Extended Data Fig. 1. Selective binding and inhibition of the KRAS active state.
a, Pulldown of GDP, or GMPPNP-loaded GST-KRAS G12D incubated with CYPA preloaded with RMC-7977. b, Effect of CYPA:RMC-7977 on the complex between the indicated GMPPNP-loaded KRAS variant and the RAS-binding domain (RBD) of CRAF. c, KRAS G12D was subjected to an exchange reaction (GDP to GTP-DY-647P1) in the presence of SOS1 and increasing concentrations of TCI (with or without 10 µM CYPA) or the inactive-state selective G12D inhibitor MRTX1133. A representative of two independent repeats is shown for a-c. Source Data
Extended Data Fig. 2
Extended Data Fig. 2. Propensity for drug induced CYPA complex formation across RAS mutants.
a,b, Live cells expressing a split luciferase reporter detecting the complex between CYPA and the indicated KRAS variants were treated with RMC-6236 or RMC-7977 for 2h (n = 3 per variant, a: mean ± s.e.m., b: interquartile range and Tukey whiskers). c, Immunoblot analysis of extracts from HEK293T cells expressing the indicated split luciferase-tagged constructs, either after RMC-7977 treatment (c) or at baseline (d). e, KRAS G12D:CYPA binding reaches plateau at ~30 min. f-g, Detection of CYPA in complex with the indicated KRAS (f), HRAS (g), NRAS (h) mutants expressed in cells treated with TCI (100 nM, added at time 0). i,j, Cells were treated with 100 nM RMC-7977 and either gefitinib (EGFRi, 5 µM, i), RMC-4550 (SHP2i, 10 µM, i), BI-3406 (SOS1i, 10 µM, i), trametinib (MEKi, 100 nM, j) or DMSO at time 0. The effects on KRAS G12D:CYPA steady state levels are shown. SmBiT: small bit luciferase, LgBiT: large bit luciferase. e-j: n = 3 biological replicates, mean ± s.e.m. Source Data
Extended Data Fig. 3
Extended Data Fig. 3. Pharmacologic enhancement of the GTPase activity of select RAS variants.
a, The effect of increasing concentrations of the binary CYPA:RMC-7977 complex on GTP hydrolysis by KRAS G12D was determined as in Fig. 2a. The data were then fit to a one-phase association curve. A representative reaction over time (left) and the kinetic parameters (right) of three independent experiments are shown (mean ± s.e.m.). b-d, The effect of CYPA, RMC-7977 alone or as a binary complex, on the GTPase activity of the indicated KRAS (b), NRAS (c) or HRAS (d) variants. A representative of two independent experiments for each RAS variant is shown in b-d. Source Data
Extended Data Fig. 4
Extended Data Fig. 4. Effect of various tri-complex inhibitors on GTP hydrolysis by KRAS.
a,b, KRAS G12D was reacted with the indicated CYPA complexes to determine the effect on hydrolysis either relying on either [ɣ33P]GTP (a) or a phosphate sensor and non-radiolabeled GTP (b). c, As in b but KRAS G12C was used instead of KRAS G12D. d, Purified KRAS G12D loaded with mantGDP (mGDP) and AlF3 was reacted with increasing concentrations TCI-bound CYPA. The formation of a transition state complex was detected by fluorescence as in Fig. 2c. A representative of two independent repeats is shown for a-d. Source Data
Extended Data Fig. 5
Extended Data Fig. 5. Isolation and crystallization of ground and transition state complexes.
a-c, Purified KRAS G12D loaded with the indicated nucleotides was reacted with CYPA bound to RMC-7977 and the mixture was separated by size exclusion chromatography. The optical density of the elution fractions is shown in a. Eluted fractions from the KRAS ground state (b, GMPPNP-bound) or transition state (c, GDP·AlF3-bound) reactions were subjected to SDS-PAGE followed by Coomassie Brilliant Blue (CBB) staining. A representative of two independent repeats are shown in b and c. The fractions containing the complex are indicated by the dotted line. d,e, Representative crystals of the ground state (d) or transition state (e) complexes that were established using the hanging drop method. Source Data
Extended Data Fig. 6
Extended Data Fig. 6. Features of the GMPPNP- or GDP·AlF3-loaded KRAS variants in complex with CYPA.
a,b, Superimposed tertiary structures of KRAS mutants loaded with either GMPPNP (ground state mimetic, a) or GDP·AlF3 (transition state mimetic, b) bound to the tri-complex inhibitor RMC-7977 and CYPA. c, Interactions of CYPA:RMC-7977 with the indicated switch II residues in GDP·AlF3-loaded KRAS G12C. Inset: the rotation of the Q61 side chain leading to the carbonyl oxygen being orientated towards the nucleophilic water in the GDP·AlF3-bound state. d, Wild type HRAS in a transition state complex with the GAP domain of RASA1 (from 1WQ1). Note the GAP arginine (R) finger-mediated charge stabilization of the α and β phosphates (guanidino group) and the coordination of Q61 (backbone carbonyl). e, 2Fo-Fc map of GMPPNP-bound KRAS G12D with two plausible occupancies for the ɣ-phosphate (P). Source Data
Extended Data Fig. 7
Extended Data Fig. 7. KRAS amino acids that contribute to tri-complex induced hydrolysis.
a, The effect of increasing concentrations of CYPA on GTP hydrolysis by the indicated KRAS variants (RMC-7977: 10 µM throughout). A representative of n = 2 independent experiments for each variant is shown. b, Data from (a) were fitted to a one-phase association curve to obtain the rate constant (k) as a function of CYPA concentration. c, The complex of CYPA and the indicated KRAS mutants was induced by 100 nM RMC-7977 detected in live cells (n = 3 biological replicates, mean±s.e.m.). d, As in c but 0.1 μM RMC-7977 was used for G12D/E63A and 1 μM for G12D to account for the higher KRAS:CYPA binding level of the double mutant (n = 3 biological replicates, mean ± s.e.m.). Note the slower dissociation of G12D/E63A from CYPA in live cells, which is consistent with the slower tri-complex induced hydrolysis in the double mutant, as shown in a and b. Source Data
Extended Data Fig. 8
Extended Data Fig. 8. Inducing hydrolysis enhances target inhibition despite impairing CYPA complex formation.
a,b, HEK293T cells expressing SmBiT-tagged CRAF-RBD along with the indicated LgBiT-KRAS variants were treated with 100 nM RMC-7977 at time 0. Live cells were analysed for drug-induced complex formation by measuring the activity of reconstituted luciferase. (n = 3 replicates per variant, a: mean for each variant, b: mean ± s.e.m., **p = 0.0022, two-way ANOVA). c, Immunoblot detection of phosphorylated ERK in extracts from cells treated with RMC-7977 for 2 h. d, Interaction of the CRAF-RBD with the indicated single or double KRAS mutants expressed in cells that were treated with RMC-7977 for 2h. Source Data
Extended Data Fig. 9
Extended Data Fig. 9. Differences in durability of inhibition across KRAS mutant models.
a,b, Extracts from cells that were treated with RMC-7977 over time (200 nM) were analysed by immunoblotting to determine the effect on ERK activation. Densitometric quantification is shown in b (n = 4 cell lines per allele). c,d, As in a and b, but the indicated cell lines (n = 2 cell lines per allele) were treated with an inactive state selective pan KRAS inhibitor (BI-2865, 1 µM). In b and d, datapoints denote mean ± s.e.m. A representative of two independent repeats are shown in a and c. e, KRAS mutant cell lines were treated with RMC-7977 with or without 1 µM SHP2i (RMC-4550) or SOS1i (BI-3406) for 72h to determine the effect on viability using ATP glow and compare the the changes in IC50s (n = 6 cell lines per group, mean of 3 biological replicates per cell line is shown, **p = 0.0031 (left) and **p = 0.0096 (right), two-tailed paired t test and Holm-Šídák test to correct for multiple comparisons). Albeit modest, the effect of both SHP2i and SOS1i combinations was restricted to G12X models, a finding that supports the mutant selective stimulation of GTP hydrolysis by RMC-7977. Source Data

References

    1. Prior, I. A., Hood, F. E. & Hartley, J. L. The frequency of Ras mutations in cancer. Cancer Res.80, 2969–2974 (2020). - PMC - PubMed
    1. Punekar, S. R., Velcheti, V., Neel, B. G. & Wong, K.-K. The current state of the art and future trends in RAS-targeted cancer therapies. Nat. Rev. Clin. Oncol.19, 637–655 (2022). - PMC - PubMed
    1. Malumbres, M. & Barbacid, M. RAS oncogenes: the first 30 years. Nat. Rev. Cancer3, 459–465 (2003). - PubMed
    1. Hobbs, G. A., Der, C. J. & Rossman, K. L. RAS isoforms and mutations in cancer at a glance. J. Cell Sci.129, 1287–1292 (2016). - PMC - PubMed
    1. Simanshu, D. K., Nissley, D. V. & McCormick, F. RAS proteins and their regulators in human disease. Cell170, 17–33 (2017). - PMC - PubMed

LinkOut - more resources