. 2025 Jan;637(8045):446-452.
doi: 10.1038/s41586-024-08273-4. Epub 2024 Oct 30.

Autoinhibition of dimeric NINJ1 prevents plasma membrane rupture

Affiliations

Autoinhibition of dimeric NINJ1 prevents plasma membrane rupture

Sergei Pourmal et al. Nature. 2025 Jan.

Abstract

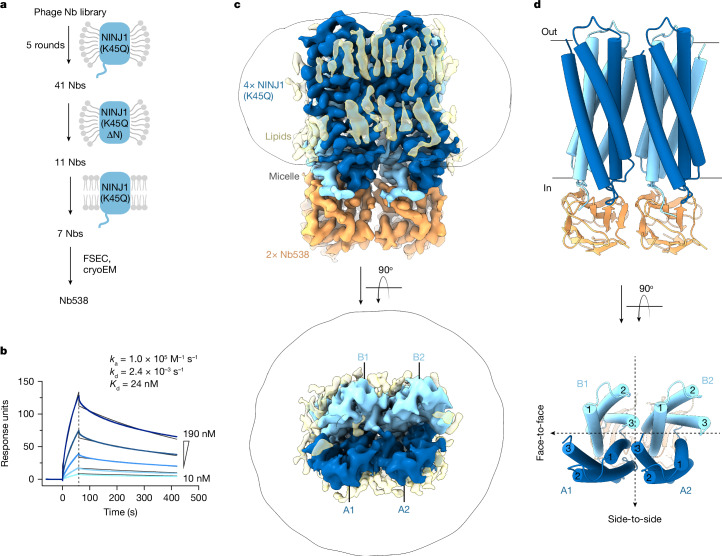
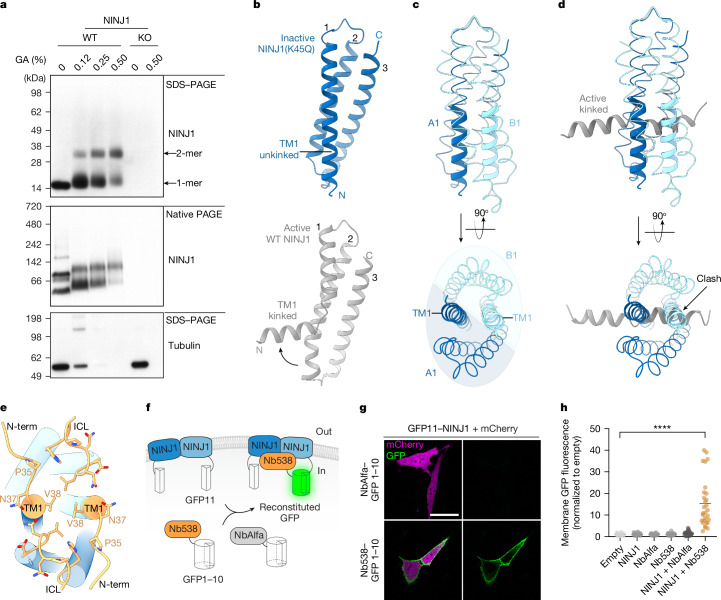
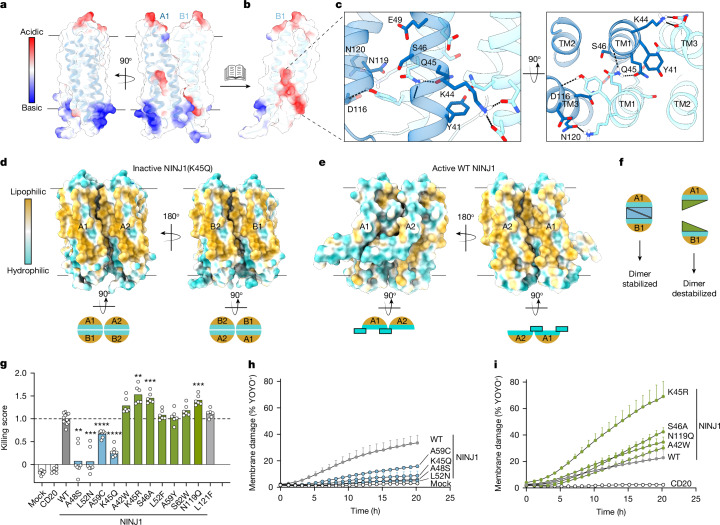
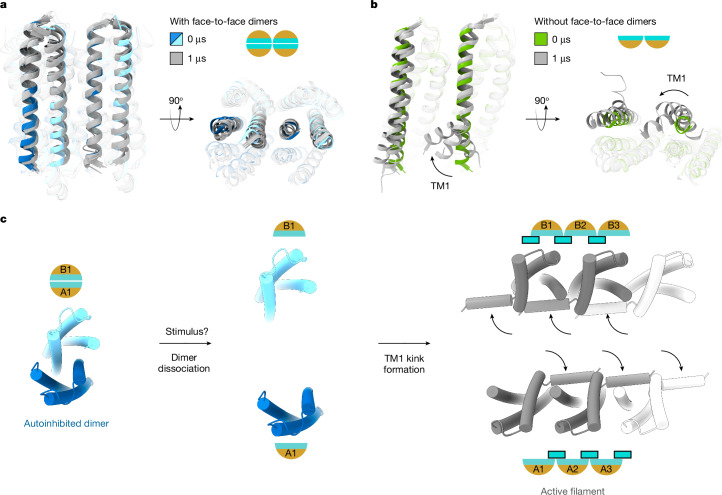
Lytic cell death culminates in plasma membrane rupture, which releases large intracellular molecules to augment the inflammatory response. Plasma membrane rupture is mediated by the effector membrane protein ninjurin-1 (NINJ1)1, which polymerizes and ruptures the membrane via its hydrophilic face1-4. How NINJ1 is restrained under steady-state conditions to ensure cell survival remains unknown. Here we describe the molecular underpinnings of NINJ1 inhibition. Using cryogenic electron microscopy, we determined the structure of inactive-state mouse NINJ1 bound to the newly developed nanobody Nb538. Inactive NINJ1 forms a face-to-face homodimer by adopting a three-helix conformation with unkinked transmembrane helix 1 (TM1), in contrast to the four-helix TM1-kinked active conformation2-4. Accordingly, endogenous NINJ1 from primary macrophages is a dimer under steady-state conditions. Inactive dimers sequester the membrane rupture-inducing hydrophilic face of NINJ1 and occlude the binding site for kinked TM1 from neighbouring activated NINJ1 molecules. Mutagenesis studies in cells show that destabilization of inactive face-to-face dimers leads to NINJ1-mediated cell death, whereas stabilization of face-to-face dimers inhibits NINJ1 activity. Moreover, destabilizing mutations prompt spontaneous TM1 kink formation, a hallmark of NINJ1 activation. Collectively, our data demonstrate that dimeric NINJ1 is autoinhibited in trans to prevent unprovoked plasma membrane rupture and cell death.


Conflict of interest statement

Competing interests: The following authors are employees of Genentech: S.P., M.E.T., M.C.J., Y.Y., L.Z., K.A., I.B.S., S.G., P.A.C., Y.Z., A.R., K.N., N.K., V.M.D. and I.D.

Figures

Fig. 1
Fig. 1. Structure of inactive NINJ1(K45Q) bound to Nb538.
a, Schematic outline of nanobody (Nb) selection strategy. Nanobodies were selected using full-length mouse NINJ1(K45Q) or NINJ1(K45Q ∆N) (residues 30–152) in LMNG/CHS, and full-length NINJ1(K45Q) in lipid nanodiscs. b, SPR sensorgram, showing binding of NINJ1(K45Q) to immobilized Nb538. Raw traces are coloured blue and global kinetic fits are coloured black. Data are representative of three independent experiments. c, Cryo-EM density map of NINJ1(K45Q) in complex with Nb538. The map reveals four NINJ1 subunits (blue) bound to two Nb538 molecules (orange) and several probable unmodelled detergents or lipids (yellow). The map is contoured at 0.27σ. d, Ribbon diagram of NINJ1(K45Q) in complex with Nb538. NINJ1 A1 and B1 form a face-to-face dimer. NINJ1 A1:B1 and A2:B2 form a side-to-side dimer of dimers. Transmembrane helices are numbered 1–3. Black dotted lines indicate symmetry between face-to-face dimers and side-to-side dimer of dimers.
Fig. 2
Fig. 2. Inactive face-to-face NINJ1 dimers are stabilized by unkinked TM1.
a, Immunoblot of NINJ1 in extract from primed BMDMs following treatment with indicated amounts of glutaraldehyde (GA) crosslinker (n = 3 independent immunoblots). KO, knockout; WT, wild type. b, Ribbon diagrams comparing the TM1 conformation in inactive NINJ1(K45Q) (blue, this study) and active wild-type NINJ1 (grey, Protein Data Bank (PDB) ID: 8SZA). Transmembrane helices are numbered 1–3. c, NINJ1 A1:B1 dimerization is driven by TM1–TM1 packing. Unkinked TM1 residues N33–A55 are shown as thick ribbons. Residues L56–Q142 are shown as thin ribbons. d, Inactive NINJ1 dimers occlude the binding site for active-state TM1 from hypothetical neighbouring NINJ1 molecules. Residues N33–A55 of active-state TM1 are coloured grey. e, Cytoplasmic view of the NINJ1 dimer displayed as cylinders. Nb538 (not shown) engages a composite epitope (orange) formed by the NINJ1 A1:B1 dimer in the TM1-unkinked conformation. Key NINJ1 residues that mediate contacts with Nb538 are shown as sticks. ICL, intracellular loop; N-term, residues N33–V38. f, Schematic of SplitGFP reconstitution system. g, Live-cell imaging of Ninj1-deficient BALB/3T3 cells transfected with mCherry, N-terminally tagged GFP11–NINJ1 and C-terminally tagged NbAlfa–GFP1–10 or Nb538–GFP1–10. Scale bar, 40 µm. h, Quantification of membrane GFP fluorescence in Ninj1-deficient BALB/3T3 cells transfected with mCherry and the indicated constructs. Lines represent the mean and circles represent 30–34 cells quantified over three independent experiments. Welch’s one-way ANOVA test. ****P < 0.0001. Source Data
Fig. 3
Fig. 3. Dimerization sequesters the hydrophilic face to trans-autoinhibit NINJ1.
a, NINJ1(K45Q) face-to-face dimer displayed as a semi-transparent surface coloured by electrostatic potential and as a ribbon diagram. b, NINJ1 A1 is hidden to reveal a polar pocket at the core of the dimer. c, Close-up view of the polar interactions between NINJ1 A1 (dark blue) and B1 (light blue). Interacting residues are labelled and shown as sticks. Dotted black lines denote hydrogen bonds identified by ChimeraX. d, Top, inactive NINJ1(K45Q) dimer of dimers coloured by lipophilicity to highlight sequestration of the hydrophilic face. Bottom, cytoplasmic view of inactive NINJ1 in cartoon representation. e, A side-to-side dimer of wild-type NINJ1 (PDB ID: 8SZA) highlights membrane exposure of the hydrophilic face. Bottom, cytoplasmic view of active NINJ1 in cartoon representation. Cyan rectangle with a black outline highlights kinked TM1. Surface lipophilicity was calculated in ChimeraX. f, Cartoon representation of point mutants designed to stabilize the inactive face-to-face dimer or to destabilize the inactive face-to-face dimer. g, Cytotoxicity of wild-type NINJ1, and dimer-stabilizing (blue) and dimer-destabilizing (green) NINJ1 in HEK293T cells. CD20 is an unrelated membrane protein control. A previously reported gain-of-function mutant, L121F, is included for comparison. Killing score is the cytotoxicity normalized to wild-type NINJ1. Data are mean (bars) of 12, 7 or 6 individual replicates (circles) for wild-type, dimer-stabilizing mutants or dimer-destabilizing mutants, respectively from three individual experiments. Welch’s one-way ANOVA test. A48S, **P = 0.0015; K45R, **P = 0.005; L52N, ***P = 0.0006; S46A, N119Q, ***P = 0.0002; A59C, K45Q, ****P < 0.0001. h,i, Membrane damage measured by YOYO-1 dye (1.2 kDa) incorporation in NINJ1-expressing HEK293T cells. Data are mean ± s.d.; three independent replicates.
Fig. 4
Fig. 4. Proposed model for NINJ1 activation.
a, All-atom molecular dynamics simulations of NINJ1(K45Q) with face-to-face dimerization (see also Extended Data Figs. 5 and 8). Ribbon diagram of NINJ1 face-to-face dimers (A1, A2 in dark blue; B1, B2 in light blue), shown at the start of simulations. The last snapshot from each of the 3 independent 1-µs-long simulations is shown in grey. TM2 and TM3 are shown as transparent ribbons to highlight TM1. b, All-atom molecular dynamics simulations of NINJ1(K45Q) in the absence of autoinhibitory face-to-face dimerization (see also Extended Data Fig. 8). Ribbon diagram showing the first snapshot (in green) and the last snapshots (in grey) from each of the three independent 1-µs-long simulations. Transparency settings as in a. Arrow indicates TM1 movement. c, Extracellular view of the proposed model for NINJ1 activation. In the basal-state, NINJ1 face-to-face dimer trans-autoinhibits by sequestering the hydrophilic face. TM1 is unkinked and occludes the binding site for kinked TM1 observed in the active state. Upon stimulus, autoinhibition is released by dissociation of the face-to-face dimer and TM1 kink formation (curved arrows) to expose the PMR-inducing hydrophilic face.
Extended Data Fig. 1
Extended Data Fig. 1. Biochemical and structural analysis of NINJ1 K45Q.
a, Liposome cargo release by NINJ1 WT or K45Q. Data are means (bars) of nine individual replicates (circles) from three independent replicates. Significance was determined using Welch one-way ANOVA test. ***P < 0.001. 100% cargo release is the total cargo release following addition of 1% cholamidopropyl(dimethylammonio)-2-hydroxy-1-propanesulfonate (CHAPSO). Melittin is used as a positive control. b, SEC trace of NINJ1 K45Q purified in LMNG/CHS. Peak 1 at 9 ml, peak 2 at 11.5 ml and peak 3 at 12.3 ml. Arrows indicate molecular weight standard marker positions. mAU: milli-absorbance units. c, Representative micrographs of NINJ1 K45Q peaks 1, 2 and 3. (n = 7,114, 4,233 and 9,316 micrographs). White arrow indicates a filament. d, Representative 2D class averages of NINJ1 K45Q peaks 1, 2 and 3, showing particles are composed of similar repeating subunits. e, Immunoblot of NINJ1 in SEC fractions corresponding to peaks 1, 2 and 3. (n = 3 independent immunoblots). f, Example 2D class averages including a close-up view of four class averages showing different orientations of apo NINJ1 K45Q peak 2. Scale bar, 110 Å. g, Flowchart of cryoEM image processing. h, Low resolution anisotropic cryoEM map of apo NINJ1 K45Q peak 2. Source Data
Extended Data Fig. 2
Extended Data Fig. 2. Nb538 specifically binds inactive-state NINJ1.
a, FSEC to screen for co-elution of NINJ1 K45Q peak 2 fractions with several His-tagged nanobodies. Five nanobodies co-elute with NINJ1 K45Q (light orange), one nanobody does not (grey). Nb538 is highlighted in orange. AU: arbitrary units. (n = 2 independent experiments). b, ELISA shows binding of Nb538-displaying phage particles (orange) to immobilised full-length NINJ1 K45Q or NINJ1 K45Q ∆N (residues 30–152) or WT NINJ1 in LMNG/CHS or in lipid nanodiscs (ND). A non-binding nanobody was used as a specificity control (grey). Bars represent the mean and circles represent data from three independent replicates. OD: optical density. c, Surface plasmon resonance (SPR) sensorgram showing WT NINJ1 fails to bind immobilised Nb538. Raw traces are coloured blue. Data representative of three independent experiments. d, SEC trace and coomassie-stained SDS-PAGE gel of the NINJ1 K45Q Nb538 complex used for cryoEM. Peak fraction at 11.3 ml was used for grid preparation. Representative of 5 independent purifications.
Extended Data Fig. 3
Extended Data Fig. 3. cryoEM data processing for NINJ1 K45Q bound to Nb538.
a, A representative cryoEM micrograph (n = 9,838 micrographs). b, Example 2D class averages including a close-up view of four class averages showing different orientations of NINJ1 K45Q bound to Nb538. Scale bar, 90 Å. c, Flowchart of cryoEM image processing.
Extended Data Fig. 4
Extended Data Fig. 4. cryoEM map of NINJ1 K45Q bound to Nb538.
a, Final EM map used for structural modelling. Surface colour indicates estimated local resolution. b, Final Fourier Shell Correlation (FSC) curve. c, Final viewing direction distribution. Representative cryoEM densities for all transmembrane helices in NINJ1 K45Q protomer d, A1 e, B1 f, A2 and g, B2. All maps are contoured at 0.6 σ. Residues discussed in the manuscript are labelled.
Extended Data Fig. 5
Extended Data Fig. 5. NINJ1 forms face-to-face dimers in the absence of Nb538.
a, Representative 2D class averages of NINJ1 K45Q in the presence and absence of Nb538. Density contributed by Nb538 is identified with orange arrows. b, The anisotropic cryoEM density map of the apo NINJ1 K45Q peak 2 sample. The map is consistent with four NINJ1 subunits (blue) surrounded by a detergent micelle (yellow). c, Ribbon diagram of NINJ1 K45Q (blue) in complex with Nb538 (orange). d, Rigid body fitting of NINJ1 K45Q with Nb538 removed into the cryoEM density map of apo NINJ1 K45Q. e-h, All-atom molecular dynamics simulations to assess stability of inactive conformation. e, f, NINJ1 K45Q in the absence of Nb538. g, h, NINJ1 WT in the absence of Nb538. e, g, Starting model for simulations shown in blue (NINJ1). Simulation frames sampled every 100 ns from a representative 1 µs long simulation shown in grey. f, h, Root mean square deviation (RMSD) of NINJ1 TM backbone atoms over the course of three independent simulation replicates. Dark blue and light blue traces indicate mean and standard deviation respectively from three simulation replicates.
Extended Data Fig. 6
Extended Data Fig. 6. AlphaFold2 predicts lower order multimerization of WT NINJ1.
Top-ranked AlphaFold2-predicted models of WT NINJ1 shown as ribbons. a, monomer; b, dimer; d, trimer; or e, tetramer models are coloured by pLDDT (predicted local distance difference test) scores. c, cryoEM structure of NINJ1 K45Q dimer in blue superimposed on AlphaFold2-predicted WT NINJ1 dimer in grey.
Extended Data Fig. 7
Extended Data Fig. 7. Analysis of NINJ1 constructs and activity mutants.
a, Immunoblot of WT and Ninj1-deficient BALB/3T3 cells transfected with indicated plasmids used in Fig. 2g,h. (n = 2 independent immunoblots). b, Left, cytoplasmic view of a representative dimer-stabilised mutation A48S (blue sticks), predicted to interact with E49 (grey sticks). Right, cytoplasmic view of a representative dimer-destabilised mutation K45R (green sticks). Clashes are highlighted in magenta. c, Immunoblot of HEK293T cells transfected with indicated plasmids. Left, dimer-stabilised mutants; and Right, dimer-destabilised mutants corresponding to Fig. 3g. (n = 3 independent immunoblots). d, Liposome cargo release by WT NINJ1 or indicated mutants. Bars show the mean of three independent replicates performed in triplicate. Each circle represents the mean of one replicate performed in triplicate. 100% cargo release is the total cargo release following addition of 1% CHAPSO. e-h, Nb538 shows reduced binding to NINJ1 dimer-destabilised mutants. e, Immunoblot of WT and Ninj1-deficient BALB/3T3 cells transfected with WT or dimer-destabilising NINJ1 mutants fused to GFP11. (n = 2 independent immunoblots). f, Live imaging of Ninj1-deficient BALB/3T3 cells transfected with either NbAlfa-GFP 1-10 or Nb538-GFP 1-10 and indicated WT or dimer-destabilising NINJ1 mutants fused to GFP11. mCherry indicates transfected cells. Scale bar, 40 µm. g, Quantification of membrane GFP fluorescence in Ninj1-deficient BALB/3T3 cells transfected with mCherry and indicated constructs. mCherry was used to threshold for cells with similar expression levels. Lines represent the mean and circles represent individual cells quantified over two independent experiments. h, Immunofluorescence imaging of Ninj1−/− BALB/3T3 cells expressing either WT Ninj1 or indicated mutants. Cells are stained for NINJ1 and DAPI (nuclei). Images are representative of 3 independent experiments. Scale bar, 40 µm. Source Data
Extended Data Fig. 8
Extended Data Fig. 8. MD simulations show TM1 movement upon dissociation of face-to-face dimers.
a, All-atom MD simulations of two side-to-side NINJ1 K45Q molecules with face-to-face dimerization, resolved by cryoEM (total of 4 NINJ1 molecules). One (out of two) NINJ1 face-to-face dimer is shown in blue at the start of simulations, and in grey at the end of a representative simulation run. The other copy of the NINJ1 dimer is not shown for clarity. Residues V38 on TM1 and H112 on TM3, used to track TM1 movement, are shown as spheres. Black dotted line indicates the distance between V38 and H112. b, Distance between V38 on TM1 and H112 on TM3 over the course of three 1 µs-long independent simulations measured for all 4 molecules in the dimer of dimers. Black dotted lines indicate a distance of 10 Å. c-d, Same as in a-b, but without face-to-face dimerization (total of 2 NINJ1 molecules). For simulation snapshots of a-d, see Fig 4a,b. e-h, All atom MD simulations of a hypothetical multimer composed of five side-to-side NINJ1 K45Q molecules with face-to-face dimerization (total of 10 NINJ1 molecules) (e,f) or without face-to-face dimerization (total of 5 NINJ1 molecules) (g,h). e, Ribbon diagram of NINJ1 multimer with face-to-face dimerization showing the first snapshot (in blue) and the last snapshots (in grey) from each of the three independent 1 µs-long simulations. TM2 and TM3 are shown as transparent ribbons to highlight TM1. f, Distance plots of TM1 movement in e, measured for 5 molecules. g, Ribbon diagram of NINJ1 multimer without face-to-face dimerization showing the first snapshot (in green) and the last snapshots (in grey) from each of the three independent 1 µs-long simulations. Arrows indicate TM1 movement. h, Distance plots of TM1 movement in g, measured for 5 molecules.
Extended Data Fig. 9
Extended Data Fig. 9. Side-to-side dimers of active or inactive NINJ1 are structurally similar.
a, Overlay of inactive NINJ1 K45Q A1:A2 side-to-side dimers (blue) and active WT NINJ1 dimers (PDB ID: 8SZA, grey) shown as ribbons. TM helices are numbered. b, Close-up view of interacting residues, labelled and shown as sticks. Side-to-side dimerization in both structures is driven by hydrophobic packing between TM3 of A2 and TM1, TM2 of A1.

References

    1. Kayagaki, N. et al. NINJ1 mediates plasma membrane rupture during lytic cell death. Nature591, 131–136 (2021). - DOI - PubMed
    1. Degen, M. et al. Structural basis of NINJ1-mediated plasma membrane rupture in cell death. Nature618, 1065–1071 (2023). - DOI - PMC - PubMed
    1. David, L. et al. NINJ1 mediates plasma membrane rupture by cutting and releasing membrane disks. Cell187, 2224–2235 (2024). - DOI - PMC - PubMed
    1. Sahoo, B., Mou, Z., Liu, W., Dubyak, G. & Dai, X. How NINJ1 mediates plasma membrane rupture and why NINJ2 cannot. Preprint at bioRxiv10.1101/2023.05.31.543175 (2023). - PMC - PubMed
    1. Kayagaki, N., Webster, J. D. & Newton, K. Control of cell death in health and disease. Annu. Rev. Pathol.19, 157–180 (2024). - DOI - PubMed

MeSH terms

Substances

LinkOut - more resources