. 2025 Jan;637(8044):176-183.
doi: 10.1038/s41586-024-08279-y. Epub 2024 Oct 30.

Endogenous self-peptides guard immune privilege of the central nervous system

Affiliations

Endogenous self-peptides guard immune privilege of the central nervous system

Min Woo Kim et al. Nature. 2025 Jan.

Abstract

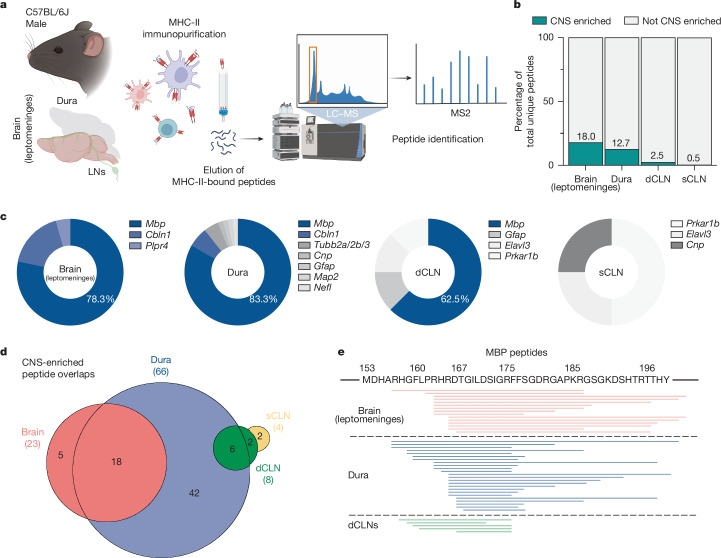
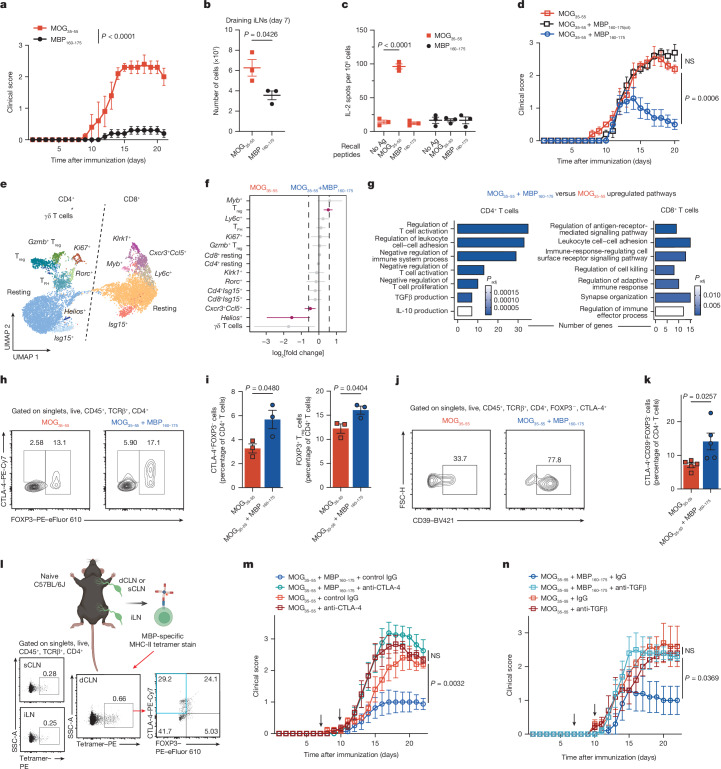
Despite the presence of strategically positioned anatomical barriers designed to protect the central nervous system (CNS), it is not entirely isolated from the immune system1,2. In fact, it remains physically connected to, and can be influenced by, the peripheral immune system1. How the CNS retains such responsiveness while maintaining an immunologically unique status remains an outstanding question. Here, in searching for molecular cues that derive from the CNS and enable its direct communication with the immune system, we identified an endogenous repertoire of CNS-derived regulatory self-peptides presented on major histocompatibility complex class II (MHC-II) molecules in the CNS and at its borders. During homeostasis, these regulatory self-peptides were found to be bound to MHC-II molecules throughout the path of lymphatic drainage from the brain to its surrounding meninges and its draining cervical lymph nodes. However, in neuroinflammatory disease, the presentation of regulatory self-peptides diminished. After boosting the presentation of these regulatory self-peptides, a population of suppressor CD4+ T cells was expanded, controlling CNS autoimmunity in a CTLA-4- and TGFβ-dependent manner. CNS-derived regulatory self-peptides may be the molecular key to ensuring a continuous dialogue between the CNS and the immune system while balancing overt autoreactivity. This sheds light on how we conceptually think about and therapeutically target neuroinflammatory and neurodegenerative diseases.


Conflict of interest statement

Competing interests: M.W.K. and J.K. hold provisional patent applications related to findings presented here.

Figures

Fig. 1
Fig. 1. The CNS MHC-II peptidome reveals presentation of endogenous CNS peptides.
a, Schematic of MS identification of MHC-II-bound peptides from the brain (including leptomeninges), dural meninges (dura) and LNs, including the dCLNs and sCLNs, of C57BL/6J male mice. The diagram was created with BioRender.com. b, The proportion of total unique identified peptides that could be designated as CNS enriched (teal bar); percentages are indicated above each individual bar. c, CNS-enriched, MHC-II-bound peptides identified for each individual tissue. The percentage composed by MBP is indicated where relevant. d, The relationship between CNS-enriched, MHC-II-bound peptides in the brain, dura, dCLNs and sCLNs. e, Summary of individual peptide sequences contained within the MBP158–195 region as defined by the MHC-II peptidome.
Fig. 2
Fig. 2. MBP is non-encephalitogenic and fosters immunosuppression.
a, EAE was assessed in C57BL/6J mice immunized with MOG35–55 or MBP160–175. n = 5 per group. Data are mean ± s.e.m., representative of two independent experiments. Statistical analysis was performed using two-way analysis of variance (ANOVA). b,c, Draining iLNs were extracted from mice immunized with MOG35–55 or MBP160–175 on day 7. n = 3 per group. b, Quantification of cell counts. Data are mean ± s.e.m. Statistical analysis was performed using unpaired two-tailed Student’s t-tests. c, ELISpot assay of IL-2 production by CD4+ T cells after recall with the indicated peptides. Data are mean ± s.e.m. Statistical analysis was performed using two-way ANOVA with Šídák’s post hoc test. Ag, antigen. d, EAE was evaluated for C57BL/6J male mice that were immunized with MOG35–55, MOG35–55 + MBP160–175(cit) or MOG35–55 + MBP160–175. n = 5 per group. Data are mean ± s.e.m., representative of three independent experiments. Statistical analysis was performed using two-way ANOVA with Dunnett’s post hoc test. e,f, scRNA-seq analysis of T cells isolated from the draining iLNs of C57BL/6J mice immunized with MOG35–55 or MOG35–55 + MBP160–175 displayed as a UMAP projection (e) and the log2-transformed fold change (f) of different T cell clusters; significant differences are indicated. n = 3 per group. TFH, T follicular helper cells. For f, data are mean ± s.e.m. g, Upregulated GO terms for CD4+ or CD8+ T cells in the MOG35–55 + MBP160–175 versus MOG35–55 group. Statistical analysis was performed using an over-representation test; P values were adjusted using the Benjamini–Hochberg method. h,i, Representative flow cytometry plots (h) and quantification (i) of the proportion of CTLA-4+FOXP3 or FOXP3+ Treg cells of CD4+ T cells in the dCLN 13 days after immunization. n = 3 per group. Data are mean ± s.e.m. Statistical analysis was performed using unpaired two-tailed Student’s t-tests. j,k, Representative flow cytometry plots (j) and quantification (k) of the proportion of CTLA-4+FOXP3CD39+ cells of CD4+ T cells in the spinal cord 13 days after immunization. n = 5 per group. Data are mean ± s.e.m. Statistical analysis was performed using unpaired two-tailed Student’s t-tests. l, Schematic of MBP-specific tetramer staining of CD4+ T cells from dCLNs, sCLNs and iLNs of naive C57BL/6J mice; positive staining for MBP-specific CD4+ T cells in the dCLN identifies FOXP3+ and CTLA-4+FOXP3 CD4+ T cells. The diagram was created with BioRender.com. m,n, EAE was tracked in C57BL/6J male mice that were immunized with MOG35–55 or MOG35–55 + MBP160–175. On days 7 and 10, the mice were treated with the following control or neutralizing antibodies: anti-CTLA-4 (m) or anti-TGFβ (n). n = 8 (anti-CTLA-4 or IgG, MOG35–55 + MBP160–175), n = 6 (anti-CTLA-4 MOG35–55) and n = 5 per group (other groups). Data are mean ± s.e.m., representative of three independent experiments. Statistical analysis was performed using two-way ANOVA with Dunnett’s post hoc test. NS, not significant.
Fig. 3
Fig. 3. Therapeutic delivery of regulatory MBP peptides guards against CNS autoimmunity.
a, Schematic of isolating MHC-II-bound peptides in the brain, dura and spinal cord at the peak (day 16) of MOG35–55-induced EAE. b, Quantification of the relative abundances of peptides within different antigenic regions when comparing between the MHC-II peptidomes of EAE and naive mice. The relative abundances (normalized peak areas) of indicated peptides were measured relative to CBLN157–72 for the brain and MBP196–236 for the dura. c, The relative abundances of MBP peptides (MBP158–195 or MBP196–236 regions) for the brain and dura when comparing EAE with naive mice. d, Schematic (top) of intracisterna magna injection of PBS, MBP160–175 EVs or MBP160–175(cit) EVs 7 days after immunization with MOG35–55 to induce EAE in C57BL/6J mice. The average clinical EAE scores were assessed. n = 5 per group. Data are mean ± s.e.m., representative of three independent experiments. Statistical analysis was performed using two-way ANOVA with Dunnett’s post hoc test. e, Schematic of intracisterna magna injection of EVs (empty, MBP160–175 or MBP160–175(cit)), after which duras were assessed using flow cytometry 2 days later. f, Representative flow cytometry plots (top) and quantification (bottom) of the proportion of CTLA-4+FOXP3 T cells (left) or FOXP3+ Treg cells (right) within the CD4+ T cell population. n = 5 per group. Data are mean ± s.e.m. Statistical analysis was performed using one-way ANOVA with Tukey’s post hoc test. g, UMAP visualization of eight distinct subclusters of CD4+ T cells from the dura and dCLN after intracisternal injection of either empty vesicles or MBP160–175-containing vesicles. The red box evidences the increase in the FOXP3 Treg cell cluster with MBP160–175-containing vesicles treatment. iNKT, invariant natural killer T cells. h, Q plot depiction of TCR clones identified in the dura and dCLN are colour-coded to represent the CD4+ T cell subcluster. The white dots with the corresponding name of TCR clonotype within the FOXP3 Treg cell cluster show an increase in mice receiving MBP160–175-containing EVs compared with empty EVs. The diagrams in a, d and e were created with BioRender.com.
Extended Data Fig. 1
Extended Data Fig. 1. Characterizing the CNS MHC II Peptidome of C57BL/6J male mice.
a, Peptide length distribution represented as a percent of the total number of unique peptides identified by the MHC II peptidome for the brain (which also includes the leptomeninges), dura, dCLNs, and sCLNs. b-e, Representative flow cytometry plots depicting the gating strategy used to identify the distribution of MHC II-expressing cells. Within the MHC II+ gate, B cells (gated on CD19+ CD11c), dendritic cells (DCs, gated on CD19 CD11c+), and macrophages (MΦ, gated on CD19 CD11c CD11b+) were identified. To the right, bar plots show the frequency of the aforementioned antigen presenting cells as a percent of CD45+ MHC II+ cells for the (b) brain, (c) dura, (d) dCLNs, and (e) sCLNs. (n = 5 mice analysed over 2 independent experiments; data shown as mean±s.e.m). f, Violin plot depicting predicted binding affinities for unique MHC II-bound peptides. The median is represented by a solid line and the first as well as the third quartiles are represented by dashed lines. P-values indicated on plot (one-way ANOVA with Tukey’s multiple comparisons test). g, Venn diagram depicting the relationship between all unique MHC II-bound peptides in the brain, dura, dCLNs, and sCLNs. h, Summary of individual peptides identified on the MBP sequence as defined by the MHC II peptidome of C57BL/6J male mice.
Extended Data Fig. 2
Extended Data Fig. 2. The CNS MHC II peptidome of C57BL/6J female mice.
a, Pie chart defining the makeup of CNS-enriched, MHC II-bound peptides across each individual tissue. Percent of CNS-enriched peptides that are MBP are indicated in the plots, where relevant. b, Summary of all identified individual peptide sequences derived from MBP in the C57BL/6J female MHC II peptidome. c, Venn diagram representation of individual overlapping CNS-enriched peptide sequences identified between C57BL/6J females and males in the brain (including leptomeninges). d, Bar graph showing the relative abundance of MBP peptides in the brain that comprised either the MBP158-195 or MBP196-236 regions in both C57BL/6J males and females. Relative abundances (normalized peak areas) measured against a common identified peptide sequence, Dag1488-531, from which relativity was ascertained. e, Venn diagram representation of individual CNS-enriched overlapping peptide sequences identified between C57BL/6J females and males in the dura. f, Bar graph showing the relative abundance of MBP peptides in the dura that comprised either the MBP158-195 or MBP196-236 regions in both C57BL/6J males and females. Relative abundances (normalized peak areas) measured against a common identified peptide sequence, Sptn1381-389, from which relativity was determined.
Extended Data Fig. 3
Extended Data Fig. 3. The CNS MHC II peptidome of SJL/J male mice.
a, Violin plot depicting predicted binding affinities for unique MHC II-bound peptides in the brain (which also includes the leptomeninges), dura, dCLNs, and sCLNs of SJL/J mice. The median is represented by a solid line, and the first as well as the third quartiles are represented by dashed lines. P-values indicated on plot (one-way ANOVA with Tukey’s multiple comparisons test). b, Evaluation of the proportion of total unique identified peptides designated as CNS enriched (teal bar) in the brain, dura, dCLNs, and sCLNs; percentages indicated above each individual bar. c-d, Venn diagram illustrating the relationship between all peptides (c) or CNS-enriched peptides (d) bound to MHC II molecules across the different tissues in SJL/J male mice. e, Donut plot representation of all CNS-enriched peptides identified in the MHC II peptidome of SJL/J male mice for the brain, dura, and sCLNs. The part of the whole for which MBP represents is indicated in the plot, where relevant. f, Depiction of all individual peptide sequences deriving from MBP identified in the SJL/J male MHC II peptidome.
Extended Data Fig. 4
Extended Data Fig. 4. Endogenous regulatory MBP peptides protect across different models of neuroinflammation.
a, Experimental design of C57BL/6J or SJL/J mice immunizations with MOG35-55 or PLP139-151 peptides, respectively, with or without MBP or NEFL peptides to actively induce EAE. Separately, C57BL/6J mice immunized with MOG or MBP peptides to perform ELISpot assay. Schematic created with BioRender.com. b, Mice immunized with MBP166-185 or MBP192-216 and ELISpot assay performed to measure IL-2 production upon recall with indicated peptides (n = 3/group). Data shown as mean±s.e.m, two-way ANOVA with Šídák’s post-hoc test performed. c, Average clinical EAE scores assessed by immunizing with MOG35-55, MOG35-55 + MBP166-185, or MOG35-55 + MBP192-216 in C57BL/6J male mice (n = 5/group). Plots display mean±s.e.m and represent two independent experiments; two-way ANOVA with Dunnett’s post-hoc test performed. d, Line graph representation of peptide competition assay: dendritic cells, as APCs, incubated with varying doses of competitor peptides (MBP160-175, MBP160-175 (cit.), OVA323-339) and pulsed with a fixed concentration of MOG35-55 antigen. Unbound peptides washed away and a MOG35-55-specific hybridoma was introduced to assess its response by IL-2 ELISA. Plots shown as mean±s.e.m and represent three independent experiments. e, Average clinical EAE scores assessed by immunizing with MOG35-55, MOG35-55 + MBP160-175 (cit.), or MOG35-55 + MBP160-175 in C57BL/6J female mice (n = 5/group). Plots display mean±s.e.m and represent three independent experiments; two-way ANOVA with Dunnett’s post-hoc test used. f, Average clinical EAE scores assessed by immunizing with PLP139-151, PLP139-151 + MBP160-175, or PLP139-151 + NEFL160-173 in SJL/J male mice (n = 5/group). Plots display mean±s.e.m and represent two independent experiments; two-way ANOVA with Dunnett’s post-hoc test performed.
Extended Data Fig. 5
Extended Data Fig. 5. Peripheral presentation of MBP peptides induces suppressor T cells.
a, Dot plot of population markers from single cell RNA-sequencing scaled by percentage of cells expressing marker genes for each T cell cluster. b, Representative gating strategy for flow cytometry used to define within CD4+ T cells, CTLA-4+Foxp3 T cells as well as conventional Foxp3+ regulatory T cells (Treg). CTLA-4+Foxp3 CD4+ T cells further gated to assess CD39, PD-1 (CD279), and IL-10 expression. c-d, Representative flow cytometry plots (c) with relevant quantifications (d) demonstrating the proportion of CTLA-4+Foxp3 T cells and Foxp3+ Treg within the CD4+ T cell population in the draining (inguinal) lymph nodes (iLN) 13 days post-immunization (n = 3/group, mean±s.e.m, unpaired two-tailed Student’s t-test). e, Quantification of conventional Foxp3+ Treg as a frequency of CD4+ T cells in the spinal cord 13 days post-immunization (n = 5/group, mean±s.e.m, unpaired two-tailed Student’s t-test). f-g, Representative flow cytometry plots (f) with quantifications (g) demonstrating the proportion of CTLA-4+Foxp3 T cells and Foxp3+ Treg within the CD4+ T cell population in the brain dura 18 days post-immunization (n = 3/group, mean±s.e.m, unpaired two-tailed Student’s t-test). h-i, Representative flow cytometry plots (h) with quantifications (i) demonstrating the proportion of CTLA-4+Foxp3 T cells and Foxp3+ Treg within the CD4+ T cell population in the spinal cord dura 18 days post-immunization (n = 3/group, mean±s.e.m, unpaired two-tailed Student’s t-test).
Extended Data Fig. 6
Extended Data Fig. 6. MBP-specific CD4+ T cells exhibit immunosuppressive capacity.
a, Dose-response curve demonstrating reactivity of an MBP-specific hybridoma clone to MBP160-175 and MBP166-185 peptides; readout by IL-2 ELISA of half-logarithmic serial dilutions. Plots display mean±s.e.m and represent two independent experiments. b, Schematic created with BioRender.com. Gating strategy used to define MBP-specific CD4+ T cells by tetramer staining. c-d, CD4+ T cells isolated from draining iLNs after immunization with MBP160-175; sorted for tetramer positive (MBP-specific) and tetramer negative CD4+ T cells. UMAP visualization depicts 8 CD4+ T cell subclusters (c) with enrichment to the Tregs subcluster in tetramer positive cells, indicated by red dots (d). e, Q-plot of TCR clones identified in tetramer negative (top) and tetramer positive (bottom) T cells colour-coded to represent the CD4+ T cell subcluster. f, Dot plot of population markers from scRNA-seq scaled by percentage of cells expressing marker genes for each CD4+ T cell cluster. g, Violin plot comparing Tgfb1 and Ctla4 expression between tetramer negative and tetramer positive samples. Data shown as mean±s.e.m (n = 8/group, unpaired two-tailed Student’s t-test). h-i, Schematic created with BioRender.com. (h) and bar plot of IL-2 ELISA (i), demonstrating the attenuation of primary MOG-specific CD4+ T cell responses by primary MBP-specific CD4+ T cells but not by tetramer negative polyclonal CD4+ T cells; this was blunted by anti-CTLA-4 or anti-TGFβ neutralizing antibodies. Data (mean±s.e.m) represent two independent experiments; two-way ANOVA performed. j, EAE assessed in mice immunized with MOG35-55 or MOG35-55 + MBP160-175; on days 7 and 10 post-immunization, mice were treated with isotype control or anti-IL-10 neutralizing antibodies (n = 5/group). Data (mean±s.e.m) represent three independent experiments; two-way ANOVA with Dunnett’s post-hoc test used. k-m, Schematic generated with BioRender.com. (k), representative flow cytometry plots (l), and quantifications (m) of tetramer staining of MBP-specific or MOG-specific CD4+ T cells in the thymus of naïve 1-month-old C57BL/6J mice (n = 4/group, mean±s.e.m, unpaired two-tailed Student’s t-test).
Extended Data Fig. 7
Extended Data Fig. 7. APCs differ in their ability to present regulatory MBP peptides.
a-b, Mice immunized with CFA or CFA + MOG35-55 to assess for changes to MHC II expression as shown by representative flow cytometry plots (a) and quantifications (b), n = 5/group, mean±s.e.m, unpaired two-tailed Student’s t-test. c, Pie chart depiction of CNS-enriched, MHC II-bound peptides identified in the brain and spinal cord at the peak of EAE disease. Below is a visual summary of individual MBP sequences identified. Top image created with BioRender.com. d-e, Different professional antigen presenting cells (APCs), including CD19+ B cells, CD11c+ dendritic cells (DCs), and CD11b+ macrophages (Macs), were enriched from the spleens of naïve C57BL/6J mice. Spinal cord homogenate, a source of CNS antigens, was provided prior to the identification of MHC II-bound peptides by mass spectrometry. Schematic was created with BioRender.com. (d) and the visual summary of the MBP sequences identified bound to MHC II molecules (e) evidence differential abilities for the different professional APCs to present MBP peptides. f-h, Schematic illustration created with BioRender.com. (f) and gating strategy as well as histogram representation of MHC II expression (g) demonstrating the conditional ablation of MHC II molecules specifically on CX3CR1+ CD11b+ macrophages in the dural meninges with tamoxifen treated Cx3cr1CreERT2::H2-Ab1fl/fl mice but not in control Cx3cr1CreERT2::H2-Ab1+/+ mice. (h) Relative abundances (normalized peak areas) of MHC II-bound peptides contained within the MBP158-195 region in the dura, revealing a decrease with the loss of MHC II expression on CX3CR1+ CD11b+ macrophages; abundances were measured relative to Sptan1381-389.
Extended Data Fig. 8
Extended Data Fig. 8. Neuroinflammation alters the MHC II-bound repertoire of autoantigens.
a, Population pyramid representation of the distribution of amino acids identified at the C-terminus as a percent of the total MHC II-bound peptides, indicating cleavage preference between EAE and naïve mice. b, UMAP projections of the Jordão et al. dataset displaying broad cell lineages, colour-coded accordingly, when analysing naïve, pre-symptomatic, and EAE mice. cDCs = conventional dendritic cells. migDCs = migratory dendritic cells. c, Volcano plot depicting differences in gene expression when comparing microglia in EAE-induced mice to controls. Arrows indicate peptidases that could be identified. d, Gene ontologies found to be significantly upregulated in microglia when comparing between EAE and naïve mice. e-g, Schematic illustration created with BioRender.com. (e) of pre-treating bone marrow derived myeloid cells with vehicle or LPS prior to providing spinal cord homogenate (source of CNS antigens) and performing MHC II peptidomics. (f) Bar plot shows the total number of MHC II-bound peptides identified in vehicle and LPS treated conditions. (n = 3 samples of bone marrow derived myeloid cells treated with vehicle or LPS; data shown as mean±s.e.m; unpaired two-tailed Student’s t-test). (g) Bar graph represents relative abundances (normalized peak areas) determined for different CNS-enriched MHC II-bound peptides, including MBP158-195, MBP196-236, Plp1266-277, Nefl14-30, Elavl3308-316, for which differential changes to their presentation could be observed with LPS treatment (n = 3 samples of bone marrow derived myeloid cells treated with vehicle or LPS; data shown as mean±s.e.m). Abundances were measured relative to Vdac1283-296.
Extended Data Fig. 9
Extended Data Fig. 9. Delivery of encapsulated MBP peptides directly into the CSF induces suppressor CD4+ T cells.
a, Immunoblot performed on the supernatant (SN) and resuspended pellet after ultracentrifugation evidencing enrichment of tetraspanins, CD9 and CD63, markers of extracellular vesicles (EVs). Blots represent two independent experiments. Below is a negative stain by transmission electron microscopy depicting enriched EVs, scale bar indicated on the panel. b, Mice were immunized with MOG35-55 peptide and provided empty EVs, MBP192-216 EVs, OVA323-339 EVs, or MBP160-175 EVs via i.c.m. injection on day 7 post immunization to induce EAE. Clinical EAE scores were tracked up to 20 days post immunization (n = 5/group). Plots display mean±s.e.m and represent two independent experiments; two-way ANOVA with Dunnett’s post-hoc test performed. c, Mice were immunized with MOG35-55 to induce EAE after which they were provided with PBS or free MBP160-175 peptides via i.c.m. injection on day 7. Average clinical EAE scores assessed until day 20 post immunization (n = 5/group). Plots display mean±s.e.m and represent two independent experiments; two-way ANOVA with Dunnett’s post-hoc test performed. d, Gating strategy for flow cytometry analysis to define within CD4+ T cells, CTLA-4+Foxp3 unconventional suppressor T cells as well as conventional Foxp3+ Treg. Representative flow cytometry plots of the dCLNs depicting gates for these populations with i.c.m. injection of empty EVs, MBP160-175 EVs, or MBP160-175(cit.) EVs. e-g, Quantification of unconventional CTLA-4+Foxp3 suppressor T cells as well as conventional Foxp3+ Treg as a frequency of CD4+ T cells of the deep cervical lymph nodes (e), superficial cervical lymph nodes (f), and spleen (g) (n = 5/group, mean±s.e.m, one-way ANOVA with Tukey’s post-hoc test).
Extended Data Fig. 10
Extended Data Fig. 10. scRNA-seq of the CNS after local delivery of MBP peptides reveal expanded suppressor Foxp3 T cells.
a, Dot plot of population markers from scRNA-seq scaled by percentage of cells expressing marker genes for each CD4+ T cell clusters. b, Bar graph representation of the proportion of CD4+ T cell clusters found in mice treated via intracisternal injection of either empty vesicles (EV) or MBP-containing vesicles (MBP). c, Log2 fold change evaluated for the identified CD4+ T cell clusters by scRNA-seq when comparing between mice that received intracisternal injection of empty vesicles or MBP-containing vesicles. Significant differences indicated on the plot (n = 10/group; data shown as mean±s.e.m). d, UMAP visualization of T cell clonality of CD4+ T cells in mice that received MBP-containing vesicles. e, Tabulated depiction of CD4+ T cell clones of regulatory phenotypes identified in mice treated with MBP-containing vesicles – describing their TCR subtype, CDR3 sequences, and phenotype.

References

    1. Rustenhoven, J. & Kipnis, J. Brain borders at the central stage of neuroimmunology. Nature612, 417–429 (2022). - PMC - PubMed
    1. Smyth, L. C. D. et al. Identification of direct connections between the dura and the brain. Nature627, 165–173 (2024). - PMC - PubMed
    1. Shirai, Y. On the transplantation of the rat sarcoma in adult heterogenous animals. Jap. Med. World1, 14–15 (1921).
    1. Murphy, J. B. & Sturm, E. Conditions determining the transplantability of tissues in the brain. J. Exp. Med.38, 183–197 (1923). - PMC - PubMed
    1. Medawar, P. B. Immunity to homologous grafted skin; the fate of skin homografts transplanted to the brain, to subcutaneous tissue, and to the anterior chamber of the eye. Br. J. Exp. Pathol.29, 58–69 (1948). - PMC - PubMed

MeSH terms