. 2024 Dec;300(12):107940.
doi: 10.1016/j.jbc.2024.107940. Epub 2024 Oct 28.

The GPCR adaptor protein Norbin controls the trafficking of C5aR1 and CXCR4 in mouse neutrophils

Affiliations

The GPCR adaptor protein Norbin controls the trafficking of C5aR1 and CXCR4 in mouse neutrophils

Stephen A Chetwynd et al. J Biol Chem. 2024 Dec.

Abstract

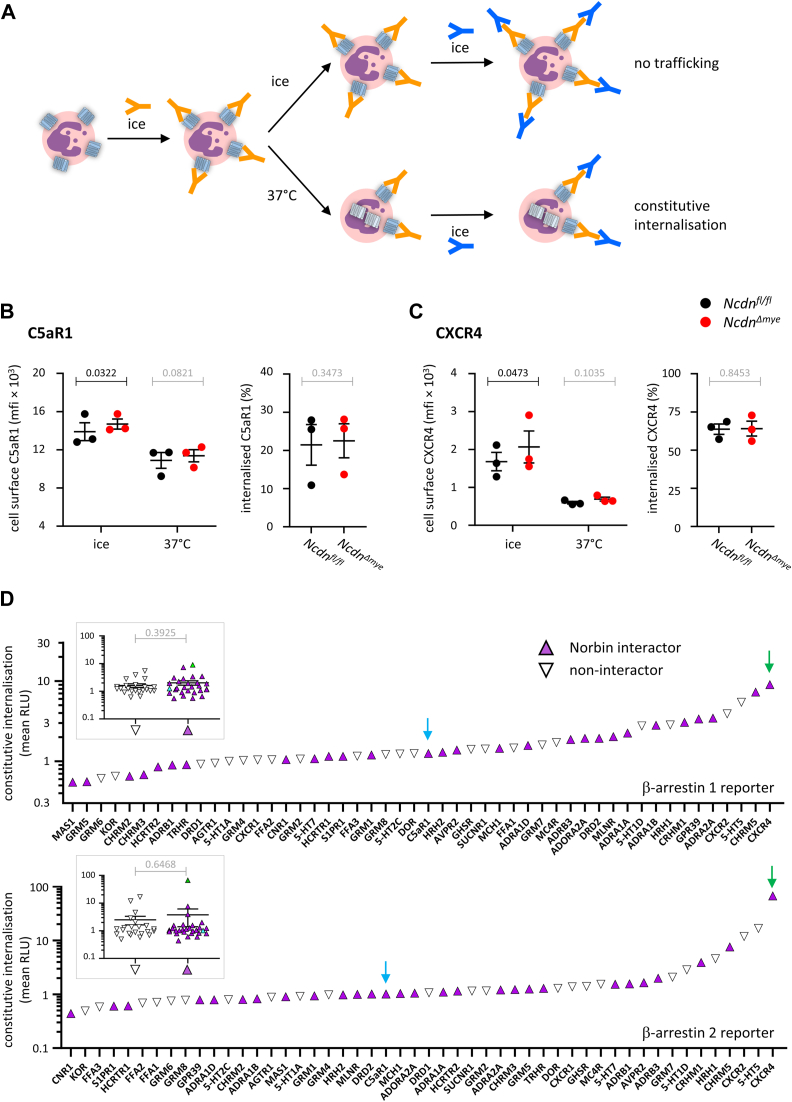
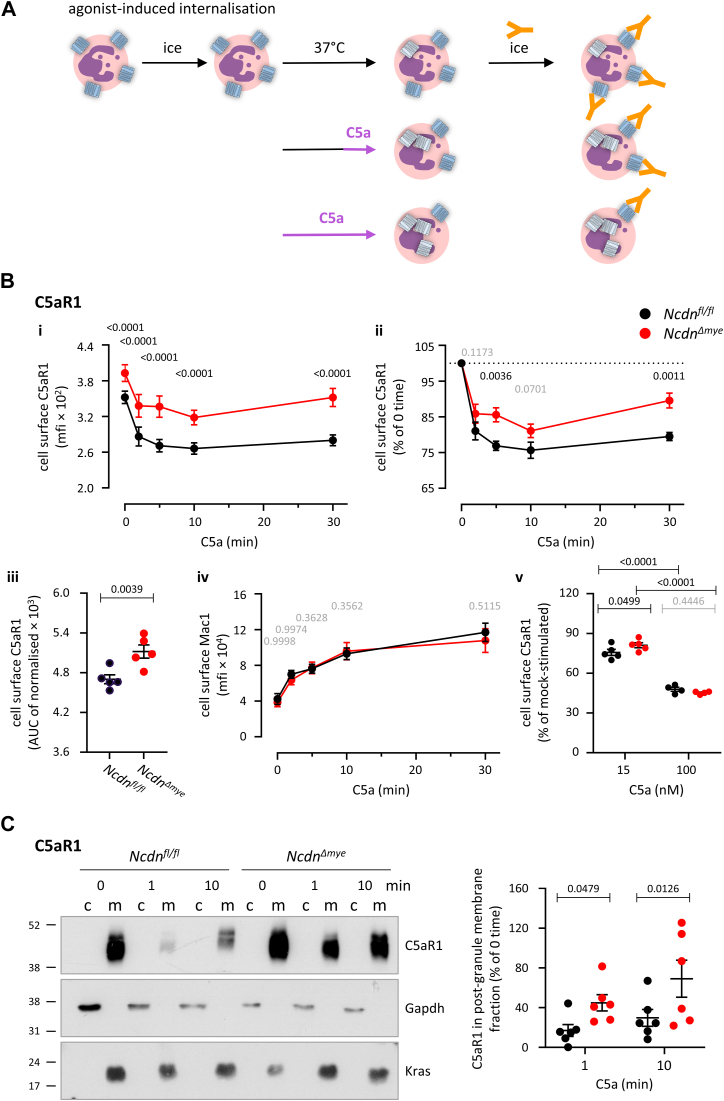
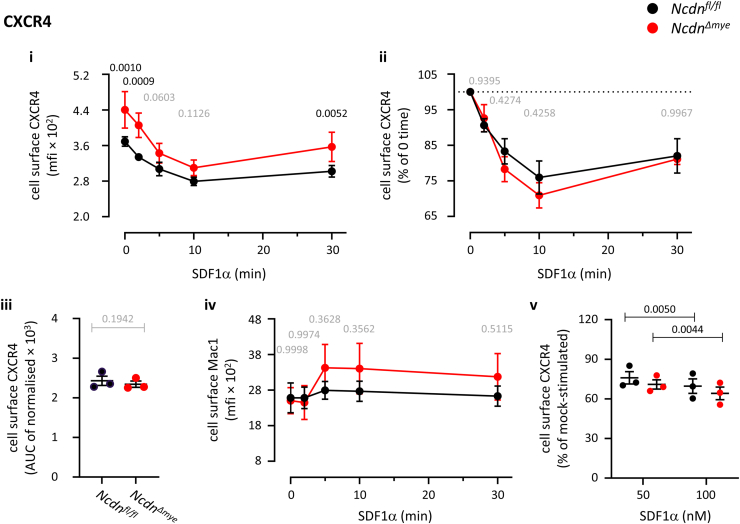
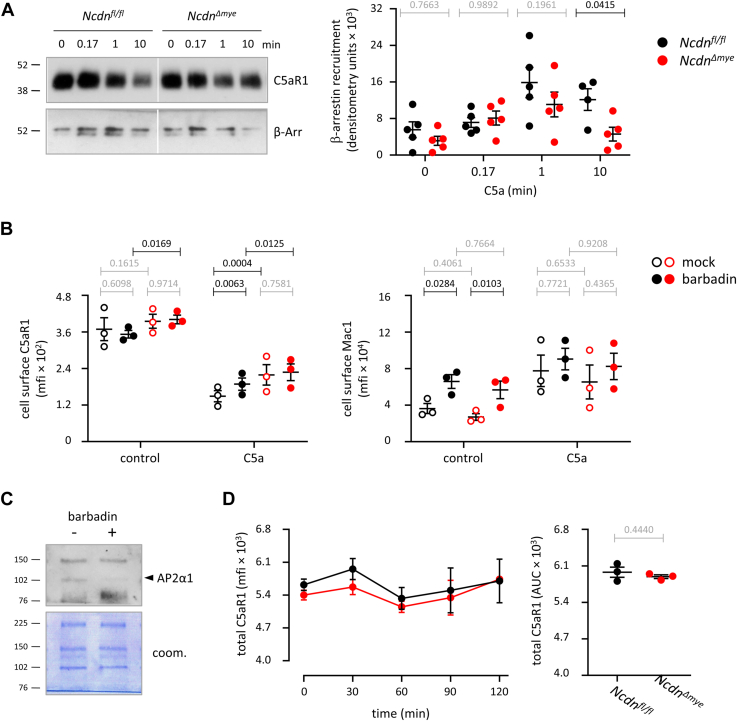
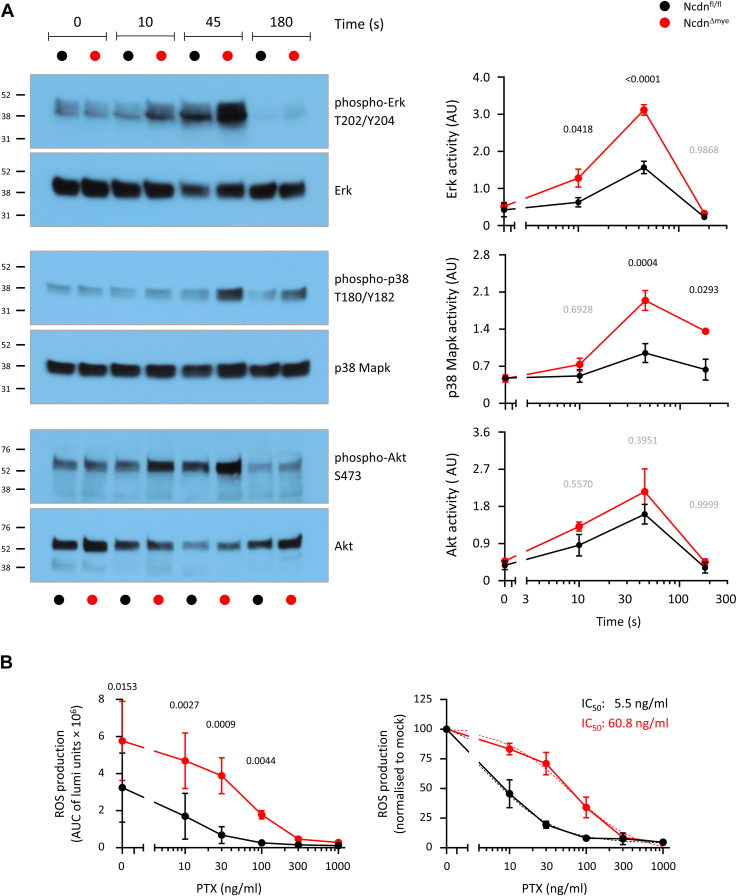
Norbin (Neurochondrin, NCDN) is a G protein-coupled receptor (GPCR) adaptor protein known for its importance in neuronal function. Norbin works by binding to numerous GPCRs, controlling their steady-state trafficking and sometimes their agonist-induced internalization, as well as their signaling. We recently showed that Norbin is expressed in neutrophils, limits the surface levels of the GPCRs C5aR1 and CXCR4 in neutrophils, and suppresses neutrophil-mediated innate immunity. Here, we identify C5aR1 and CXCR4 as direct Norbin interactors and used mice with myeloid-Norbin deficiency to investigate the role of Norbin in the trafficking of endogenous C5aR1 and CXCR4 in primary neutrophils by flow cytometry and cell fractionation. We show that Norbin mediates the agonist-induced internalization of C5aR1 through a β-arrestin-dependent mechanism and limits the recycling of internalized C5aR1 and CXCR4 back to the cell surface. Norbin does not control the constitutive internalization of C5aR1 and CXCR4 nor does it affect the agonist-induced internalization of CXCR4. Norbin suppresses C5aR1 signaling in mouse neutrophils by limiting the C5a-stimulated membrane translocation of Tiam1, Vav, and PKCδ, and activation of Erk and p38 Mapk pathways, as well as Gαi-dependent reactive oxygen species production. Our study demonstrates how Norbin suppresses C5aR1 and CXCR4 function in neutrophils and increases our understanding of the mechanisms through which Norbin regulates GPCR trafficking generally, by identifying its importance in β-arrestin recruitment, β-arrestin dependent agonist-induced receptor internalization, and receptor recycling.

Keywords: C5aR1; CXCR4; G protein–coupled receptor (GPCR); GPCR trafficking; Ncdn; Neurochondrin; P-Rex1; agonist-induced internalization; receptor desensitization; receptor endocytosis; receptor recycling; β-arrestin.


Conflict of interest statement

Conflict of interest The authors declare that they have no conflicts of interest with the contents of this article.

Figures

Figure 1
Figure 1
Norbin binds C5aR1 and CXCR4 and limits their cell surface levels in mouse neutrophils.A and B, Left-hand panels: Cell surface levels of C5aR1 and CXCR4. Bone marrow cells from Ncdnfl/fl (black) and NcdnΔmye (red) mice were stained on ice to identify live neutrophils (Mac1hi, Ly6Ghi, FVDlo) and quantify the basal surface levels of (A) C5aR1 and (B) CXCR4 on the neutrophil surface by flow cytometry. Right-hand panels: Total levels of C5aR1 and CXCR4. Bone marrow cells were fixed, permeabilized, and stained to identify neutrophils markers (Mac1hi, Ly6Ghi) and quantify the total levels of (A) C5aR1 and (B) CXCR4 in neutrophils by flow cytometry. Mean fluorescence intensities (mfi) were analyzed using FlowJo. Data are mean ± SEM of 3 to 4 independent experiments; each dot represents the mean of 1 experiment. Statistics are two-tailed paired Student’s t test. p-values in black show significant differences, p-values in gray are not significant. C and D, direct interaction of Norbin with C5aR1 and CXCR4 in vitro. Recombinant His-Norbin was purified (C) and incubated with the GST-tagged C-terminal tails of GPCRs, or GST, as indicated, and GST-tagged proteins were isolated using glutathione Sepharose (D). Samples were analyzed by SDS-PAGE and western blotting with His-tag antibodies (upper panel). Recombinant His-Norbin was loaded as a control. Coomassie staining (lower panel) shows the amount of GST-GPCR protein loaded. Representative blots shown are from 1 of 4 to 5 independent experiments. Direct binding of Norbin to C5aR1 and CXCR4 was seen in three out of five and four out of four experiments, respectively. E and F, endogenous Norbin and C5aR1 interact constitutively in neutrophils. Purified Ncdnfl/fl neutrophils were lysed by sonication, and endogenous Norbin (E) or C5aR1 (F) were immunoprecipitated from the PGS. Controls without cell lysate or without immunoprecipitation antibody were processed in parallel as indicated. Protein interaction was analyzed by western blotting with antibodies against C5aR1 and Norbin. The heavy-chain of the immunoprecipitating antibodies (IgG hc) is indicated in gray. Blots shown are representative of 2 experiments.
Figure 2
Figure 2
Norbin does not control the constitutive internalization of C5aR1 and CXCR4.A, schematic of the constitutive receptor internalization assay. B and C, bone marrow cells from Ncdnfl/fl (black) and NcdnΔmye (red) mice were stained on ice with primary antibodies to (B) C5aR1 or (C) CXCR4 to label the cell surface GPCRs. Cells were washed, and either kept on ice to prevent receptor trafficking, or incubated for 30 min at 37 °C to permit constitutive receptor internalization. Both sets of cells were then stained on ice with antibodies to identify live neutrophils (Mac1hi, Ly6Ghi, FVDlo) and secondary antibodies to quantify the levels of C5aR1 or CXCR4 on the neutrophil surface by flow cytometry. Left-hand panels: mfi of C5aR1 or CXCR4 were analyzed using FlowJo. Right-hand panels: The constitutive internalization of C5aR1 or CXCR4 at 37 °C is expressed as % of the cell surface levels on ice. Data are mean ± SEM of three independent experiments; each dot is the mean of one experiment. Statistics in left-hand panels are two-way ANOVA with Šidák’s multiple comparisons test; right-hand panels are two-tailed paired Student’s t test. p-values in black show significant differences, p-values in gray are not significant. D, in silico analysis correlating the ability of Norbin to bind GPCRs to the relative constitutive rates of internalization of GPCRs known to be Norbin-interactors (purple) or non-interactors (white). GPCR trafficking data were extracted from the Tango-Trio database, which quantified β-arrestin 1 (upper panel) or β-arrestin 2 (lower panel) recruitment to constitutively active GPCRs. Blue arrows highlight the position of C5aR1 and green arrows CXCR4. The inserts show receptors grouped by interactors (purple) and non-interactors (white). Statistics are Student’s t test, p-values in gray are not significant.
Figure 3
Figure 3
Norbin is required fortheoptimal agonist-induced internalization of C5aR1.A, schematic of the agonist-induced receptor internalization assay. B, bone marrow cells from Ncdnfl/fl (black) and NcdnΔmye (red) mice were incubated for 30 min at 37 °C. During this incubation, they were stimulated with 15 nM C5a for the indicated periods of time to induce the agonist-induced internalization of C5aR1. Cells were stained on ice to identify live neutrophils (Mac1hi, Ly6Ghi, FVDlo) and quantify the level of C5aR1 on the neutrophil surface by flow cytometry. (i) The mfi of C5aR1 on the neutrophil surface was analyzed using FlowJo. (ii) To account for the increased basal cell surface level of C5aR1, data were normalized to 0 time. (iii) AUC of normalized cell surface C5aR1 over 30 min (iv) The mfi of Mac1 on the neutrophil surface was quantified as a control. (v) Level of C5aR1 on the neutrophil surface after incubation for 30 min at 37 °C, with either 15 nM or 100 nM C5a for the final 10 min of the incubation, as indicated. Data are mean ± SEM of five independent experiments (4 for 100 nM C5a, lower right); each dot is the mean of one experiment. Statistics are two-way ANOVA with Šidák’s multiple comparisons test, except (iii) which was two-tailed paired Student’s t test. p-values in black show significant differences, p-values in gray are not significant. C, cell fractionation. Purified Ncdnfl/fl (black) and NcdnΔmye (red) neutrophils were incubated for 30 min at 37 °C. Some were stimulated with 50 nM C5a for 1 or 10 min towards the end of the 30 min incubation to induce the agonist-induced internalization of C5aR1. Cells were lysed in detergent-free buffer and fractionated by differential centrifugation. The post-granule supernatant (PGS) was ultracentrifuged to generate cytosol (c) and post-granule membrane (m) fractions which were analyzed by SDS-PAGE and western blotting with antibodies against C5aR1, Gapdh as cytosol marker, and Kras as plasma membrane marker. 20% of the plasma membrane and 1.4% of the cytosol fractions were loaded. The abundance of C5aR1 in the plasma membrane fraction was quantified by Fiji densitometry and adjusted for the Coomassie signal over the whole lane to correct for protein loading (see also Fig. 7). Representative blots are shown. C5aR1 in the membrane fraction is expressed as % of the 0-time control. Data are mean ± SEM of six independent experiments. Statistics are two-way ANOVA with Šidák’s multiple comparisons test.
Figure 4
Figure 4
Norbin does not controltheagonist-induced internalization of CXCR4. Bone marrow cells from Ncdnfl/fl (black) and NcdnΔmye (red) mice were incubated for 30 min at 37 °C. During this incubation, the cells were stimulated with 50 nM SDF1α for the indicated periods of time to induce the agonist-induced internalization of CXCR4. Cells were stained on ice to identify live neutrophils (Mac1hi, Ly6Ghi, FVDlo) and quantify the level of CXCR4 on the neutrophil surface by flow cytometry. (i) The mfi of CXCR4 on the neutrophil surface was analyzed using FlowJo. (ii) To account for the increased basal cell surface level of CXCR4, data were normalized to 0 time. (iii) AUC of normalized cell surface CXCR4 over 30 min (iv) The mfi of Mac1 on the neutrophil surface was quantified as a control. (v) Level of CXCR4 on the neutrophil surface after incubation for 30 min at 37 °C including stimulation with either 50 nM or 100 nM SDF1α for the final 10 min of the incubation, as indicated. Data are mean ± SEM of 3 independent experiments; each dot is the mean of one experiment. Statistics are two-way ANOVA with Šidák’s multiple comparisons test, except (iv) which was two-tailed paired Student’s t test. p-values in black show significant differences, p-values in gray are not significant.
Figure 5
Figure 5
Norbin limits the recycling of internalized C5aR1 and CXCR4 back to the cell surface.A, schematic of the receptor recycling assay. B and C, bone marrow cells from Ncdnfl/fl (black) and NcdnΔmye (red) mice were stimulated for 10 min at 37 °C with high doses of agonist (B: 100 nM C5a; C: 100 ng/ml nM SDF1α) to induce the maximal internalization of C5aR1 and CXCR4, respectively, or were mock-stimulated. Cells were washed, and then either kept on ice as a control, or incubated at 37 °C for the indicated periods of time to allow the recycling of internalized receptors back to the cell surface and were then kept on ice. Cells were stained on ice to identify live neutrophils (Mac1hi, Ly6Ghi, FVDlo) and quantify the level of (B) C5aR1 or (C) CXCR4 on the neutrophil surface by flow cytometry. (i) The mfi of C5aR1 and CXCR4 on the neutrophil surface was analyzed using FlowJo. (ii) To account for the increased basal cell surface level of the GPCRs, data were normalized by setting the maximally internalized level to 0 and basal receptor levels to 100%. (iii) AUC of normalized cell surface C5aR1 and CXCR4 over 60 min (iv) The mfi of Mac1 on the neutrophil surface was quantified as a control. Data are mean ± SEM of 4 independent experiments for each receptor; each dot is the mean of one experiment. Statistics are two-way ANOVA with Šidák’s multiple comparisons test, except middle right, two-tailed paired Student’s t test. p-values in black show significant differences, p-values in gray are not significant.
Figure 6
Figure 6
Norbin is required for sustained β-arrestin recruitment and promotes the agonist-induced internalization of C5aR1 in a β-arrestin-dependent manner.A, β-arrestin recruitment. Purified Ncdnfl/fl (black) and NcdnΔmye (red) neutrophils were incubated for 10 min at 37 °C while being stimulated with 15 nM C5a for 0, 0.17, 1 or 10 min, as indicated. Cells were lysed, a post-granule supernatant (PGS) was prepared by centrifugation, and glycosylated proteins, including C5aR1, were purified from the PGS using wheat-germ agglutinin agarose. Proteins were analyzed by SDS-PAGE and western blotting with C5aR1 and β-arrestin (β-Arr) antibodies. Representative western blots are shown. Blots were quantified by Fiji densitometry, and the β-arrestin signal was normalized to the amount of C5aR1 in each lane. Data are mean ± SEM of five independent experiments; each dot is the mean of one experiment. Statistics are two-way ANOVA with Šidák’s multiple comparisons test. p-values in black show significant differences, p-values in gray are not significant. B, β-arrestin-dependent agonist-induced internalization. Bone marrow cells were pretreated with 100 μM barbadin for 30 min at 37 °C (filled symbols), or mock-treated with 1% DMSO (open symbols), and stimulated for 5 min with 50 nM C5a, or mock-stimulated (control). Cells were stained on ice to identify live neutrophils (Mac1hi, Ly6Ghi, FVDlo) and quantify the level of C5aR1 on the neutrophil surface by flow cytometry. The mfi of C5aR1 and Mac1 on the neutrophil surface were analyzed using FlowJo. Data are mean ± SEM of 3 independent experiments; each dot is the mean of one experiment. Statistics are two-way ANOVA with Šidák’s multiple comparisons test. p-values in black show significant differences, p-values in gray are not significant. C, barbadin blocks the recruitment of the clathrin-adaptor AP2. Purified Ncdnfl/fl neutrophils were incubated for 30 min at 37 °C in the presence of 100 μM barbadin or mock-treated, prior to stimulation with 15 nM C5a for 1 min at 37 °C. Glycosylated proteins purified from the PGS using wheat-germ agglutinin agarose as in (A) and analyzed by western blotting with AP2α1 antibody. Coomassie staining was used as a loading control. The blot shown is representative of two independent experiments. D, receptor degradation. Purified neutrophils were incubated for 2 h at 37 °C while being stimulated with 15 nM C5a for the indicated periods of time towards the end. Cells were fixed, permeabilized, and stained to analyse the total cellular level of C5aR1 by flow cytometry. Left-hand panel: The mfi of total neutrophil C5aR1 was analyzed using FlowJo. Right-hand panel: AUC of the 2 h time course. Data are mean ± SEM of three independent experiments; each dot is the mean of one experiment. Statistics are two-tailed paired Student’s t test. p-values in gray are not significant.
Figure 7
Figure 7
Norbin limits the C5a-stimulated recruitment of Tiam1, Vav1 and PKCδ to the plasma membrane, andsuppressesthe constitutive activity of Vav.A, (i) Cytosol (c) and post-granule membrane (m) fractions of C5a- or mock-stimulated Ncdnfl/fl (black) and NcdnΔmye (red) neutrophils from the same experiments as shown in Fig. 3C were analyzed by SDS-PAGE and western blotting with antibodies against Tiam1, Vav, active phospho-Y173-Vav, and PKCδ. 20% of the membrane and 1.4% of the cytosol fractions were loaded. Blots showing the cytosol marker Gapdh and plasma membrane marker Kras are included for reference. Membranes were Coomassie-stained to control for protein loading. (ii) Blots were quantified by Fiji densitometry. Tiam1 and Vav in cytosol and membrane fraction were quantified as % of the PGS. phospho-Y173-Vav and PKCδ in the membrane fraction were normalized to the Coomassie signal over the whole lane. Data are mean ± SEM of 3 to 5 independent experiments, as indicated; each dot is the mean of one experiment. Statistics are two-way ANOVA with Šidák’s multiple comparisons test. p-values in black show significant differences, p-values in gray are not significant. B, norbin is largely cytosolic. Cytosol and post-granule membrane fractions from Ncdnfl/fl neutrophils were western blotted for Norbin. 20% of the plasma membrane and 1.4% of the cytosol fractions were loaded. C, norbin translocates from the plasma membrane into early endosomes upon C5a stimulation. Ncdnfl/fl neutrophils were stimulated for with 100 nM C5a for 2 min (n = 2) or 10 min (n = 1), or were mock-stimulated, and early endosomes were isolated from the PGS using Eea1 immunoprecipitation before the plasma membrane was purified from the endosome-depleted PGS by ultracentrifugation. The fractions were western blotted for Norbin, Kras and Eea1 as indicated. The same cell-equivalents of plasma membrane and endosome fractions were loaded. Representative blots shown are from 1 of 3 independent experiments. Norbin blots were quantified by Fiji densitometry. Date are mean and ± SEM of 3 independent experiments. Statistics are two-way ANOVA with Šidák’s multiple comparisons test.
Figure 8
Figure 8
Norbin suppresses Erk and p38 Mapk signaling and Gαi-dependent ROS production in C5a-stimulated neutrophils.A, Norbin suppresses Erk and p38 Mapk signaling. Ncdnfl/fl (black) and NcdnΔmye (red) neutrophils were stimulated with 15 nM C5a as indicated, lysed, and analyzed by western blotting for phosphorylated, active and total Erk, p38 Mapk and Akt. Representative blots are shown. Quantification by ImageJ densitometry of phospho-signals divided by total protein. Data are mean ± SEM of three independent experiments. Statistics are two-way ANOVA with Šidák’s multiple comparisons test. p-values in black show significant differences, p-values in gray are not significant. B, norbin suppresses Gαi-dependent ROS production. ROS production in the presence of pertussis toxin (PTX) was measured in purified Ncdnfl/fl (black) and NcdnΔmye (red) neutrophils using real-time chemiluminescence assay. Neutrophils were pre-incubated with increasing concentrations of PTX, as indicated, primed with TNFα/GM-CSF, and stimulated with 25 nM C5a. (left) ROS production was quantified by integrating the area under the curve (AUC) of the ROS response over 5 min and plotted as a function of the PTX concentration. Date are mean and ± SEM of three independent experiments. Statistics are two-way ANOVA with Šidák’s multiple comparisons test. p-values showing significant differences are indicated. (right) Data were normalized to the mock-treated condition for each genotype, and best-fit curves (dotted lines) and IC50s were determined using GraphPad.

Similar articles

References

    1. Chetwynd S.A., Andrews S., Inglesfield S., Delon C., Ktistakis N.T., Welch H.C.E. Functions and mechanisms of the GPCR adaptor protein Norbin. Biochem. Soc. Trans. 2023;51:1545–1558. - PMC - PubMed
    1. Mochizuki R., Ishizuka Y., Yanai K., Koga Y., Fukamizu A. Molecular cloning and expression of human neurochondrin-1 and -2. Biochim. Biophys. Acta. 1999;1446:397–402. - PubMed
    1. Ishizuka Y., Mochizuki R., Yanai K., Takatsuka M., Nonomura T., Niida S., et al. Induction of hydroxyapatite resorptive activity in bone marrow cell populations resistant to bafilomycin A1 by a factor with restricted expression to bone and brain, neurochondrin. Biochim. Biophys. Acta. 1999;1450:92–98. - PubMed
    1. Schwaibold E.M.C., Brandt D.T. Identification of Neurochondrin as a new interaction partner of the FH3 domain of the Diaphanous-related formin Dia1. Biochem. Biophys. Res. Commun. 2008;373:366–372. - PubMed
    1. Pan D., Barber M.A., Hornigold K., Baker M.J., Toth J.M., Oxley D., et al. Norbin stimulates the catalytic activity and plasma membrane localization of the guanine-nucleotide exchange factor P-Rex1. J. Biol. Chem. 2016;291:6359–6375. - PMC - PubMed

Publication types

LinkOut - more resources