Multicenter Study
. 2024 Oct 30;11(2):e002937.
doi: 10.1136/openhrt-2024-002937.

Predicting troponin biomarker elevation from electrocardiograms using a deep neural network

Affiliations
Multicenter Study

Predicting troponin biomarker elevation from electrocardiograms using a deep neural network

Lukas Hilgendorf et al. Open Heart. .

Abstract

Background: Elevated troponin levels are a sensitive biomarker for cardiac injury. The quick and reliable prediction of troponin elevation for patients with chest pain from readily available ECGs may pose a valuable time-saving diagnostic tool during decision-making concerning this patient population.

Methods and results: The data used included 15 856 ECGs from patients presenting to the emergency rooms with chest pain or dyspnoea at two centres in Sweden from 2015 to June 2023. All patients had high-sensitivity troponin test results within 6 hours after 12-lead ECG. Both troponin I (TnI) and TnT were used, with biomarker-specific cut-offs and sex-specific cut-offs for TnI. On this dataset, a residual convolutional neural network (ResNet) was trained 10 times, each on a unique split of the data. The final model achieved an average area under the curve for the receiver operating characteristic curve of 0.7717 (95% CI±0.0052), calibration curve analysis revealed a mean slope of 1.243 (95% CI±0.075) and intercept of -0.073 (95% CI±0.034), indicating a good correlation between prediction and ground truth. Post-classification, tuned for F1 score, accuracy was 71.43% (95% CI±1.28), with an F1 score of 0.5642 (95% CI±0.0052) and a negative predictive value of 0.8660 (95% CI±0.0048), respectively. The ResNet displayed comparable or surpassing metrics to prior presented models.

Conclusion: The model exhibited clinically meaningful performance, notably its high negative predictive accuracy. Therefore, clinical use of comparable neural networks in first-line, quick-response triage of patients with chest pain or dyspnoea appears as a valuable option in future medical practice.

Keywords: Acute Coronary Syndrome; Chest Pain; Coronary Artery Disease.


Conflict of interest statement

Competing interests: None declared.

Figures
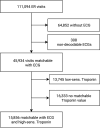
Figure 1
Figure 1. Dataset population. Displaying the filtering of emergency room (ER) visits with chest pain or dyspnoea down to the final population.
Figure 2
Figure 2. Receiver operating characteristic (ROC) curve of the over 10 models of the same architecture (mean±95% CI), each trained on a unique split of the data into testing and training data, for the final neural network predicting likelihood of high-sensitivity troponin elevation from 12-lead ECG obtained from patients presenting to an emergency room with chest pain or dyspnoea. The area under the curve (AUC) of 0.7717±0.0052 (mean±95% CI) indicates adequate prognostic power, as the AUC under the line of identity (0.5) represents full randomness of prediction, that is, zero predictive power of the model.
Figure 3
Figure 3. Calibration curve over 10 models of the same architecture (mean±95% CI), each trained on a unique split of the data into testing and training data, for the final neural network predicting likelihood of high-sensitivity troponin elevation from 12-lead ECG obtained from patients presenting to an emergency room with chest pain or dyspnoea.
Figure 4
Figure 4. Mean evaluation metrics over 10 models of the same architecture (mean±95% CI), each trained on a unique split of the data into testing and training data. All metrics should ideally approach 1. Due to imbalanced class sizes, negative predictive value (NPV) baseline, if completely random, is 0.738, and positive predictive value (PPV) is 0.262. AUC, area under the curve.
Figure 5
Figure 5. Saliency maps of the residual convolutional neural network (ResNet) model showing its regions of interest, taken from the test set, the leads displayed are V1–6. Examples of the ‘true class’ representing an elevated troponin (A) and the ‘false class’ representing a non-elevated troponin (B).

References

    1. Miller AS, Blott BH, Hames TK. Review of neural network applications in medical imaging and signal processing. Med Biol Eng Comput. 1992;30:449–64. doi: 10.1007/BF02457822. - DOI - PubMed
    1. Sakli N, Ghabri H, Soufiene BO, et al. ResNet-50 for 12-Lead Electrocardiogram Automated Diagnosis. Comput Intell Neurosci. 2022;2022:7617551. doi: 10.1155/2022/7617551. - DOI - PMC - PubMed
    1. Singh S, Chaudhary R, Bliden KP, et al. Meta-Analysis of the Performance of AI-Driven ECG Interpretation in the Diagnosis of Valvular Heart Diseases. Am J Cardiol. 2024;213:126–31. doi: 10.1016/j.amjcard.2023.12.015. - DOI - PMC - PubMed
    1. Siontis KC, Noseworthy PA, Attia ZI, et al. Artificial intelligence-enhanced electrocardiography in cardiovascular disease management. Nat Rev Cardiol. 2021;18:465–78. doi: 10.1038/s41569-020-00503-2. - DOI - PMC - PubMed
    1. Cho Y, Kwon J, Kim K-H, et al. Artificial intelligence algorithm for detecting myocardial infarction using six-lead electrocardiography. Sci Rep. 2020;10:20495. doi: 10.1038/s41598-020-77599-6. - DOI - PMC - PubMed

Publication types

LinkOut - more resources