. 2024 Nov 11;100(9):524-536.
doi: 10.2183/pjab.100.035. Epub 2024 Oct 31.

Incorporation of photosynthetically active algal chloroplasts in cultured mammalian cells towards photosynthesis in animals

Affiliations

Incorporation of photosynthetically active algal chloroplasts in cultured mammalian cells towards photosynthesis in animals

Ryota Aoki et al. Proc Jpn Acad Ser B Phys Biol Sci. .

Abstract

Chloroplasts are photosynthetic organelles that evolved through the endosymbiosis between cyanobacteria-like symbionts and hosts. Many studies have attempted to isolate intact chloroplasts to analyze their morphological characteristics and photosynthetic activity. Although several studies introduced isolated chloroplasts into the cells of different species, their photosynthetic activities have not been confirmed. In this study, we isolated photosynthetically active chloroplasts from the primitive red alga Cyanidioschyzon merolae and incorporated them in cultured mammalian cells via co-cultivation. The incorporated chloroplasts retained their thylakoid structure in intracellular vesicles and were maintained in the cytoplasm, surrounded by the mitochondria near the nucleus. Moreover, the incorporated chloroplasts maintained electron transport activity of photosystem II in cultured mammalian cells for at least 2 days after the incorporation. Our top-down synthetic biology-based approach may serve as a foundation for creating artificially photosynthetic animal cells.

Keywords: algae; chloroplast; cultured mammalian cell; photosynthesis; synthetic biology.


Conflict of interest statement

The authors have no competing interests to declare.

Figures

Fig. 1
Fig. 1
(Color online) Isolation of chloroplasts from schyzon. (A) The homogenized sample in a centrifuge tube was separated into two dark green layers after a homogeneity-gradient centrifugation: cell debris (upper layer) and isolated chloroplasts (lower layer). (B) Microscopy images of schyzon and isolated chloroplasts. Scale bar, 2 μm.
Fig. 2
Fig. 2
Photosynthetic activities and morphological changes of isolated chloroplasts. (A) Normalized (Fm set to 1) fluorescence decay of whole cells and isolated chloroplasts treated with or without DCMU. Data are presented as the mean ± SD (n = 3 for whole cells and n = 4 for isolated chloroplasts). (B) Maximum quantum yield of PSII (Fv/Fm) of whole cells and isolated chloroplasts. Fv/Fm values were calculated according to the fluorescence decay of whole cells and isolated chloroplasts. Data are presented as the mean ± SD (n = 3 for whole cells and n = 4 for isolated chloroplasts), with significance determined by a two-sided Student’s t-test. (C) Fluorescence (Chl) and bright field images (scale bar, 10 μm) of chloroplasts and their magnified images (scale bar, 2.5 μm) during a 6 day storage at 4℃. Chloroplasts were visualized according to chlorophyll autofluorescence. (D) Mean Fv/Fm values during the 6 day storage at 4℃. Data are presented as the mean ± SD (n ≥ 150 for isolated chloroplasts), with significance determined by a one-way analysis of variance.
Fig. 3
Fig. 3
Subcellular localization of incorporated chloroplasts in mammalian cultured cells. (A) Schematic illustration of the experiment conducted to examine the uptake of isolated chloroplasts by CHO-K1 cells as well as photosynthetic activities. (B) Cell proliferation rates for the normal cultivation (control) and co-cultivation with chloroplasts (co-culture) during 2 day co-cultivation. Data are presented as the mean ± SD (n = 3), with significance determined by a two-sided Student’s t-test (*P < 0.05, **P < 0.01). (C) Fluorescence microscopy images and orthogonal view of the z-stack of CHO-K1 cells co-cultivated for 2 days with (left) and without (right) isolated chloroplasts. The cells were washed after the co-cultivation. CHO-K1 cell membranes were stained with PlasMem Bright Green (green). Chloroplasts were visualized according to chlorophyll autofluorescence (magenta). Scale bar, 20 μm. (D) Number of incorporated chloroplasts in a CHO-K1 cell at 0, 2, and 4 days after co-cultivation. The frequency distribution of the number of chloroplasts in each CHO-K1 cell at each time point was compared with the corresponding data for the 0 day by a two-sided Fisher’s exact test (*P < 0.01, n ≥ 468 CHO-K1 cells). (E) Fluorescence microscopy image of a CHO-K1 cell that incorporated more than forty isolated chloroplasts (chloroplast-rich animal cell) at 0 day after the co-cultivation. Scale bar, 20 μm. (F) Fluorescence microscopy image of mitochondria and chloroplasts in CHO-K1 cells. Mitochondria were stained with MitoBright LT Green (green) and nuclei were stained with Hoechst 33342 (blue). Chloroplasts were visualized according to chlorophyll autofluorescence (magenta). Scale bar, 20 μm.
Fig. 4
Fig. 4
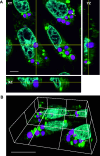
Three-dimensional (3D) analyses of incorporated chloroplasts in mammalian cells. (A) Super-resolution fluorescence microscopy image and orthogonal view of the z-stack of CHO-K1 cells that incorporated chloroplasts at 0 day after the co-cultivation. Cell membranes were stained with FM 1-43 (green), and nuclei were stained with DAPI (blue). Chloroplasts were visualized according to chlorophyll autofluorescence (magenta). Some chloroplasts maintain chloroplast DNA (white arrow). Scale bar, 5 μm. (B) 3D image of (A). A white arrow indicates the same chroloplast DNA as (A). Scale bar, 16 μm.
Fig. 5
Fig. 5
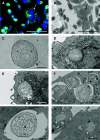
(Color online) Ultrastructural analyses of isolated and incorporated chloroplasts in mammalian cells. (A) Fluorescence microscopy image of CHO-K1 cells. Cell membranes were stained with FM1-43 (green), nuclei were stained with DAPI (blue), and chloroplasts were visualized according to chlorophyll autofluorescence (magenta). The white arrow indicates a CHO cell with chloroplasts. Scale bar, 50 μm. (B) Electron microscopy image of the same area examined using a fluorescence microscope. The black arrow indicates a CHO cell with chloroplasts. (C) Electron microscopy image of an isolated chloroplast. Scale bar, 2 μm. (D, E) Electron microscopy images of incorporated chloroplasts in a CHO-K1 cell at 0 day after the co-cultivation. Scale bar, 2 μm. (D) Chloroplast localized near the outer nuclear membrane and surrounded by mitochondria. (E) Incorporated chloroplast surrounded by mitochondria in the cytoplasm. (F, G) Electron microscopy images of incorporated chloroplasts in a CHO-K1 cell at 2 days after the co-cultivation. Scale bar, 2 μm. (F) Four incorporated chloroplasts in subcellular vesicles. (G) Chloroplast in a subcellular vesicle reveals the expansion of the space between thylakoid membranes. (H) Electron microscopy image of degenerated chloroplasts in a CHO-K1 cell at 4 days after the co-cultivation. Scale bar, 3 μm. White arrowheads indicate chloroplasts. Nu and Mt show nuclei and mitochondria, respectively.
Fig. 6
Fig. 6
(Color online) Measurement of photosynthetic quantum yield of isolated chloroplasts and incorporated chloroplasts in CHO-K1 cells at 0, 2 and 4 days after the co-cultivation via imaging PAM microscopy. The y-axis represents the effective quantum yield (φII) under continuous actinic light (2.8 μmol m-2 s-1). Data are presented as the mean ± SD; n = 8 (areas of interest in isolated chloroplasts: I.C.), n = 9 (areas of interest in isolated chloroplasts in CHO-K1 cells at 0 day), n = 6 (at 2 days), and n = 5 (at 4 days), with significance determined by a two-sided Student’s t-test (*P < 0.05).

References

    1. Nishihara A., Tsukatani Y., Azai C., Nobu M. K. (2024) Illuminating the coevolution of photosynthesis and Bacteria. Proc. Natl. Acad. Sci. U.S.A. 121, e2322120121. - PMC - PubMed
    1. Sato N. (2021) Are cyanobacteria an ancestor of chloroplasts or just one of the gene donors for plants and algae? Genes 12, 823. - PMC - PubMed
    1. Miyagishima S. (2023) Taming the perils of photosynthesis by eukaryotes: constraints on endosymbiotic evolution in aquatic ecosystems. Commun. Biol. 6, 1150. - PMC - PubMed
    1. Miller T.E., Beneyton T., Schwander T., Diehl C., Girault M., McLean R., Chotel T., et al. (2020) Light-powered CO2 fixation in a chloroplast mimic with natural and synthetic parts. Science 368, 649–654. - PMC - PubMed
    1. Matsunaga S. (2018) Planimal cells: Artificial photosynthetic animal cells inspired by endosymbiosis and photosynthetic animals. Cytologia 83, 3–6.

Substances