. 2025 Mar;21(3):619-638.
doi: 10.1080/15548627.2024.2421699. Epub 2024 Nov 4.

Atractylenolide I inhibits angiogenesis and reverses sunitinib resistance in clear cell renal cell carcinoma through ATP6V0D2-mediated autophagic degradation of EPAS1/HIF2α

Affiliations

Atractylenolide I inhibits angiogenesis and reverses sunitinib resistance in clear cell renal cell carcinoma through ATP6V0D2-mediated autophagic degradation of EPAS1/HIF2α

Qinyu Li et al. Autophagy. 2025 Mar.

Abstract

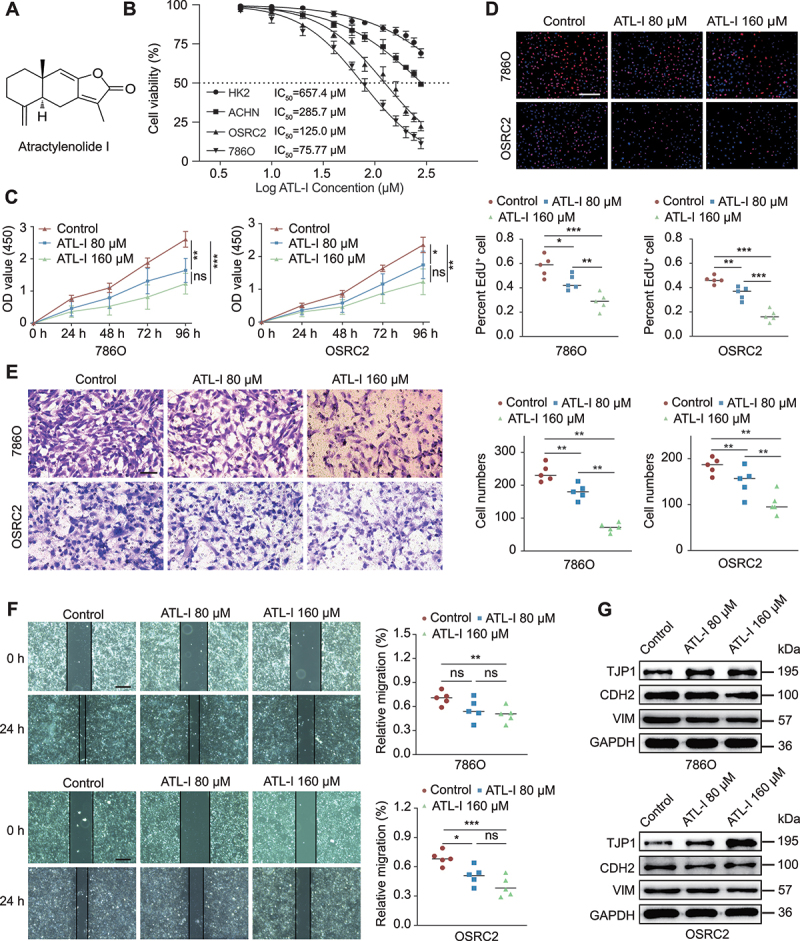
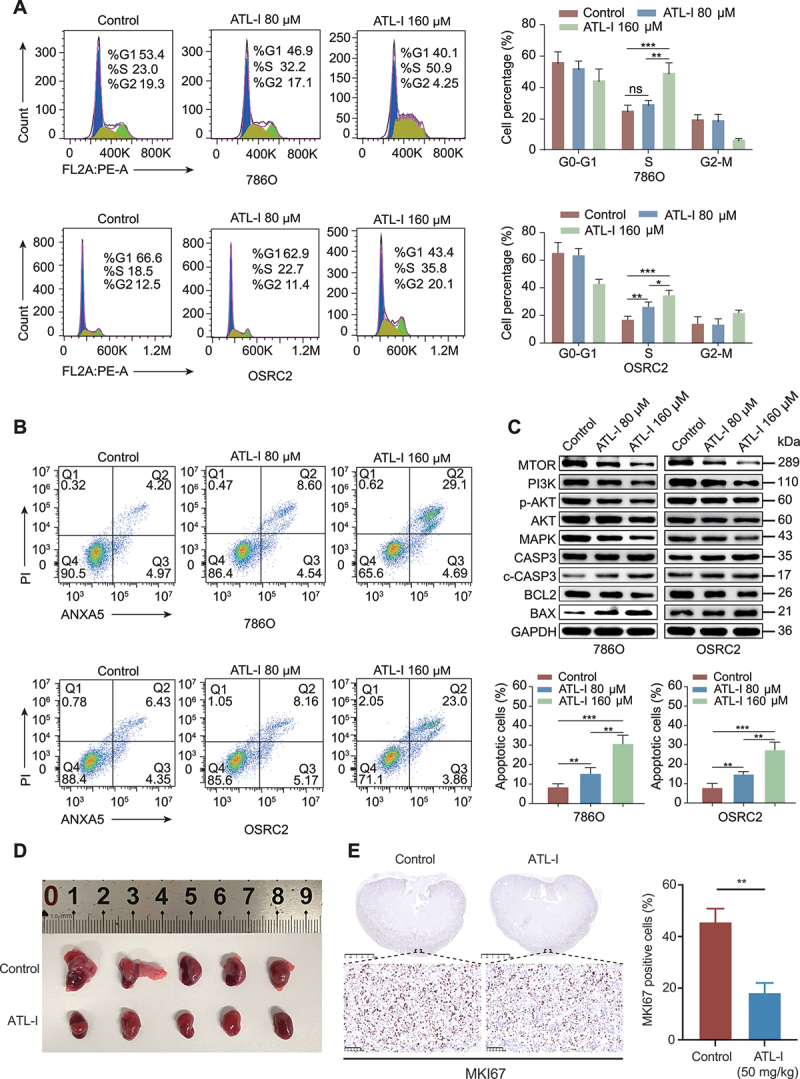
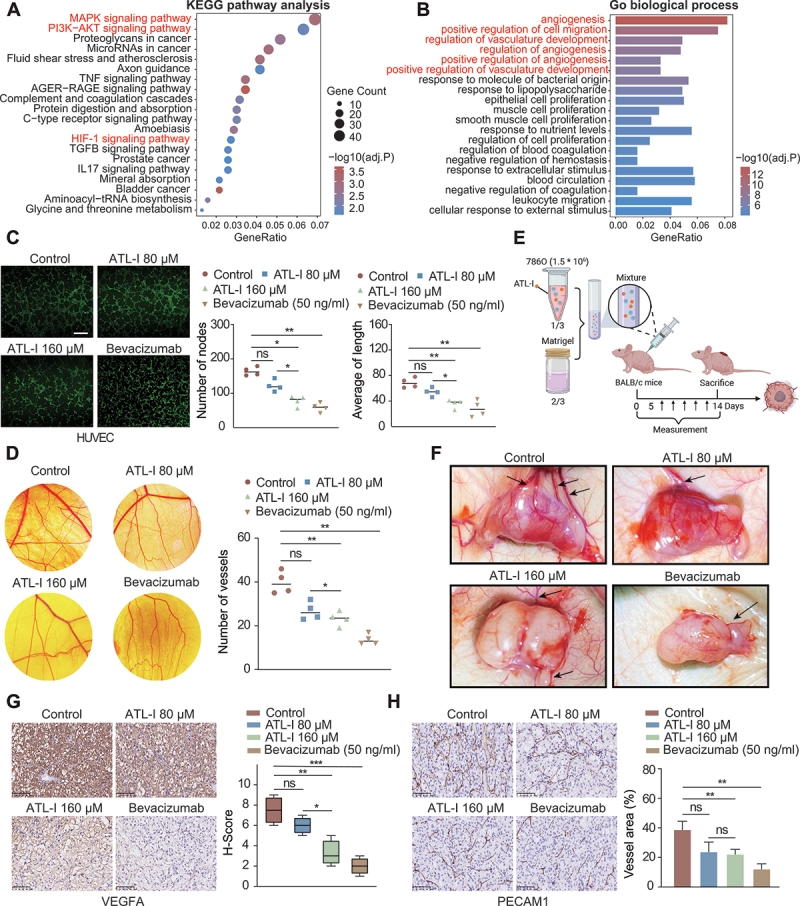
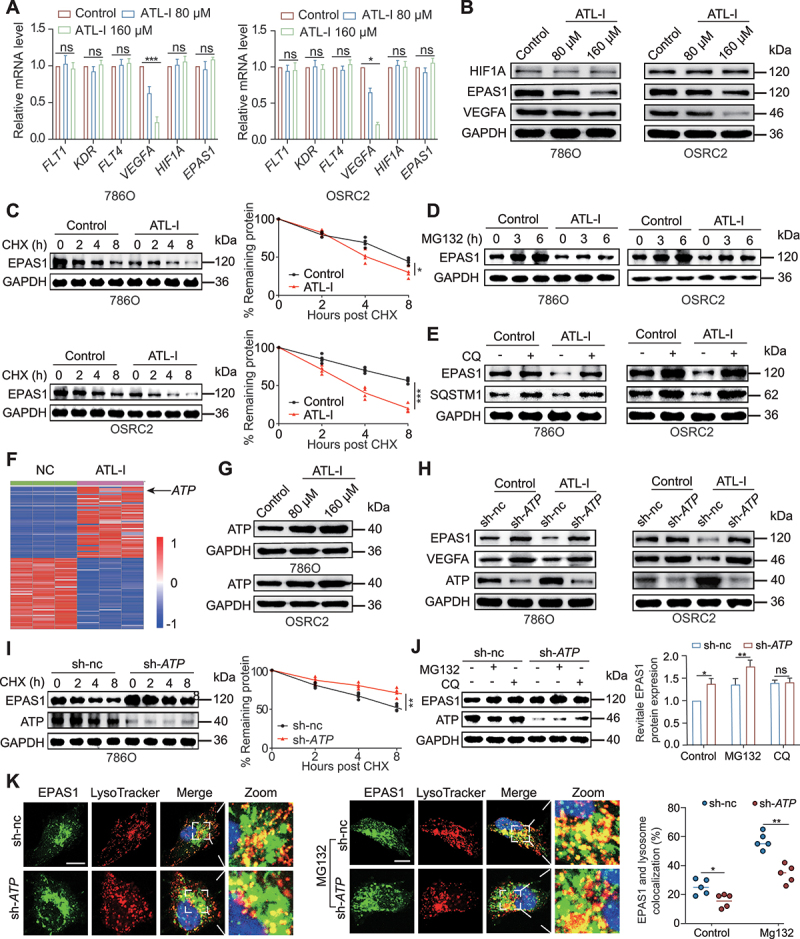
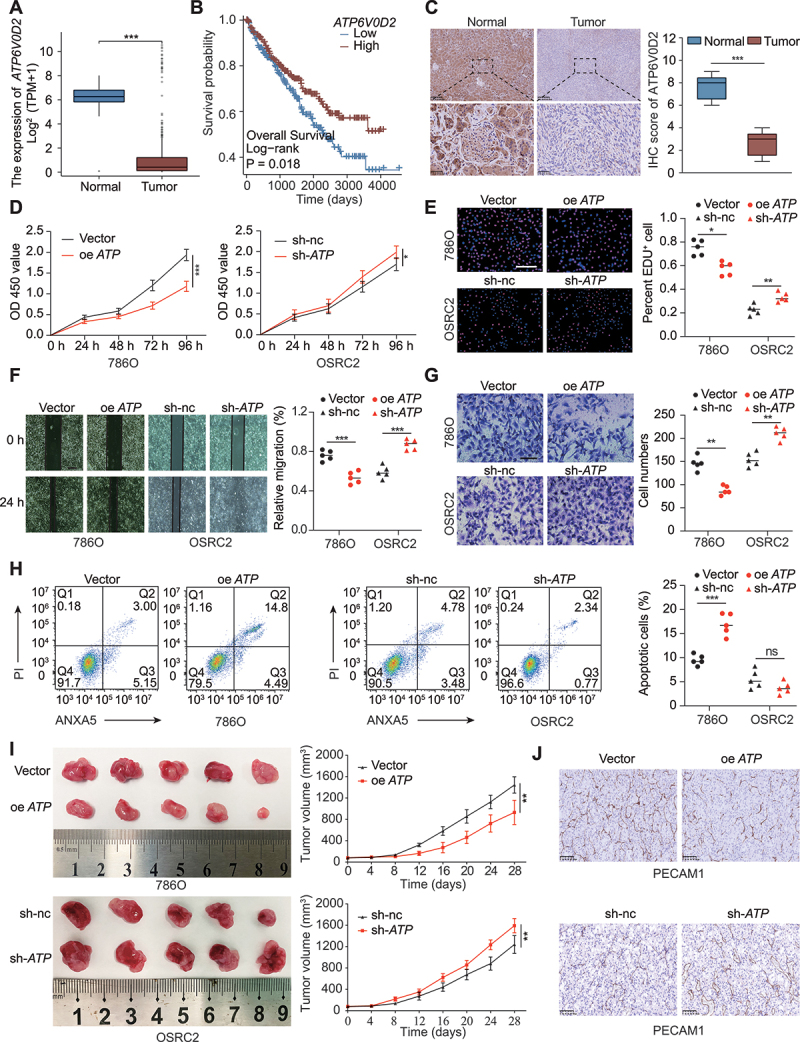
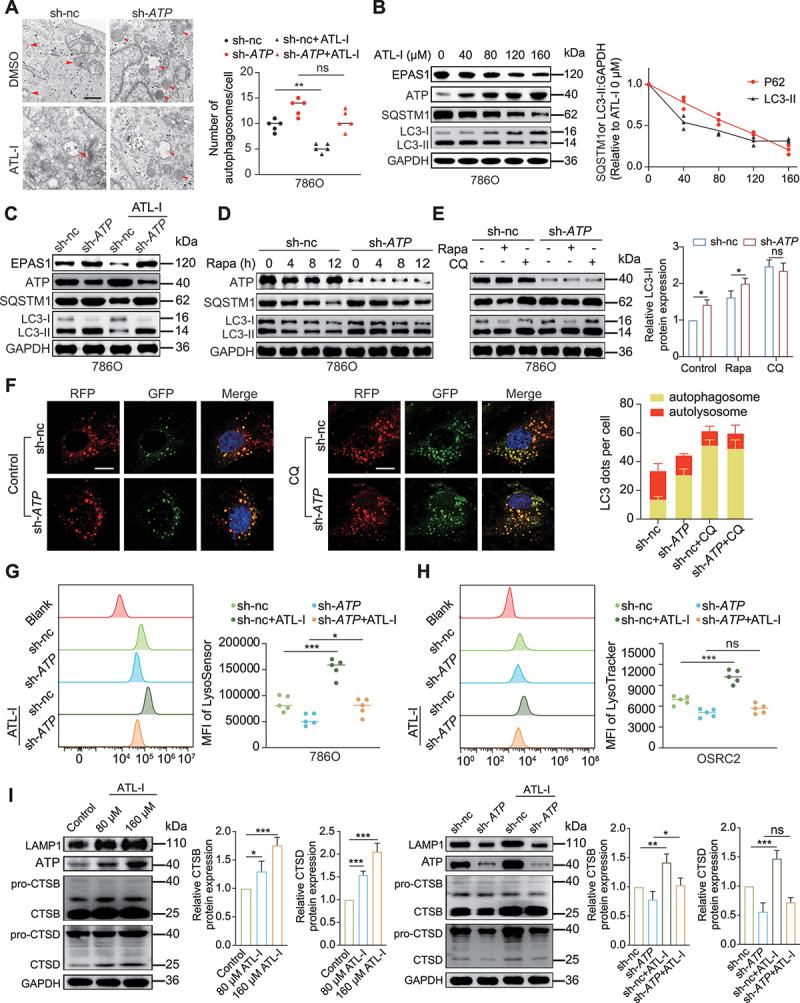
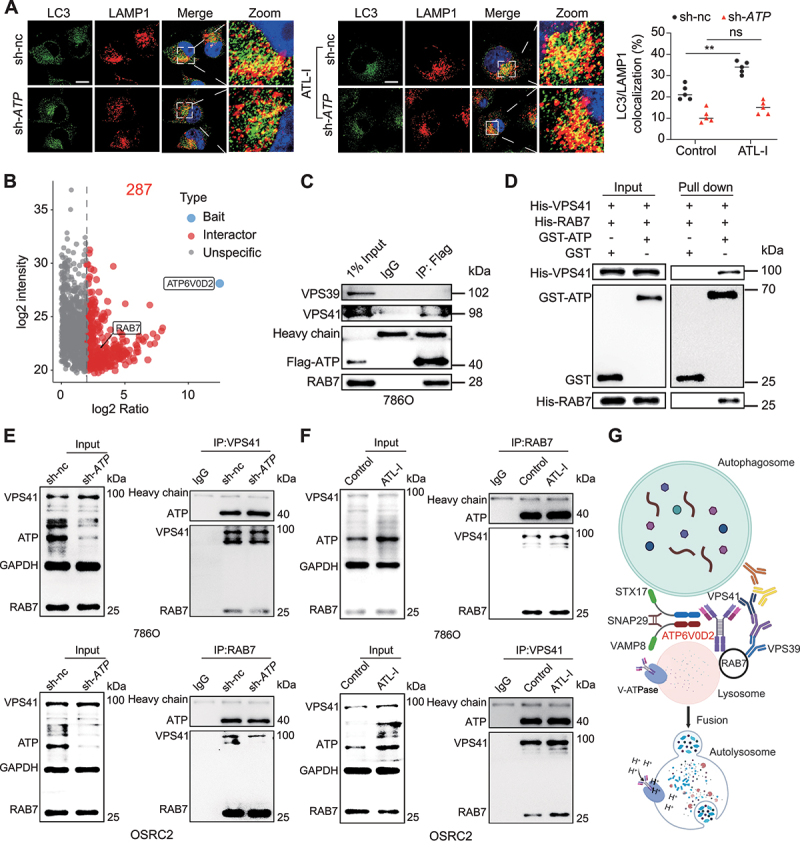
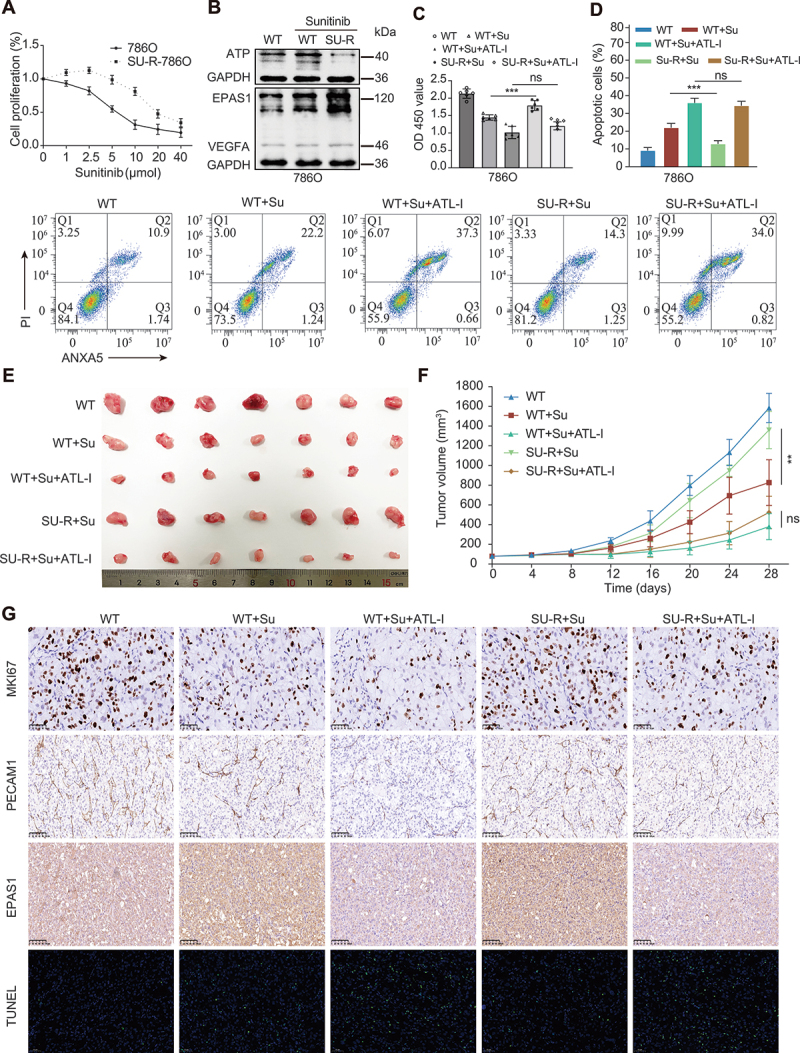
Clear cell renal cell carcinoma (ccRCC) is tightly associated with VHL (von Hippel-Lindau tumor suppressor) mutation and dysregulated angiogenesis. Accumulating evidence indicates that antiangiogenic treatment abolishing tumor angiogenesis can achieve longer disease-free survival in patients with ccRCC. Atractylenolide I (ATL-I) is one of the main active compounds in Atractylodes macrocephala root extract and exhibits various pharmacological effects, including anti-inflammatory and antitumor effects. In this study, we revealed the potent antitumor activity of ATL-I in ccRCC. ATL-I exhibited robust antiangiogenic capacity by inhibiting EPAS1/HIF2α-mediated VEGFA production in VHL-deficient ccRCC, and it promoted autophagic degradation of EPAS1 by upregulating the ATPase subunit ATP6V0D2 (ATPase H+ transporting V0 subunit d2) to increase lysosomal function and facilitated fusion between autophagosomes and lysosomes. Mechanistically, ATP6V0D2 directly bound to RAB7 and VPS41 and promoted the RAB7-HOPS interaction, facilitating SNARE complex assembly and autophagosome-lysosome fusion. Moreover, ATP6V0D2 promoted autolysosome degradation by increasing the acidification and activity of lysosomes during the later stages of macroautophagy/autophagy. Additionally, we found that ATL-I could decrease the level of EPAS1, which was upregulated in sunitinib-resistant cells, thus reversing sunitinib resistance. Collectively, our findings demonstrate that ATL-I is a robust antiangiogenic and antitumor lead compound with potential clinical application for ccRCC therapy.Abbreviations: ATL-I: atractylenolide I; ATP6V0D2: ATPase H+ transporting V0 subunit d2; CAM: chick chorioallantoic membrane; ccRCC: clear cell renal cell carcinoma; CTSB: cathepsin B; CTSD: cathepsin D; GO: Gene Ontology; HIF-1: HIF1A-ARNT heterodimer; HOPS: homotypic fusion and protein sorting; KDR/VEGFR: kinase insert domain receptor; KEGG: Kyoto Encyclopedia of Genes and Genomes; RCC: renal cell carcinoma; SNARE: soluble N-ethylmaleimide-sensitive factor attachment protein receptor; TCGA: The Cancer Genome Atlas; TEM: transmission electron microscopy; TKI: tyrosine kinase inhibitor; V-ATPase: vacuolar-type H±translocating ATPase; VEGF: vascular endothelial growth factor; VHL: von Hippel-Lindau tumor suppressor.

Keywords: ATP6V0D2; Atractylenolide I; HIF2α; autophagic degradation; clear cell renal cell carcinoma.


Conflict of interest statement

No potential conflict of interest was reported by the author(s).

Figures

Figure 1.
Figure 1.
ATL-I inhibits RCC proliferation, invasion, and migration in a dose-dependent manner. (A) chemical structure of ATL-I. (B) after treating HK-2, ACHN, 786O, and OSRC2 cells with various concentrations of ATL-I for 36 h, cell viability in each group was measured using the CCK-8 assay. Dose-response curves were plotted, and half-maximal inhibitory concentrations values were calculated. (C) effect of ATL-I on 786O and OSRC2 cell viability at different time points (0 to 96 h). Scale bar: 100 μm. (D) after treatment with 0, 80, or 160 μM ATL-I for 48 h, cell proliferation was determined by EdU assay. (E) transwell assays were performed to evaluate cell invasion after incubation with 0, 80, or 160 μM ATL-I for 48 h. Scale bar: 50 μm. (F) cells were treated with different concentrations of ATL-I for 24 h, and wound healing assays were performed to evaluate cell migration. Scale bar: 100 μm. (G) changes in EMT markers between the control and ATL-I treatment groups. (*p < 0.05, **p < 0.01, ***p < 0.001.).
Figure 2.
Figure 2.
ATL-I suppresses cell cycle progression and induces apoptosis in ccRCC. (A and B) cell cycle distribution and apoptosis rates were determined by flow cytometry. (C) the expression of PI3K, AKT, p-akt, MTOR, and apoptosis-related markers in the control and ATL-I groups. (D) establishment of an orthotopic xenograft model using wild-type 786O cells, followed by a four-week treatment with ATL-I (50 mg/kg/day, i.P.). Anatomical images of orthotopic xenografts from the two groups. (E) immunohistochemical analysis of MKI67 expression in tumors from the two groups was performed, followed by statistical analysis. Scale bar: 2.5 mm or 100 μm (*p < 0.05, **p < 0.01, ***p < 0.001.).
Figure 3.
Figure 3.
ATL-I inhibits angiogenesis in vitro and in vivo. (A and B) KEGG pathway and GO enrichment analyses of genes differentially expressed upon ATL-I treatment. (C) the effects of ATL-I on vegf-induced tube formation in HUVECs, the number of branch nodes and the length of the tube networks were quantified and compared. Scale bar: 100 μm (D) ATL-I inhibited neo-vascular formation in the CAM assay. (E and F) Representative images of Matrigel plug assays following DMSO or ATL-I treatment. (G) VEGFA IHC staining in control and ATL-I-treated Matrigel plugs. Quantification of vegfa-positive cells. Scale bar: 100 μm. In the present set of experiments, bevacizumab was used as the positive control. (H) PECAM1 IHC staining in control and ATL-I-treated Matrigel plugs. The percent vessel area was quantified and compared. Scale bar: 100 μm. (*p < 0.05, **p < 0.01, ***p < 0.001.).
Figure 4.
Figure 4.
Upregulation of ATP6V0D2 by ATL-I accelerated the autophagic degradation of EPAS1. (A) expression detection of HIF1A, EPAS1, VEGFA, FLT1/VEGFR1, KDR/VEGFR2, and FLT4/VEGFR3 by rt-qPCR in 786O and OSRC2 cells treated with 0, 80, and 160 μM ATL-I for 48 h. (B) Western blot was performed to detect the protein levels of HIF1A, EPAS1 and VEGFA in 786O and OSRC2 cells that were treated with 0, 80, or 160 μM ATL-I for 72 h. (C) 786O and OSRC2 cells were untreated or treated with 80 μM ATL-I for 48 h. After washing with PBS, the cells were incubated with 20 µg/ml cycloheximide and collected at the indicated times. EPAS1 protein levels were determined by western blot. (D) ccRCC cells were untreated or treated with ATL-I for 48 h. Immunoblotting was performed to detect EPAS1 protein levels in the two groups of cells incubated with MG132 (20 μM) for the indicated times. (E) ccRCC cells were untreated or treated with ATL-I for 48 h. Immunoblotting was performed to detect EPAS1 protein levels in the two groups of cells that were not incubated or incubated with chloroquine (10 μM) for 12 h. (F) Heatmap showing the top 50 upregulated and downregulated genes between the control and ATL-I treatment groups. (G) protein levels of ATP6V0D2 in 786O and OSRC2 cells treated with different concentrations of ATL-I. (H) immunoblotting was performed to detect the expression of EPAS1 and VEGFA in sh-nc and sh-ATP6V0D2 ccRCC cells with or without ATL-I treatment. (I) 786O cells with an expression vector or ATP6V0D2 knockdown were treated with 20 µg/ml cycloheximide at the indicated times. EPAS1 and ATP6V0D2 protein levels were determined by immunoblotting. (J) 786O cells with an expression vector or ATP6V0D2 knockdown were treated with 10 μM chloroquine or 20 μM MG132 for 8 h. EPAS1 and ATP6V0D2 protein levels were detected by western blot. (K) 786O cells, expression vector or knockdown of ATP6V0D2, were unincubated or incubated with 20 μM MG132 for 6 h. The cells were stained with anti-EPAS1/HIF2α and LysoTracker. The colocalization of EPAS1 and lysosomes in the cytoplasm was quantified. Scale bar: 10 μm. (*p < 0.05, **p < 0.01, ***p < 0.001.).
Figure 5.
Figure 5.
ATP6V0D2 inhibited RCC proliferation, invasion, and metastasis. (A) Expression of ATP6V0D2 between ccRCC tumor and normal tissues in the TCGA cohort. (B) Differences in overall survival between ATP6V0D2high and ATP6V0D2low patients. (C) IHC analysis of ATP6V0D2 expression in tumor-adjacent tissues and tumor tissues. Scale bar: 50 or 250 μm. (D and E) cell proliferation was assessed using CCK-8 and EdU assays in the vector and oe ATP6V0D2 groups, as well as in the sh-nc and sh-ATP6V0D2 groups. Scale bar: 100 μm. (F and G) cell invasion and migration were evaluated using Transwell invasion and wound healing tests in the vector and oe ATP6V0D2 groups, as well as in the sh-nc and sh-ATP6V0D2 groups. Scale bar: 100 or 50 μm. (H) The percentage of apoptotic cells in the vector, oe ATP6V0D2, sh-nc and sh-ATP6V0D2 groups. (I) Growth rates of xenografts between the vector and oe ATP6V0D2 groups and the sh-nc and sh-ATP6V0D2 groups. (J) IHC staining for PECAM1 in xenografts from the vector, oe ATP6V0D2, sh-nc and sh-ATP6V0D2 groups. Scale bar: 100 μm. (*p < 0.05, **p < 0.01, ***p < 0.001.).
Figure 6.
Figure 6.
ATL-I promotes autophagosome-lysosome membrane fusion and lysosomal function through ATP6V0D2. (A) Autophagosome detection by transmission electron microscopy in sh-nc and sh-ATP6V0D2 cells untreated or treated with 80 µm ATL-I. Scale bar: 0.5 μm. (B) Immunoblot analysis of SQSTM1, LC3-II, ATP6V0D2, and EPAS1 in 786O cells treated with various concentrations of ATL-I. (C) Immunoblot analysis of SQSTM1, LC3-II, ATP6V0D2, and EPAS1 in sh-nc and sh-ATP6V0D2 cells untreated or treated with 80 µm ATL-I. (D) Immunoblot analysis of SQSTM1, LC3-II, and ATP6V0D2 in sh-nc and sh-ATP6V0D2 cells that were either untreated or treated with 50 nM rapamycin at the indicated times. (E) 786O cells with an expression vector or ATP6V0D2 knockdown were treated with 50 nM rapamycin and 10 μM chloroquine for 8 h. SQSTM1, LC3-II, and ATP6V0D2 protein levels were detected by immunoblotting. (F) sh-nc and sh-ATP6V0D2 786O cells that were transduced with RFP-GFP-LC3-expressing lentivirus. Cells were untreated or treated with 10 μM chloroquine for 4 h. Fluorescence analysis of the mean number of RFP and GFP puncta. Scale bar: 10 μm. (G) Lysosomal acidification was evaluated by flow cytometry with LysoSensor staining in sh-nc and sh-ATP6V0D2 cells untreated or treated with 80 µm ATL-I. (H) Lysosomal activity was evaluated by flow cytometry with LysoTracker staining in sh-nc and sh-ATP6V0D2 cells untreated or treated with 80 µm ATL-I. (I) immunoblot analysis of LAMP1, CTSB, and CTSD in 786O cells treated with different concentrations of ATL-I and in sh-nc and sh-ATP6V0D2 cells untreated or treated with 80 µm ATL-I. (*p < 0.05, **p < 0.01, ***p < 0.001.).
Figure 7.
Figure 7.
ATP6V0D2 promotes the RAB7-HOPS interaction and facilitates SNARE complex assembly. (A) colocalization of LC3 with LAMP1 examined by confocal microscopy in sh-nc and sh-ATP6V0D2 cells untreated or treated with 80 µm ATL-I. Scale bar: 10 μm. (B) volcano plot of the mass spectrometry data. Coimmunoprecipitation and mass spectrometry were performed to identify ATP6V0D2-interacting proteins in 786O cells. RAB7 was the candidate among the ATP6V0D2-interacting proteins. (C) 786O cells stably expressing flag-ATP6V0D2 were immunoprecipitated by beads. Samples were immunoblotted for endogenous VPS41, VPS39, and RAB7. (D) GST, GST-ATP6V0D2, his-VPS41, and his-RAB7 were expressed in Rosetta bacteria. The purified proteins were subjected to GST affinity-isolation assays and subsequent western blot analysis. (E) sh-nc and sh-ATP6V0D2 cells were immunoprecipitated with either anti-VPS41 or anti-RAB7. The samples were subjected to western blot and probed with antibodies as indicated. (F) cells were untreated or treated with 80 μM ATL-I for 48 h and immunoprecipitated with either anti-RAB7 or anti-VPS41. The samples were subjected to western blot and probed with antibodies as indicated. (G) scheme illustrating the role of ATP6V0D2 in contributing to autophagosome-lysosome membrane fusion and lysosomal function. (**p < 0.01.).
Figure 8.
Figure 8.
ATL-I enhances sunitinib sensitivity in ccRCC via inhibition of the EPAS1 pathway. (A) wildtype or sunitinib-resistant cells were treated with different concentrations of sunitinib for 48 h, and cell viability was measured by CCK-8 assay. (B) immunoblot analysis of EPAS1, VEGFA, and ATP6V0D2 in the indicated cells treated with or without sunitinib. (C and D) the indicated cells were treated with 5 μM sunitinib alone or in combination with 80 μM ATL-I for 36 h. Cell viability and apoptosis were determined by CCK-8 and flow cytometry assays. (E and F) 786O or SU-R-786O cells (1 × 106) were injected subcutaneously into nude mice. The indicated five groups of mice were either treated with sunitinib (20 mg/kg) alone or treated with ATL-I (50 mg/kg) and sunitinib (20 mg/kg). Then, the mice were sacrificed, and the tumor volume was measured. (G) IHC staining showing the expression levels of MKI67, PECAM1, and EPAS1. Scale bar: 50 or 100 μm; TUNEL assay for cell apoptosis analysis in the five groups. Scale bar: 50 μm. (**p < 0.01, ***p < 0.001.).

Similar articles

Cited by

References

    1. Siegel RL, Miller KD, Fuchs HE, et al. Cancer statistics, 2021. CA A Cancer J Clinicians. 2021. January;71(1):7–33. doi: 10.3322/caac.21654 - DOI - PubMed
    1. Sung H, Ferlay J, Siegel RL, et al. Global cancer statistics 2020: GLOBOCAN estimates of incidence and mortality worldwide for 36 cancers in 185 countries. CA A Cancer J Clinicians. 2021. May;71(3):209–249. doi: 10.3322/caac.21660 - DOI - PubMed
    1. Nerich V, Hugues M, Paillard MJ, et al. Clinical impact of targeted therapies in patients with metastatic clear-cell renal cell carcinoma. Onco Targets Ther. 2014;7:365–374. doi: 10.2147/OTT.S56370 - DOI - PMC - PubMed
    1. Choueiri TK, Kaelin WG.. Targeting the HIF2–VEGF axis in renal cell carcinoma. Nat Med. 2020. October;26(10):1519–1530. doi: 10.1038/s41591-020-1093-z - DOI - PubMed
    1. Jonasch E, Walker CL, Rathmell WK. Clear cell renal cell carcinoma ontogeny and mechanisms of lethality. Nat Rev Nephrol. 2021. April;17(4):245–261. doi: 10.1038/s41581-020-00359-2 - DOI - PMC - PubMed

Publication types

MeSH terms