

Deep learning-based segmentation of kidneys and renal cysts on T2-weighted MRI from patients with autosomal dominant polycystic kidney disease
- PMID: 39477840
- PMCID: PMC11525362
- DOI: 10.1186/s41747-024-00520-7
Deep learning-based segmentation of kidneys and renal cysts on T2-weighted MRI from patients with autosomal dominant polycystic kidney disease
Abstract
Background: Our aim was to train and test a deep learning-based algorithm for automatically segmenting kidneys and renal cysts in patients with autosomal dominant polycystic kidney disease (ADPKD).
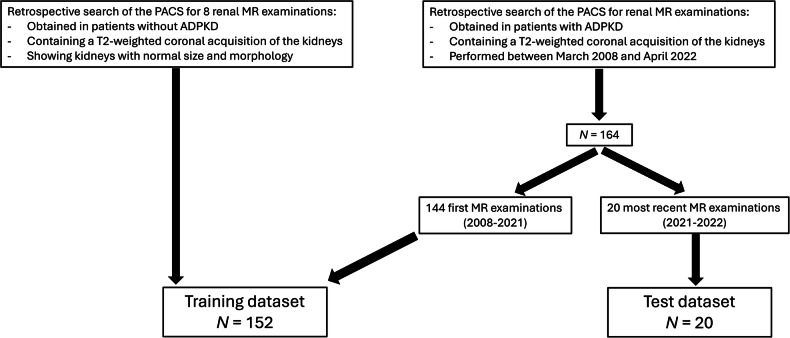
Methods: We retrospectively selected all ADPKD patients who underwent renal MRI with coronal T2-weighted imaging at our institution from 2008 to 2022. The 20 most recent examinations constituted the test dataset, to mimic pseudoprospective enrolment. The remaining ones constituted the training dataset to which eight normal renal MRIs were added. Kidneys and cysts ground truth segmentations were performed on coronal T2-weighted images by a junior radiologist supervised by an experienced radiologist. Kidneys and cysts of the 20 test MRIs were segmented by the algorithm and three independent human raters. Segmentations were compared using overlap metrics. The total kidney volume (TKV), total cystic volume (TCV), and cystic index (TCV divided by TKV) were compared using Bland-Altman analysis.
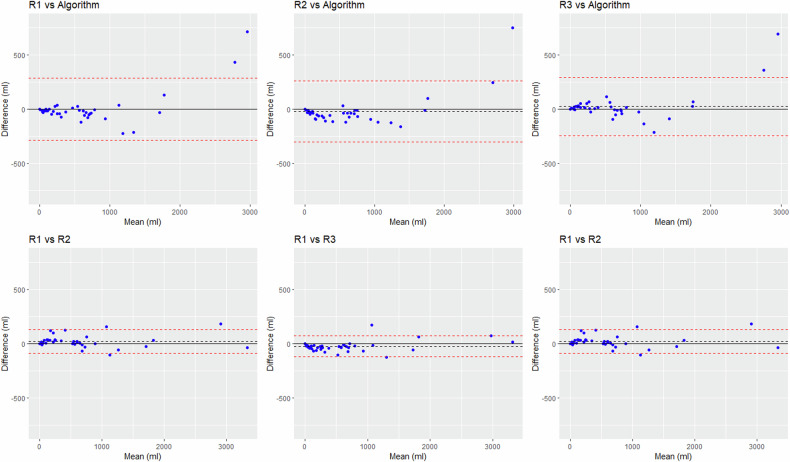
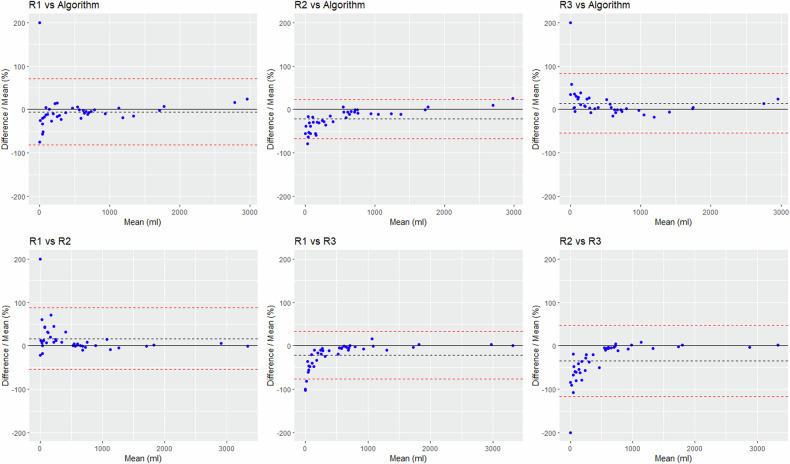
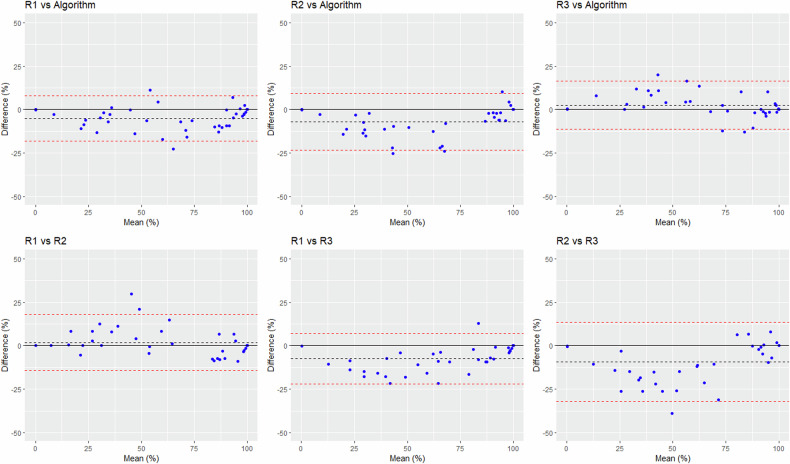
Results: We included 164 ADPKD patients. Dice similarity coefficients ranged from 85.9% to 87.4% between the algorithms and the raters' segmentations and from 84.2% to 86.2% across raters' segmentations. For TCV assessment, the biases ± standard deviations (SD) were 3-19 ± 137-151 mL between the algorithm and the raters, and 22-45 ± 49-57 mL across raters. The algorithm underestimated TKV and TCV in two outliers with TCV > 2800 mL. For cystic index assessment, the biases ± SD were 2.5-6.9% ± 6.7-8.3% between the algorithm and the raters, and 2.1-9.4 ± 7.4-11.6% across raters.
Conclusion: The algorithm's performance fell within the range of inter-rater variability, but large TKV and TCV were underestimated.
Relevance statement: Accurate automated segmentation of the renal cysts will enable the large-scale evaluation of the prognostic value of TCV and cystic index in ADPKD patients. If these biomarkers are prognostic, then automated segmentation will facilitate their use in daily routine.
Key points: Cystic volume is an emerging biomarker in ADPKD. The algorithm's performance in segmenting kidneys and cysts fell within interrater variability. The segmentation of very large cysts, under-represented in the training dataset, needs improvement.
Keywords: Artificial intelligence; Cysts; Image processing (computer-assisted); Magnetic resonance imaging; Polycystic kidney diseases.
© 2024. The Author(s).
Conflict of interest statement
Two co-authors (PC and ASV) were Philips Healthcare employees at the time of the study. No author has a financial conflict of interest regarding the algorithm assessed in this study.
Figures


References
MeSH terms
LinkOut - more resources
Full Text Sources
Medical