. 2024 Oct 30;15(1):9403.
doi: 10.1038/s41467-024-53658-8.

Molecular mimicry as a mechanism of viral immune evasion and autoimmunity

Affiliations

Molecular mimicry as a mechanism of viral immune evasion and autoimmunity

Cole Maguire et al. Nat Commun. .

Abstract

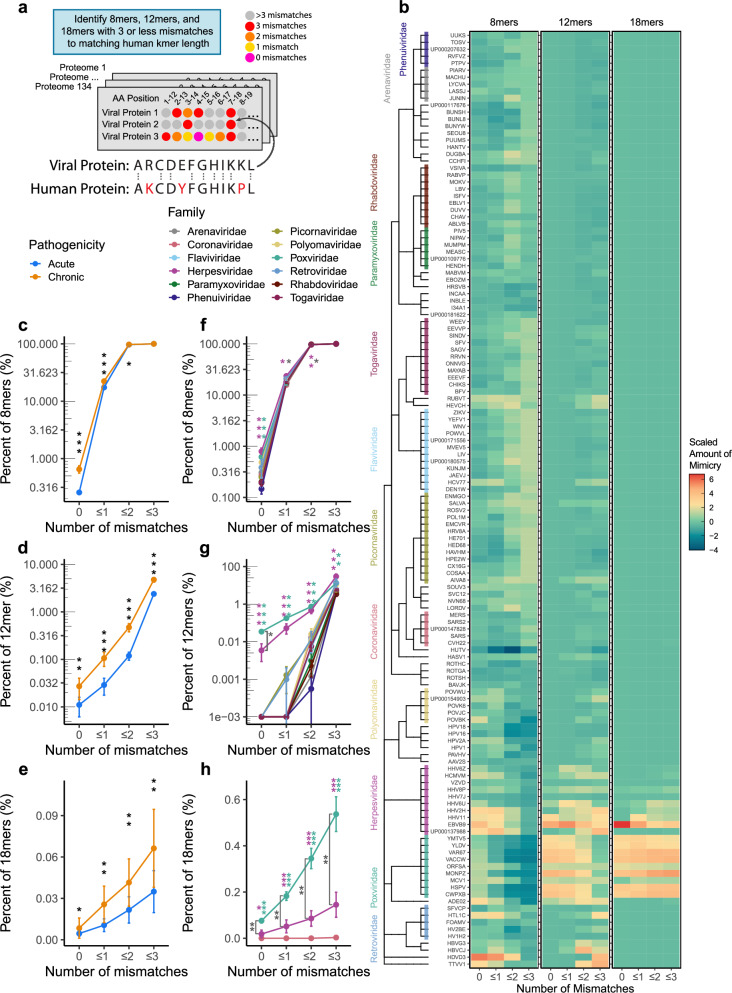
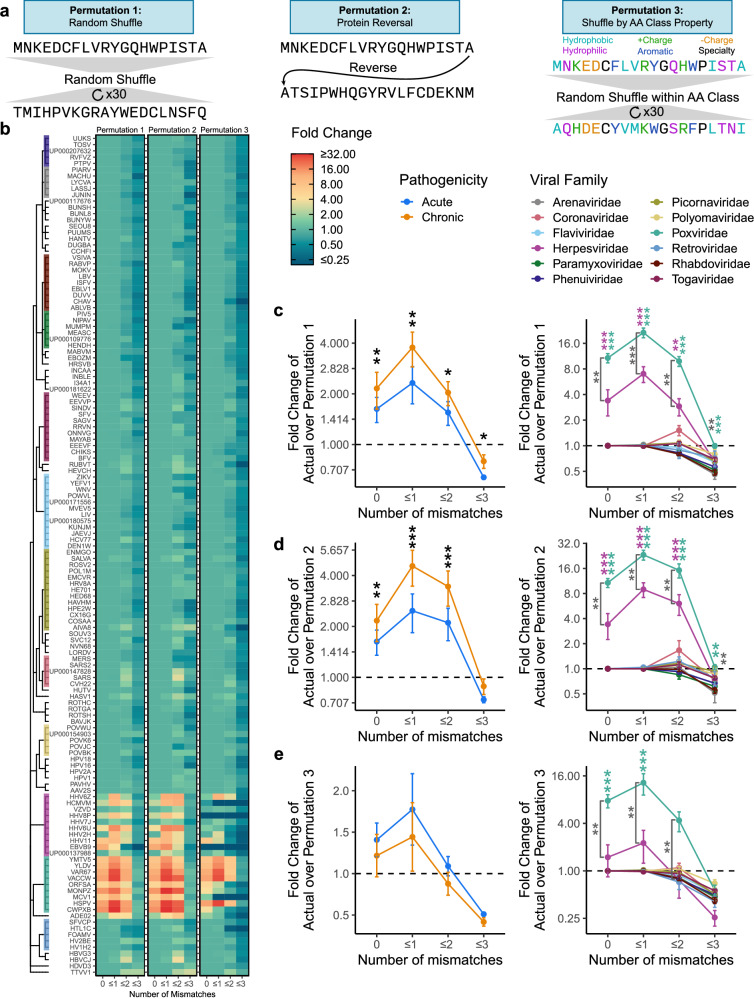
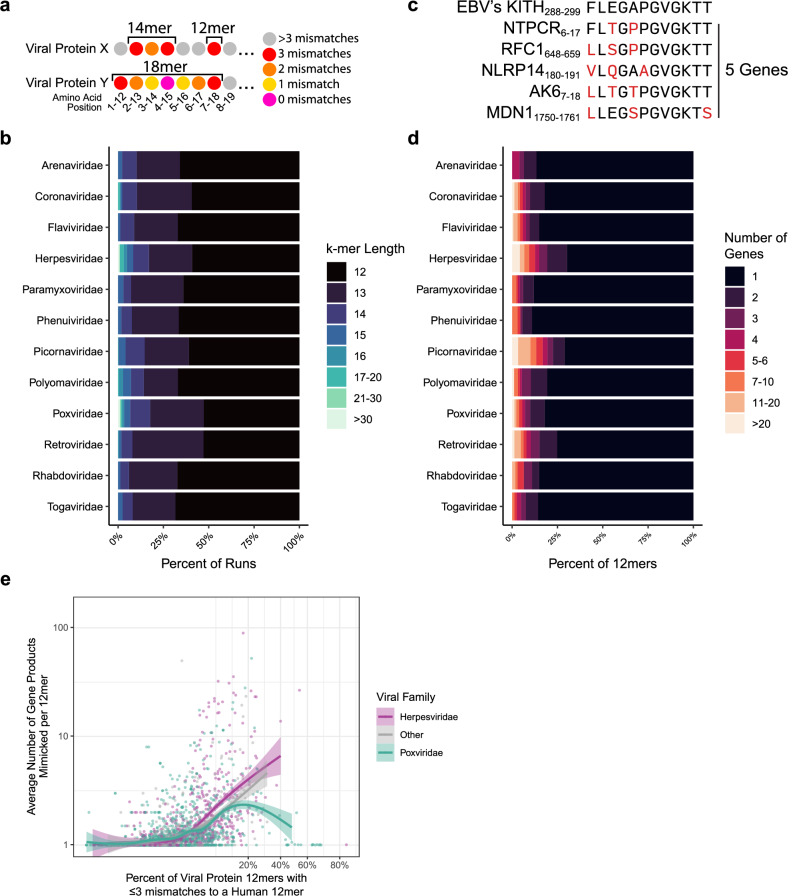
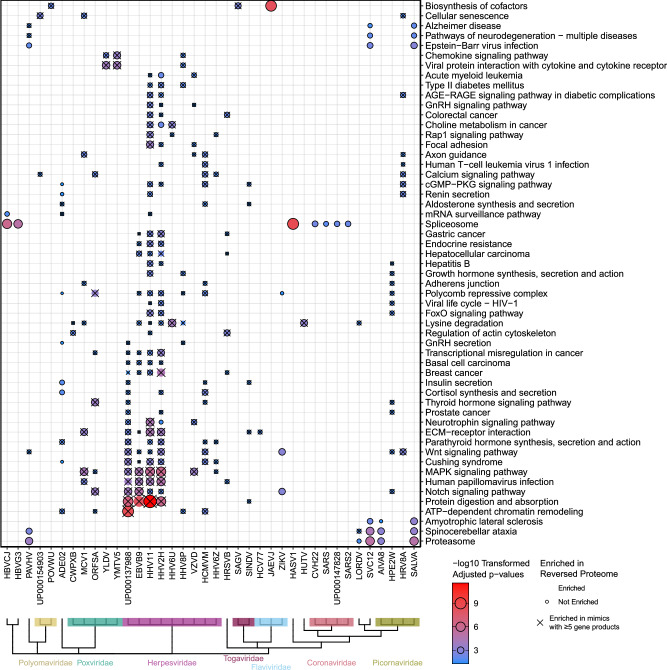
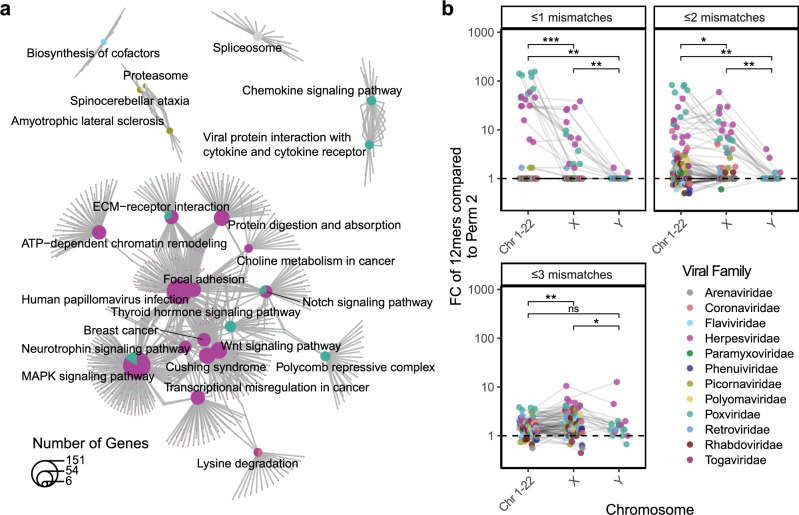
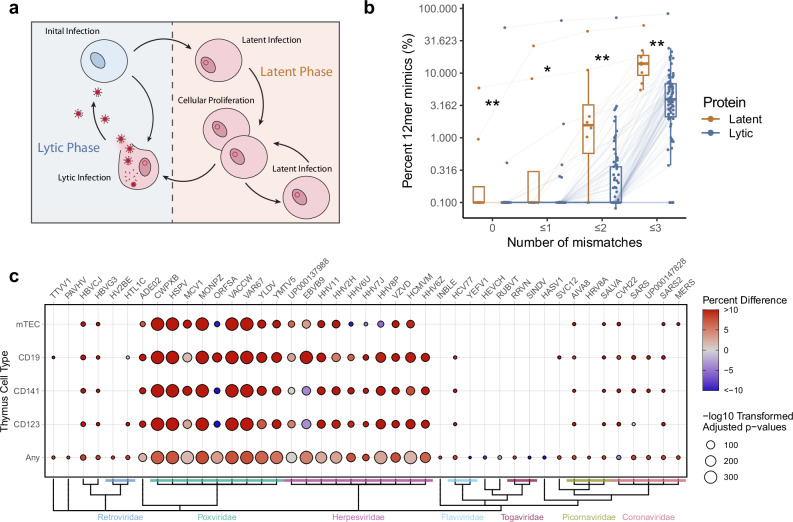
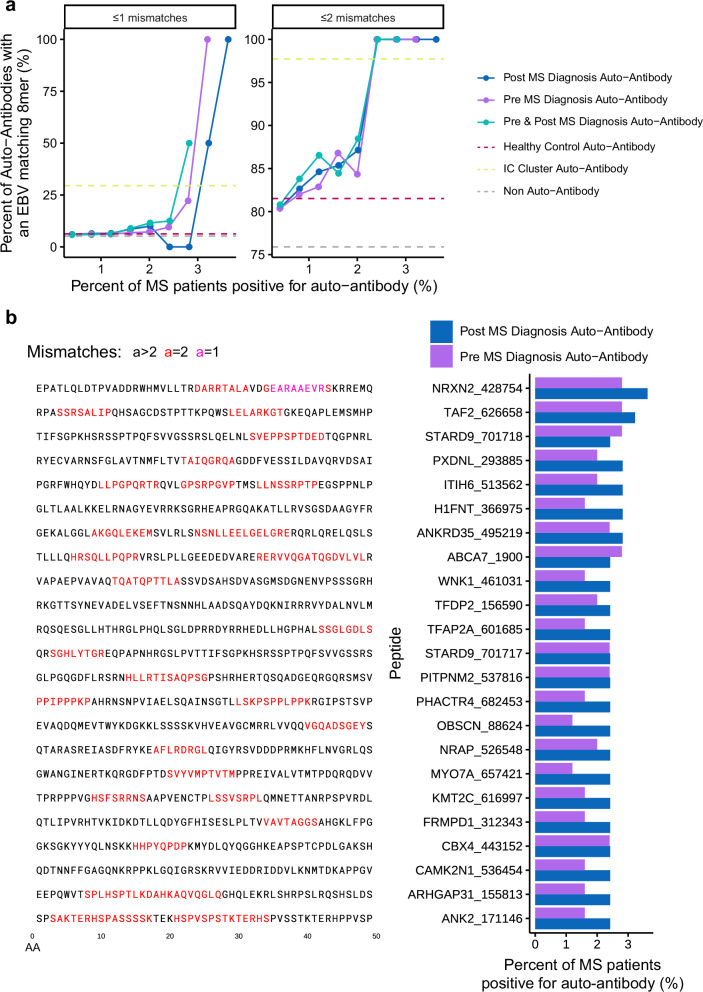
Mimicry of host protein structures, or 'molecular mimicry', is a common mechanism employed by viruses to evade the host's immune system. Short linear amino acid (AA) molecular mimics can elicit cross-reactive antibodies and T cells from the host, but the prevalence of such mimics throughout the human virome has not been fully explored. Here we evaluate 134 human-infecting viruses and find significant usage of linear mimicry across the virome, particularly those in the Herpesviridae and Poxviridae families. Furthermore, host proteins related to cellular replication and inflammation, autosomes, the X chromosome, and thymic cells are enriched as viral mimicry targets. Finally, we find that short linear mimicry from Epstein-Barr virus (EBV) is higher in auto-antibodies found in patients with multiple sclerosis than previously appreciated. Our results thus hint that human-infecting viruses leverage mimicry in the course of their infection, and that such mimicry may contribute to autoimmunity, thereby prompting potential targets for therapies.


Conflict of interest statement

E.M. has received research funding from Babson Diagnostics, honorarium from Multiple Sclerosis Association of America and has served on advisory boards of Genentech, Horizon, Teva and Viela Bio. The other authors declare no competing interests.

Figures

Fig. 1
Fig. 1. Molecular mimicry across human infecting viruses.
a Experimental Schema and example of 12mer AA proteomic alignment. In total, 134 human-infecting viral proteomes were screened to identify 8mer, 12mer, and 18mer AA k-mers with 3 or less mismatches to a matching human k-mer. b Heatmap of scaled percentages of mimicry for 8mers, 12mers, and 18mers with 3 or less mismatches, with viruses aligned by taxonomy. Percents of k-mers, were scaled separately for each mismatch and k-mer length combination. Percentage of viral c 8mers, d 12mers, and e 18mers with 0, ≤1, ≤2, and ≤3 mismatches between acute and chronically infecting viruses. Percentage of viral f 8mers, g 12mers, and h 18mers with 0, ≤1, ≤2, and ≤3 mismatches between different viral families. Viral families only shown in (fh) if containing at least 5 species. For ch black stars indicate comparisons between chronic and acute viruses, magenta and green stars indicate comparisons of the Herpesviruses and Poxviruses against all other viruses, dark gray stars indicate comparison between Herpesviruses and Poxviruses. Kruskal–Wallis test was used for multigroup comparison, and Wilcoxon rank-sum test (two-sided) for pairwise comparison. Error bars denote mean ± standard error of the mean. All p values adjusted for multiple hypothesis testing using Benjamini-Hochberg corrections (*p.adj ≤0.05, **p.adj ≤0.01, ***p.adj ≤0.001). For ce chronic viruses n = 25 and acute viruses n = 103, and for fh Arenaviridae n = 5, Coronaviridae n = 5, Flaviviridae n = 12, Herpesviridae n = 10, Paramyxoviridae n = X, Phenuiviridae n = 5, Picornaviridae n = 13, Polyomaviridae n = 5, Poxviridae n = 9, Retroviridae n = 5, Rhabdoviridae n = 9, Togaviridae n = 11. Source data are provided as a Source Data file.
Fig. 2
Fig. 2. Permutation confirms significant mimicry in poxviruses and herpesviruses.
a Example schema of the three permutation strategies (random, protein reversal, AA class shuffle). b A heatmap of the fold change of actual mimicry over mimicry in permutations 1–3, aligned by viral taxonomy. Results of the c random permutation (permutation 1), d protein reversal permutation (permutation 2), and e AA class shuffle permutation (permutation 3) for chronic vs. acute viruses and by viral family. Viral families only shown in (ce) if containing at least 5 species. (Black stars indicate comparisons between chronic and acute viruses, magenta and green stars indicate comparisons of the Herpesviruses and Poxviruses against all other viruses respectively, dark gray stars indicate comparison between Herpesviruses and Poxviruses. Kruskal–Wallis test was used for multigroup comparison, and Wilcoxon rank-sum test (two-sided) for pairwise comparison. Error bars denote mean ± standard error of the mean. All p values adjusted for multiple hypothesis testing using Benjamini–Hochberg corrections (*p.adj ≤0.05, **p.adj ≤0.01, ***p.adj ≤0.001)). For ce chronic viruses n = 25 and acute viruses n = 103, Arenaviridae n = 5, Coronaviridae n = 5, Flaviviridae n = 12, Herpesviridae n = 10, Paramyxoviridae n = X, Phenuiviridae n = 5, Picornaviridae n = 13, Polyomaviridae n = 5, Poxviridae n = 9, Retroviridae n = 5, Rhabdoviridae n = 9, Togaviridae n = 11. Source data are provided as a Source Data file.
Fig. 3
Fig. 3. Viral mimicry is diverse in length and differentially targets human protein motifs.
a An example of an 18mer and 14mer comprised of 12mers. b Average percent of mimics at varying k-mer lengths. c An example of multi-mapping in which a single viral 12mer aligns to multiple human proteins with the criteria of 3 or less mismatches. d Percent of viral 12mers and their corresponding number of mimicked human genes (multi-mapping). e Average number of host gene products mimicked, plotted against the percent of the viral protein that participates in mimicry (defined as a 12mer with 3 or less mismatches). Trendlines represent fit and 95% confidence interval from a generalized additive model. Source data are provided as a Source Data file.
Fig. 4
Fig. 4. Viral mimicry is concentrated towards proteins from key human biological pathways and leverages mimicry of common motifs.
Hypergeometric enrichment testing of KEGG pathways for human proteins that are mimicked by each virus. Significant enrichment is displayed as a dot if the adjusted p.value ≤ 0.05 (calculated using Benjamini–Hochberg correction) and is outlined if that biological enrichment was not observed in the reverse proteome permutation (permutation 2). Only pathways significant in at least 3 viruses are shown, with all viruses and significant pathways shown in Supplementary Fig. 4.
Fig. 5
Fig. 5. Viral mimicry targets critical cellular pathways of cellular replication and inflammation and avoids proteins from the Y chromosome.
a Shared overlap between the significant pathway from Fig. 4 reveal broad roles of inflammation and cellular replication amongst the pathways. Pathways and genes are represented by a pie chart, colored by the proportion of viruses belonging to each family that were significantly enriched for the pathway, with lines connecting genes to their respective pathways. b Fold change of the percent of mimics whose human counterpart is encoded on either an autosome (Chromosomes 1-22), X, or Y chromosome over the rate in the reversed proteome (permutation 2). For b, the Wilcoxon summed-rank test (two-sided) was used for paired pairwise comparison. All p values adjusted for multiple hypothesis testing using Benjamini–Hochberg corrections (*p.adj ≤0.05, **p.adj ≤0.01, ***p.adj ≤0.001). Source data are provided as a Source Data file.
Fig. 6
Fig. 6. EBV latent proteins have elevated mimicry and viral mimicry targets negatively selected proteins.
a Schematic of latent vs. lytic stages of viral replication. b Percent of 12mers with 0, ≤1, ≤2, and ≤3 mismatches in latent and lytic EBV proteins. Each point denotes a single EBV protein connected across the mismatch levels with boxplots denoting the median as the midline, the bounds of the box defining the 25th and 75th percentile, and the whiskers denoting the 1.5 times the interquartile range. For comparison of latent vs. lytic genes in (b), the Wilcoxon summed-rank test was used with Benjamini–Hochberg corrections (*p.adj ≤0.05 and **p.adj ≤0.01). For b latent genes n = 8 and lytic genes n = 84. c Percent difference of mimics expressed in mTEC, CD19+ B cells, CD141+ dendritic cells, CD123+ dendritic cells, or “any” of these cells in the human thymus (all antigen presenting cells), compared to the percentage of all human genes expressed by the cell type (as determined by RNA expression in Gabrielsen et al.). Adjusted p value calculated using fisher exact test (two-sided) with Benjamini–Hochberg corrections. Source data are provided as a Source Data file.
Fig. 7
Fig. 7. EBV mimics are more frequent in MS auto-antibodies.
a Frequency of EBV mimicry (defined as EBV 8mers with ≤1 (left) or ≤2 mismatches (right)) in autoantibody targets in MS patients pre and post diagnosis. Dotted lines show the rate of peptides with an EBV mimic for auto-antibodies found in either in no participant, in healthy controls, or in the previously identified IC Cluster (Zamecnik et al.). b Left: Peptide sequences of the top non-IC Cluster and most frequent post MS diagnosis auto-antibodies. Right: Percentage of MS patients positive for the top non-IC Cluster auto-antibodies at both the pre and post diagnosis timepoints. Source data are provided as a Source Data file.

Update of

Similar articles

Cited by

References

    1. Tortorella, D., Gewurz, B. E., Furman, M. H., Schust, D. J. & Ploegh, H. L. Viral subversion of the immune system. Annu. Rev. Immunol.18, 861–926 (2000). - PubMed
    1. Gowthaman, U. & Eswarakumar, V. P. Molecular mimicry. Virulence4, 433–434 (2013). - PMC - PubMed
    1. Chen, J. W. et al. Positive and negative selection shape the human naive B cell repertoire. J. Clin. Invest.132, e150985 (2022). - PMC - PubMed
    1. Palmer, E. Negative selection-clearing out the bad apples from the T cell repertoire. Nat. Rev. Immunol.3, 383–391 (2003). - PubMed
    1. Cusick, M. F., Libbey, J. E. & Fujinami, R. S. Molecular mimicry as a mechanism of autoimmune disease. Clin. Rev. Allergy Immunol.42, 102–111 (2012). - PMC - PubMed

Publication types

LinkOut - more resources