. 2024 Oct 30;15(1):9402.
doi: 10.1038/s41467-024-53535-4.

Single-cell landscape of innate and acquired drug resistance in acute myeloid leukemia

Collaborators, Affiliations

Single-cell landscape of innate and acquired drug resistance in acute myeloid leukemia

Rebekka Wegmann et al. Nat Commun. .

Abstract

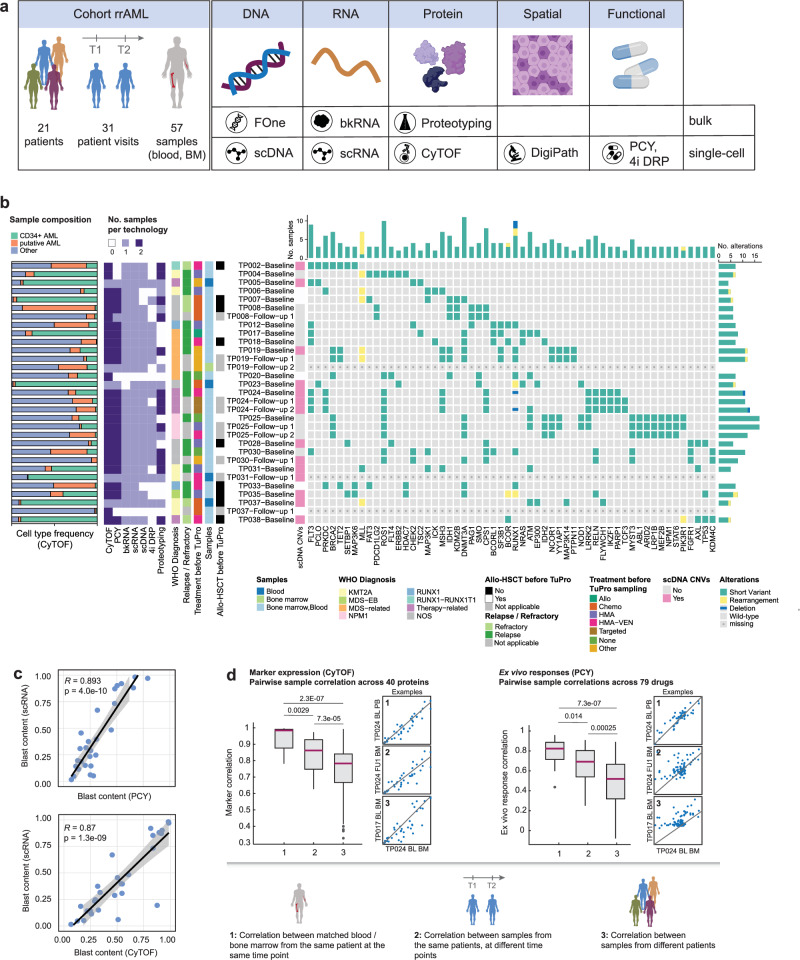
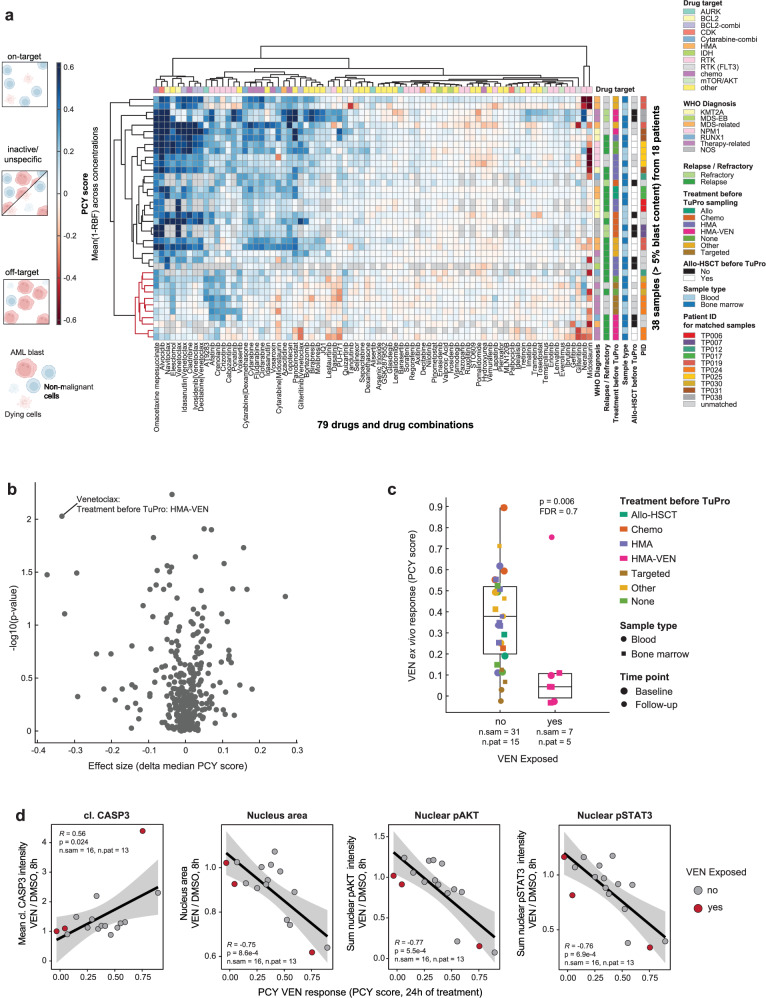
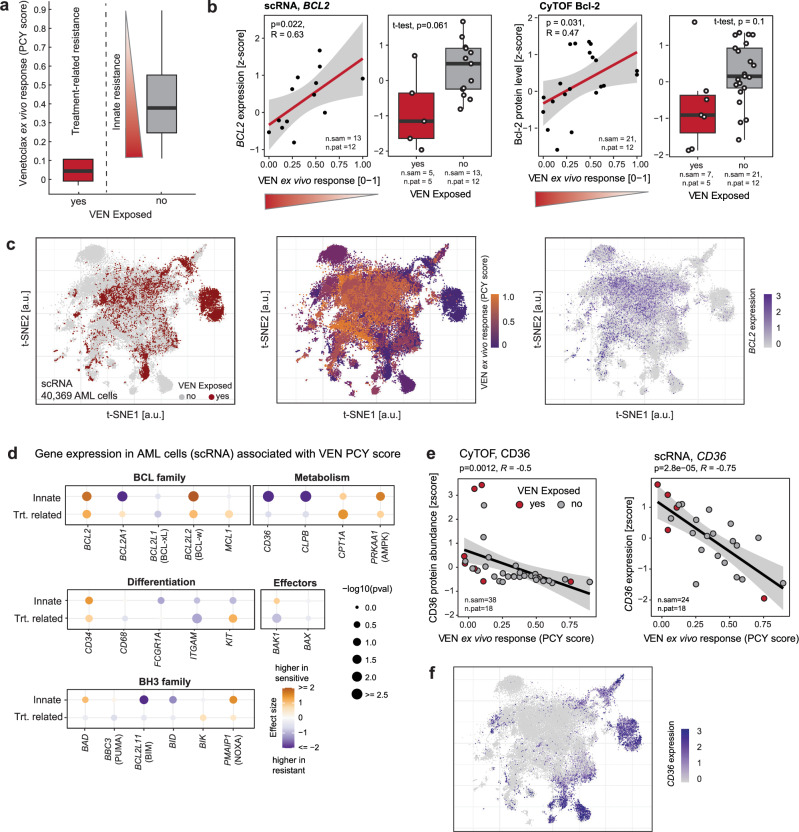
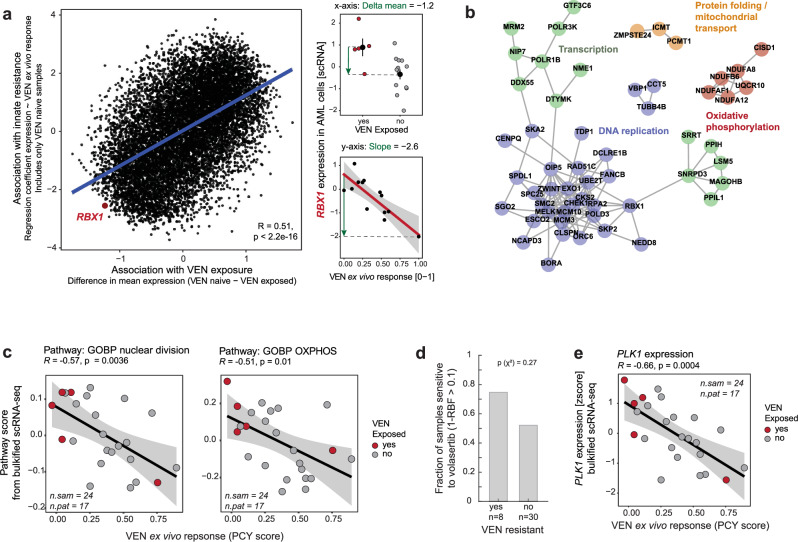
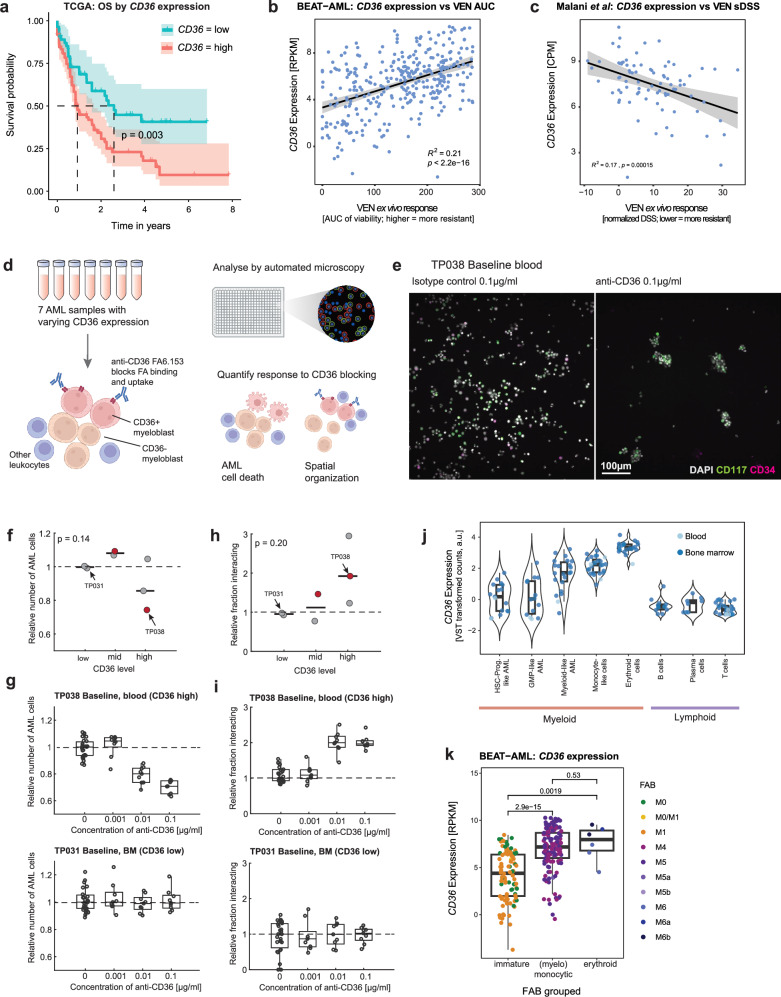
Deep single-cell multi-omic profiling offers a promising approach to understand and overcome drug resistance in relapsed or refractory (rr) acute myeloid leukemia (AML). Here, we combine single-cell ex vivo drug profiling (pharmacoscopy) with single-cell and bulk DNA, RNA, and protein analyses, alongside clinical data from 21 rrAML patients. Unsupervised data integration reveals reduced ex vivo response to the Bcl-2 inhibitor venetoclax (VEN) in patients treated with both a hypomethylating agent (HMA) and VEN, compared to those pre-exposed to chemotherapy or HMA alone. Integrative analysis identifies both known and unreported mechanisms of innate and treatment-related VEN resistance and suggests alternative treatments, like targeting increased proliferation with the PLK inhibitor volasertib. Additionally, high CD36 expression in VEN-resistant blasts associates with sensitivity to CD36-targeted antibody treatment ex vivo. This study demonstrates how single-cell multi-omic profiling can uncover drug resistance mechanisms and treatment vulnerabilities, providing a valuable resource for future AML research.


Conflict of interest statement

B.B. has founded and is a shareholder and member of the board of Navignostics, a precision oncology spin-off from the University of Zurich. B.B. reports personal consultancy fees as Advisory board member from Standard BioTools. B.S. was a scientific co-founder of Allcyte, which has been acquired by Exscientia. B.S. is a shareholder of Exscientia and a co-inventor on US patent application 15/514,045 relevant to the study. L.P. and G.G. are listed as inventors on patents related to the 4i technology (WO 2019/207004; WO 2020/008071). G.R. is listed on a patent application related to single-cell analyses (European Patent Application No. 20170724.7), and G.R. is cofounder and on the Scientific Advisory Board of Computomics GmbH. H.M. is on advisory boards for Bayer, Astra Zeneca, Janssen, Roche, and Merck. M.P.L. is scientific advisor and board member of Oncobit and has received unrelated research funding from Roche, Novartis, Scailyte, Molecular Partners, and Bacoba. V.H.K. is an invited speaker for Sharing Progress in Cancer Care (SPCC) and Indica Labs; advisory board of Takeda; sponsored research agreements with Roche and IAG all unrelated to the current study; listed as innovator on patent applications in computational pathology. The Tumor Profiler study is jointly funded by a public-private partnership involving F. Hoffmann-La Roche Ltd., ETH Zurich, University of Zurich, University Hospital Zurich, and University Hospital Basel. The remaining authors declare no competing interests.

Figures

Fig. 1
Fig. 1. Single-cell molecular and functional profiling of AML samples.
a Schematic workflow illustrating the types of analyses performed in this study. b Cohort overview. From left to right: Barplot depicting the sample composition (bone marrow; peripheral blood if bone marrow was not sampled) measured by CyTOF; the number of samples measured per technology and patient visit; clinical data; whether there were any copy number variations (CNVs) detected by scDNA; alterations measured by the FoundationOne Heme panel. Patients were diagnosed according to the WHO 2016 classification (WHO Diagnosis). NOS Not otherwise specified; MDS-EB myelodysplastic syndrome with excess of blasts; Mutated genes are indicated. c Correlation of blast fractions measured by scRNA-seq with those measured by PCY (top, n = 25 samples from 18 patients) and CyTOF (bottom, n = 27 samples from 20 patients). Pearson’s R and corresponding P values (two-sided t-test) are indicated. Lines and shaded area represent a linear regression fit and 95% confidence bands, respectively. d Correlation (Spearman) of molecular (CyTOF marker expression across 40 proteins, left) and functional (PCY ex vivo responses across 79 drugs, right) profiles between 1) pairs of matched blood/bone marrow samples from the same patient taken at the same visit (CyTOF n = 15; PCY n = 14), 2) pairs of samples from the same patient taken at different visits (CyTOF n = 26; PCY n = 26), 3) pairs of samples from different patients (CyTOF n = 820; PCY n = 663). Only samples with > 5% blast content by pathology are included in this analysis. Small scatterplots show an example pairwise comparison for each category, lines from linear regression. P values from two-sided, two-sample Wilcoxon test. Box plots indicate the median (horizontal line) and 25% and 75% ranges (box) and whiskers indicate the 1.5x interquartile range above or below the box. Outliers beyond this range are shown as individual data points. Abbreviations: T1, T2 Time point of sampling 1/2; FOne FoundationOne Heme; scDNA single-cell DNA-seq; bkRNA bulk RNA-seq; scRNA single-cell RNA-seq; CyTOF cytometry by time-of-flight; IMC imaging mass cytometry; PCY pharmacoscopy; 4i DRP iterative indirect immunofluorescence imaging drug response profiling; HMA hypomethylating agent; VEN venetoclax.
Fig. 2
Fig. 2. The ex vivo drug response landscape of rrAML.
a Heatmap showing the PCY-based ex vivo responses (PCY scores) of 38 rrAML samples with blast content >5% by pathology to 79 drugs and drug combinations. Relative blast fraction (RBF) is the fraction of AML cells after 24 h of drug treatment relative to the mean fraction of AML cells after 24 h of control treatment. PCY score represents aggregated 1-RBF values across replicate wells and drug concentrations (see Methods). Thus, positive values indicate on-target reduction in AML cells. Samples and drugs are ordered by hierarchical clustering (Euclidean distance, complete linkage), a cluster of samples characterized by ex vivo resistance to common AML treatments is highlighted in red. b Volcano plot showing associations of PCY scores with clinical parameters shown in (a), for clinical characteristics with at least 5 patient observations (for exact sample- and patient numbers per comparison, see Source Data). X-axis corresponds to effect size (delta median(1-RBF)), y-axis represents −log10 uncorrected P value from two-sided two-sample Wilcoxon test. Labels correspond to “drug - clinical parameter name: clinical parameter value”. c Venetoclax (VEN) PCY scores stratified by whether or not a patient was exposed to VEN right before or at the time of sampling. P value as in (b). Box plots indicate the median (horizontal line) and 25% and 75% ranges (box), whiskers indicate the 1.5x interquartile range above or below the box, individual data points are displayed. d Selected 4i DRP features after 8 h of VEN ex vivo treatment normalized to control treatment, associated with VEN PCY score. Linear regression line with 95% confidence bands, corresponding Pearson’s R and P value (two-sided t-test) are indicated. Number of samples (n.sam) and number of patients (n.pat) are annotated for each panel.
Fig. 3
Fig. 3. The molecular landscape of innate and treatment-related VEN resistance.
a Definition of innate and treatment-related VEN resistance. Shown are VEN PCY scores for samples exposed to VEN at the time of sampling (treatment-related resistance, n = 7 samples from 5 patients) and VEN naive samples (n = 21 samples from 12 patients). Within the VEN naive samples, the spread of response scores defines the amount of innate resistance, with lower response scores indicating higher resistance. b RNA and protein levels of the VEN target Bcl-2 measured by scRNA-seq and CyTOF, averaged across all AML blasts per sample. Scatterplots show Bcl-2 levels as a function of innate resistance in VEN naive samples. Linear regression lines with 95% confidence bands, Pearson’s R, and corresponding P values (two-sided t-test) are indicated. Box plots compare Bcl-2 levels between VEN naive and exposed samples, P values from two-tailed Welch’s t-test. c t-SNE of scRNA-seq data, showing only cells classified as AML (n = 40’369 cells, 24 samples, 18 patients). Left: colored by prior VEN exposure, middle: colored by PCY-based VEN ex vivo response, right: colored by BCL2 expression. d Association of known genes involved in VEN resistance with innate or treatment-related VEN resistance. Values are derived from bulkified scRNA-seq AML cell transcriptomes. For treatment-related resistance, effect size corresponds to the delta mean gene expression between samples from patients that were or were not exposed to venetoclax, and P value was calculated using a two-sided Welch’s t-test. For innate resistance, the effect size and P value are obtained from a linear regression modeling gene expression as a function of VEN PCY score (see (a, b)). e Protein (left) and RNA (right) levels of CD36 as a function of VEN PCY score. Linear regression lines with 95% confidence bands, Pearson’s R, and corresponding P values (two-sided t-test) are indicated. f t-SNE as in (c), colored by expression of CD36. All analyses presented here were performed on samples with >5% blast content. In (a, b, and d), samples from patients who received venetoclax in earlier previous treatment lines were excluded. Number of samples (n.sam) and number of patients (n.pat) are annotated. Box plots indicate the median (horizontal line) and 25% and 75% ranges (box) and whiskers indicate the 1.5x interquartile range above or below the box.
Fig. 4
Fig. 4. Global association between transcriptomics and VEN resistance.
a Comparison of associations between gene expression (bulkified scRNA-seq in AML cells) with innate and treatment-related VEN resistance, respectively. The x-axis corresponds to the delta mean gene expression between samples from patients that were or were not exposed to venetoclax at the time of sampling (exposed: n = 5 samples from 5 patients, naïve: n = 13 samples from 12 patients). The y-axis corresponds to the slope of a linear regression modeling gene expression as a function of venetoclax ex vivo response (PCY score) in samples from VEN- naïve patients. The RBX1 gene is highlighted and example plots are shown on the right. Small dots represent individual samples, large dots and lines in the top panel represent the mean and SEM. b STRING interaction network of the top 100 genes whose expression was inversely correlated with VEN PCY scores. Only clusters containing at least 3 genes are shown. c Correlation of VEN PCY scores with pathway activation scores (singscore, see Methods) for the two most significantly enriched pathways among genes associated with VEN resistance, nuclear division (GO:0000280) and oxidative phosphorylation (GO:0006119). d Fractions of samples that are sensitive to volasertib, grouped according to VEN sensitivity. P value from a two-sided Chi-squared test of independence. e Correlation of PCY-based VEN ex vivo response and the expression of PLK1 (bulkified scRNA-seq in AML cells). Linear regression lines with 95% confidence bands, Pearson’s R and P values (two-sided t-test) are indicated in (a, c, and e). All analyses presented here were performed on samples with >5% blast content. In (a and b), samples from patients who received venetoclax in earlier previous treatment lines were excluded. Number of samples (n.sam) and number of patients (n.pat) are annotated.
Fig. 5
Fig. 5. Targeting CD36 in VEN resistant patient samples.
a Kaplan-Meier curve for patients in the TCGA-LAML cohort, stratified by CD36 expression level (bulk RNA-seq). P value from a log-rank test is indicated. CD36 high n = 85, CD36 low n = 55 patients. Lines indicate the Kaplan-Meier survival probability estimate, shaded areas correspond to the 95% confidence interval and tick marks represent censored events. b Association of CD36 expression (bulk RNA-seq) and VEN ex vivo response (Area under the curve (AUC), bulk viability assay, higher values indicate increased resistance) in the BEAT-AML cohort,. Data from n = 386 patients. c Association of CD36 expression (bulk RNA-seq) and venetoclax ex vivo response (selective drug sensitivity score, sDSS) from n = 82 patients presented in Malani et al.. d Schematic illustrating the CD36 blocking experiment performed here. e Example images showing cells from the CD36 high TP038 baseline blood sample after exposure to isotype control (left) or anti-CD36 (right). Image represents a total of 225 images taken across 9 technical replicate wells, and three CD36-high samples (biological replicates). f Number of AML cells after 24 h of incubation with anti-CD36 relative to isotype control, stratified by CD36 level. g Dose-response curves showing the reduction in AML cell number for CD36 high (top) and low (bottom) samples. h Fraction of interacting cells after 24 h of incubation with anti-CD36 relative to isotype control, stratified by CD36 level. i Dose-response curves showing the increase in cell-cell interactions for CD36 high (top) and low (bottom) samples. j Expression of CD36 across AML subtypes and nonmalignant cell types. Values represent average expression (variance-stabilizing transformation (VST) of normalized counts) per cell type and sample derived from scRNA-seq data. Data from n = 29 samples. k CD36 expression stratified by French-American-British (FAB)-based AML maturation state in the BEAT-AML cohort. P values from two-sided two-sample Wilcoxon tests. Data from n = 237 patients. Lines and shaded areas in (b) and (c) correspond to a linear regression fit with 95% confidence bands, P values (two-sided t-test), and Pearson’s R are indicated. Each dot in (f) and (h) represents the mean number of AML cells across 18 technical replicate wells and the two highest antibody concentrations for a single sample (n = 7 samples from 6 patients). Each dot in (g) and (i) represents a technical replicate well (n = 9 per antibody concentration). P values in (f) and (h) from Kruskal-Wallis ANOVA. Box plots indicate the median (horizontal line) and 25% and 75% ranges (box) and whiskers indicate the 1.5x interquartile range above or below the box.

References

    1. Roboz, G. J. et al. International randomized phase III study of elacytarabine versus investigator choice in patients with relapsed/refractory acute myeloid leukemia. J. Clin. Oncol.32, 1919–1926 (2014). - PubMed
    1. Bewersdorf, J. P. et al. Venetoclax-based salvage therapy in patients with relapsed/refractory acute myeloid leukemia previously treated with FLT3 or IDH1/2 inhibitors. Leuk. Lymphoma64, 188–196 (2023). - PMC - PubMed
    1. Morita, K. et al. Clonal evolution of acute myeloid leukemia revealed by high-throughput single-cell genomics. Nat. Commun.11, 5327 (2020). - PMC - PubMed
    1. van Galen, P. et al. Single-Cell RNA-Seq Reveals AML Hierarchies Relevant to Disease Progression and Immunity. Cell176, 1265–1281.e24 (2019). - PMC - PubMed
    1. Miles, L. A. et al. Single-cell mutation analysis of clonal evolution in myeloid malignancies. Nature587, 477–482 (2020). - PMC - PubMed

Publication types

MeSH terms