. 2024 Oct 30;15(1):9394.
doi: 10.1038/s41467-024-53593-8.

HIF1α-regulated glycolysis promotes activation-induced cell death and IFN-γ induction in hypoxic T cells

Affiliations

HIF1α-regulated glycolysis promotes activation-induced cell death and IFN-γ induction in hypoxic T cells

Hongxing Shen et al. Nat Commun. .

Abstract

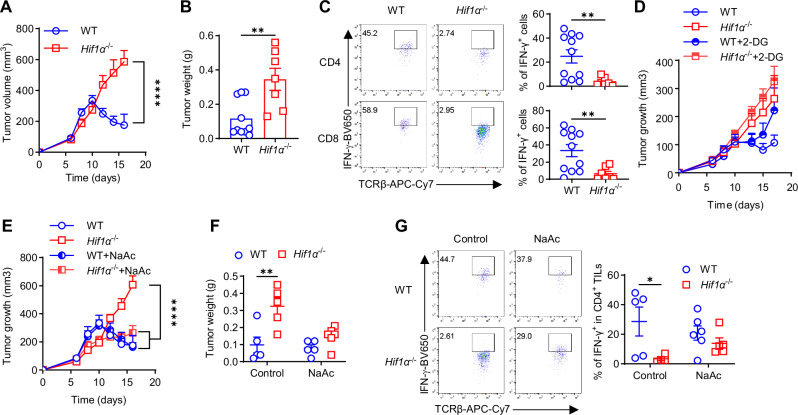
Hypoxia is a common feature in various pathophysiological contexts, including tumor microenvironment, and IFN-γ is instrumental for anti-tumor immunity. HIF1α has long been known as a primary regulator of cellular adaptive responses to hypoxia, but its role in IFN-γ induction in hypoxic T cells is unknown. Here, we show that the HIF1α-glycolysis axis controls IFN-γ induction in both human and mouse T cells, activated under hypoxia. Specific deletion of HIF1α in T cells (Hif1α-/-) and glycolytic inhibition suppresses IFN-γ induction. Conversely, HIF1α stabilization by hypoxia and VHL deletion in T cells (Vhl-/-) increases IFN-γ production. Hypoxic Hif1α-/- T cells are less able to kill tumor cells in vitro, and tumor-bearing Hif1α-/- mice are not responsive to immune checkpoint blockade (ICB) therapy in vivo. Mechanistically, loss of HIF1α greatly diminishes glycolytic activity in hypoxic T cells, resulting in depleted intracellular acetyl-CoA and attenuated activation-induced cell death (AICD). Restoration of intracellular acetyl-CoA by acetate supplementation re-engages AICD, rescuing IFN-γ production in hypoxic Hif1α-/- T cells and re-sensitizing Hif1α-/- tumor-bearing mice to ICB. In summary, we identify HIF1α-regulated glycolysis as a key metabolic control of IFN-γ production in hypoxic T cells and ICB response.


Conflict of interest statement

The authors declare no competing interests.

Figures

Fig. 1
Fig. 1. HIF1α but not HIF2α controls IFN-γ induction in hypoxic T cells, in vitro.
A, B Naïve CD4+ T cells isolated from WT and Hif1α− / − mice were activated under hypoxia (1% O2) and normoxia (21% O2). On Day 5, cells were harvested to measure IFN-γ production by flow cytometry. N = 5 for the Hif1α–/– 1% O2 group, N = 6 for other groups (****p < 0.0001) (A). At 48 h, cell lysates were prepared to detect HIF1α and HIF2α expression by Western blot. β-Actin was included as a loading control (B). C Activated CD4+ T cells were transduced with retroviruses expressing scrambled shRNA (Scr shRNA) or Hif2α shRNA (shHif2α), followed by IFN-γ detection. D Naive human CD4+ T from healthy donors were activated, transduced with retroviruses expressing scrambled shRNA (Scr shRNA) or human shHIF1A, cultured under hypoxia for 5 days, and detected IFN-γ production (*p = 0.011). E Naïve CD8+ T cells isolated from WT and Hif1α− / − mice were activated under hypoxia (1% O2) for 5 days, followed by IFN-γ detection (N = 4, **p = 0.0011). F Naïve T cells were similarly activated as in (A) but under 2.5% O2 to detect IFN-γ production (N = 3, **p = 0.0012). G IFN-γ production in cells from (A) was evaluated every day from Day 1-5. (N = 3, ****p < 0.0001). H The cells were activated in hypoxia as in (A) but with 50% of old media replaced by fresh media daily on Day 1–4. IFN-γ production was detected on Day 5 (**p = 0.005). I Equally mixed naïve CD45.1+ CD4+ T cells with naïve CD45.2+ CD4+ WT or Hif1α− / − T cells were activated under hypoxia for 5 days and measured IFN-γ production (N = 6, ****p < 0.0001). J Geometric mean fluorescence intensity (gMFI) of HIF1α (left) and GLUT1 (right) in WT or Vhl− / − CD4+ T cells activated under hypoxia as in (A) (N = 6, ****p < 0.0001). K IFN-γ production by WT or Vhl–/– CD4+ T cells activated under hypoxia for 3 days (N = 6, ***p = 0.0003). A two-sided Student’s t-test was used in DF, H, J and K for statistical analyzes. Two-way ANOVA with Šídák’s multiple comparisons test (with adjustment) was used for (A, G, and I). All the experiments were repeated at least twice. Pooled results shown in the dot plots and bar graphs depicted means ± SEM for all samples in each group, with each dot denoting an independent sample. Source data were provided in the Source Data file.
Fig. 2
Fig. 2. HIF1α-glycolysis drives IFN-γ induction in hypoxic T cells.
AC Total RNAs extracted from WT and Hif1α− / − CD4+ naïve T cells activated under hypoxia for 48 h were subjected to RNA-Seq. The gene expression analyzes were performed using DESeq2 (version 1.34.0). The Wald test was used to calculate the p values and log2 fold changes. Genes with an adjusted p value < 0.05 and absolute log2 fold change > 1 were considered as differentially expressed genes (DEGs). A volcano plot was used to show all upregulated and downregulated DEGs using the ggplot2 R package (A), with top 50 identified DEGs shown as a heatmap (B). Top 10 enriched signaling pathways (downregulated) from Enriched Kyoto Encyclopedia of Genes and Genomes (KEGG) analyzes of DEGs were shown in (C). Significant terms of the KEGG pathways were selected with p value < 0.05. D mRNA expression of glycolytic genes was evaluated by real-time RT-PCR in T cells activated and cultured under normoxia (21%) and hypoxia (1%) for 48 h (N = 6, **p = 0.0029 for Gpi, **p = 0.0053 for Pkm2, ***p = 0.0007 for Hk2, ***p = 0.0009 for Ldha, and ****p < 0.0001 for Mct4 by Two-way ANOVA with Šídák’s multiple comparisons test (with adjustment)). E Protein expression of GLUT1, HK2, LDHa, phospho-PDH and PDH was analyzed using cell lysates prepared using cells activated as in (D). β-Actin was used as a loading control. F Metabolic flux in activated WT and Hif1α− / − CD4+ as in (A), traced by 13C labeled glucose. The thickness of arrows relatively indicates the flow rates, with the specific numbers by the arrows depicting the metabolic flux of reactions. G. Extracellular acidification rate (ECAR) and oxygen consumption rate (OCR) were measured using a Mito stress test kit (N = 4) (Oligo: Oligomycin; FCCP: carbonyl cyanide 4-(trifluoromethoxy)phenylhydrazone; Rot/Anti: Rotenone & Antimycin A). H, I Naïve WT mouse CD4+ T cells (H, N = 6 per group) and naive human CD4+ T cells isolated from PBMCs of healthy donors (I, N = 3 per group) were activated under hypoxia, in the presence of solvent (Control) or 0.5 μM of 2-DG for 5 days, followed by analysis of IFN-γ production. A two-sided Student’s t-test was used in (H and I) for statistical analyzes (****p < 0.0001). All the experiments were repeated at least twice. Pooled results shown in the dot plots and bar graphs depicted means ± SEM for all samples in each group, with each dot denoting an independent sample. Source data were provided in the Source Data file.
Fig. 3
Fig. 3. Restoration of HIF1α and intracellular acetyl-CoA rescues IFN-γ production in Hif1α–/– T cells.
A, B Protein expression of HIF1α in WT and Hif1α− / − CD4+ T cells successfully transduced (GFP+ ) with empty retroviruses (EV) or retroviruses expressing WT or triple-mutant Hif1α (TM) under hypoxia (A). GFP+ T cells from (A) were activated under hypoxia and analyzed for IFN-γ production (B) (N = 3 per group, ****p < 0.0001)). C Intracellular acetyl-CoA in activated WT and Hif1α− / − CD4+ T cells (N = 6 per group, ****p < 0.0001). DE Intracellular acetyl-CoA (D) (N = 6 per group, *p = 0.022) and IFN-γ production (E) (N = 5 per group, **p = 0.0081) by activated WT and Hif1α− / − CD4+ T cells, cultured with or without 20 mM sodium acetate (NaAc) added on Day 2 post-activation. F Cell death of MB49 cells cultured with activated WT and Hif1α− / − CD4+ T cells at the ratio of 1:2 for 48 h was analyzed by 7-AAD/Annexin V staining (N = 12 per group, ****p < 0.0001). G Cell death of MB49 cells co-cultured with activated WT and Hif1α− / − CD4+ T cells pretreated with or without NaAc for 48 h was analyzed by 7-AAD/Annexin V staining (N = 4 per group, ****p < 0.0001). H,I H3K9Ac enrichment at Ifng promoter and upstream regions (H) and Ifng mRNA expression (I) (N = 3 per group, *p = 0.0123) in activated WT and Hif1α− / − CD4+ T cells treated with solvent (UnTx) or 20 mM of NaAc. A two-sided Student’s t-test was used in (C and F) for statistical analyzes. Two-way ANOVA with Šídák’s multiple comparisons test (with adjustment) was used for (B, DE, G) and I. All experiments were repeated at least twice. Pooled results shown in the dot plots and bar graphs depicted means ± SEM for all the samples in each group, with each dot denoting an independent sample. Source data were provided in the Source Data file.
Fig. 4
Fig. 4. Reduced IFN-γ production in Hif1α− / − T cells is not due to proliferative defect.
AB Naïve WT and Hif1α− / − CD4+ T cells were activated under normoxia (21% O2) and hypoxia (1% O2) for 5 days. Gated live cells were analyzed for the expression of ICOS and CD25 (A), depicted as geometric mean fluorescence intensity (gMFI), and area of forward scatter (FSC-A) (B) (N = 4 per group, ****p < 0.0001, ***p = 0.0001). CD Naïve WT and Hif1α− / − CD4+ T cells were labeled with CellTrace Violet (CTV) and activated under normoxia (21% O2) and hypoxia (1% O2). CTV dilution was monitored daily to assess cell proliferation (C). IFN-γ production by activated WT and Hif1α− / − CD4+ T cells within indicated cell divisions was shown (D) (N = 3 per group, ****p < 0.0001). Two-way ANOVA with Šídák’s multiple comparisons test (with adjustment) was used for (AB and D). All the experiments were repeated at least twice. Pooled results shown in the dot plots and bar graphs depicted means ± SEM for all the samples in each group, with each dot denoting an independent sample. Source data were provided in the Source Data file.
Fig. 5
Fig. 5. HIF1α-glycolysis-driven AICD governs IFN-γ production in hypoxic T cells.
A Cell death of naïve WT CD4+ T cells activated under hypoxia for 3 days, with or without with 2-DG was measured by 7-AAD and Annexin V staining (N = 3 per group, ****p < 0.0001). B Cell death of naïve WT and Hif1α− / − CD4+ T cells activated under normoxia (21% O2) and hypoxia (1% O2) for 3 days was detected by 7-AAD/Annexin V staining (N = 6 per group, ****p < 0.0001). CD Naïve WT and Hif1α− / − CD4+ T cells were activated under hypoxia, with z-VAD-fmk or without (DMSO); on day 3, cells were stained for 7-AAD and Annexin V to assess cell death (C) (N = 4 per group, ****p < 0.0001), and on Day 5, IFN-γ production was determined (D) (N = 4 per group, **p = 0.0016). EF Naïve Hif1α− / − CD4+ T cells were activated under hypoxia, with or without 20 mM sodium acetate (NaAc) added on day 0; on Day 3, cells were stained for7-AAD and Annexin V to assess cell death (E) (N = 3 per group, ****p < 0.0001), and IFN-γ production was determined on Day 5 (F) (N = 6 per group, ****p < 0.0001). A two-sided Student’s t-test was used in (AE and F) for statistical analyzes. Two-way ANOVA with Šídák’s multiple comparisons test (with adjustment) was used for (BD). All the experiments were repeated at least twice. Pooled results shown in the dot plots depicted means ± SEM for all the samples in each group, with each dot denoting an independent sample. Source data were provided in the Source Data file.
Fig. 6
Fig. 6. HIF1α regulates IFN-γ production in tumor-infiltrating T cells (TILs).
A, B T cells isolated from WT (N = 10) or Hif1α− / − (N = 7) mice bearing established MB49 bladder tumor were analyzed for IFN-γ production by CD4+ and CD8+ splenocytes (A) or TILs (B) (**p < 0.0001, *p = 0.001). C, D T cells isolated from WT or Hif1α− / − mice bearing established orthotopic B16-BL6 melanoma were analyzed for IFN-γ production by CD4+ and CD8+ splenocytes (C) (N = 5 per group) or TILs (D) (N = 7 per group, *p = 0.0042, **p < 0.0024). E, F T cells isolated from WT or Vhl− / − mice bearing established MB49 bladder tumor were analyzed for IFN-γ production by CD4+ and CD8+ splenocytes (E) (N = 5 per group, **p = 0.0097, ****p < 0.0001) or TILs (F) (N = 5 per group, **p = 0.0021, ***p = 0.0008). A two-sided Student’s t-test was used in (AF) for statistical analyzes. All the experiments were repeated 2–5 times. Pooled results shown in the dot plots depicted means ± SEM for all the mice in each group, with each dot denoting an individual mouse. Source data were provided in the Source Data file.
Fig. 7
Fig. 7. HIF1α in T cells governs therapeutic effects of ICB.
A, B WT and Hif1α− / − mice bearing palpable MB49 bladder tumor were treated with combined anti-CTLA-4+anti-PD-1 therapy (ICB), followed by periodic measurement of tumor volume (A) and tumor weights at euthanization (B). C IFN-γ production by CD4+ and CD8+ TILs isolated from tumor-bearing mice in (AB) (N = 10 for WT, N = 7 for Hif1α− / − (AC), ****p < 0.0001 for (A), **p = 0.0037 for (B), **p = 0.0083 for CD4+ TILs and **p = 0.0097 for CD8+ TILs (C). D MB49 bladder tumor-bearing WT and Hif1α− / − mice treated with ICB alone or in conjunction with 2-DG administration, followed by periodic measurement of tumor volume. EF WT and Hif1α− / − mice bearing palpable MB49 bladder tumor were treated with ICB alone or in conjunction with administration of sodium acetate (NaAc), followed by periodic measurement of tumor volume (E) and tumor weights at euthanization (F) (N = 5 per group for (E and F), ****p < 0.0001, **p = 0.0041) (G). IFN-γ production by CD4+ TILs from tumor-bearing mice in (EF) (N = 5 per group, *p = 0.0265). A two-sided Student’s t-test was used in (B, C) for statistical analyzes. Two-way ANOVA with Šídák’s multiple comparisons test (with adjustment) was used for (A, DG). All the experiments were repeated 2–5 times. Pooled results shown in the dot plots depicted means ± SEM for all the mice in each group, with each dot denoting an individual mouse. Source data were provided in the Source Data file.

Update of

References

    1. Mosmann, T. R., Cherwinski, H., Bond, M. W., Giedlin, M. A. & Coffman, R. L. Two types of murine helper T cell clone. I. Definition according to profiles of lymphokine activities and secreted proteins. J. Immunol.136, 2348–2357 (1986). - PubMed
    1. Harrington, L. E. et al. Interleukin 17-producing CD4+ effector T cells develop via a lineage distinct from the T helper type 1 and 2 lineages. Nat. Immunol.6, 1123–1132 (2005). - PubMed
    1. Sakaguchi, S., Sakaguchi, N., Asano, M., Itoh, M. & Toda, M. Immunologic self-tolerance maintained by activated T cells expressing IL-2 receptor alpha-chains (CD25). Breakdown of a single mechanism of self-tolerance causes various autoimmune diseases. J. Immunol.155, 1151–1164 (1995). - PubMed
    1. Shen, H. & Shi, L. Z. Metabolic regulation of TH17 cells. Mol. Immunol.109, 81–87 (2019). - PMC - PubMed
    1. Chang, C. H. et al. Posttranscriptional control of T cell effector function by aerobic glycolysis. Cell153, 1239–1251 (2013). - PMC - PubMed

Publication types

MeSH terms

Substances

Associated data