

α-synuclein overexpression and the microbiome shape the gut and brain metabolome in mice
- PMID: 39477976
- PMCID: PMC11525669
- DOI: 10.1038/s41531-024-00816-w
α-synuclein overexpression and the microbiome shape the gut and brain metabolome in mice
Abstract
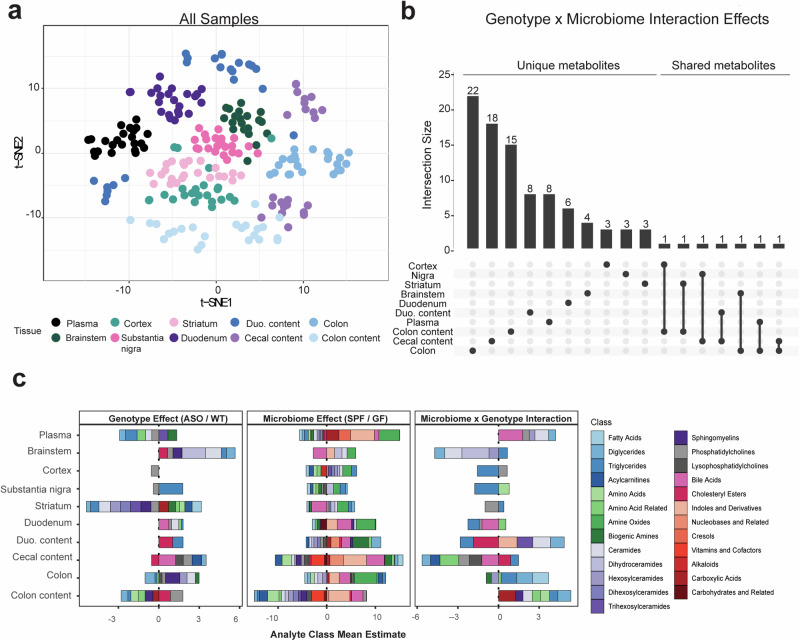
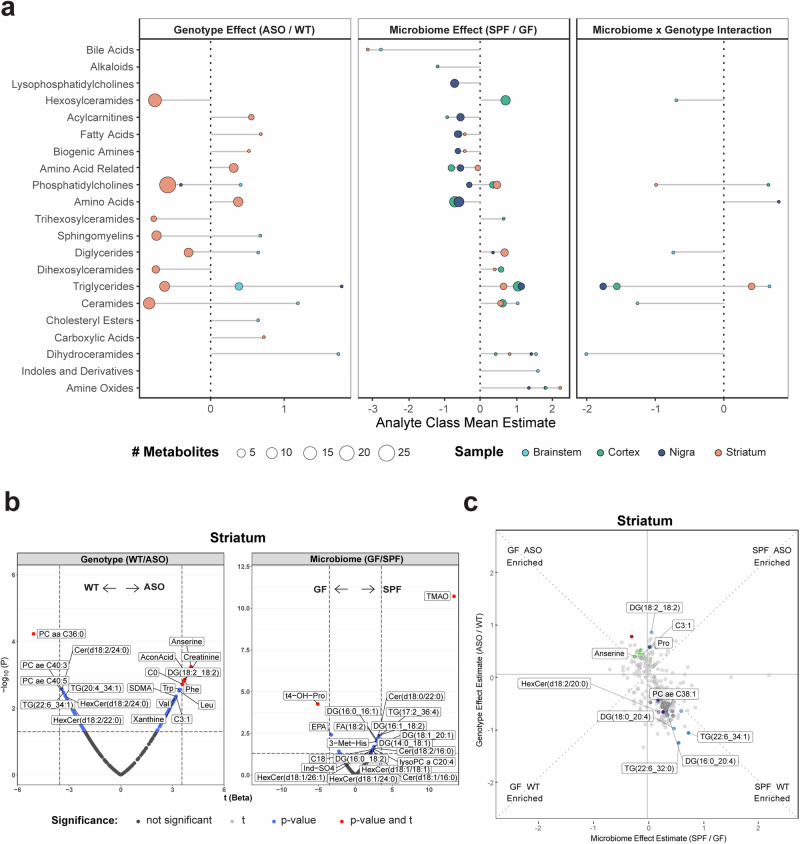
Pathological forms of α-synuclein contribute to synucleinopathies, including Parkinson's disease (PD). Most cases of PD arise from gene-environment interactions. Microbiome composition is altered in PD, and gut bacteria are causal to symptoms in animal models. We quantitatively profiled nearly 630 metabolites in the gut, plasma, and brain of α-synuclein-overexpressing (ASO) mice, compared to wild-type (WT) animals, and comparing germ-free (GF) to specific pathogen-free (SPF) animals (n = 5 WT-SPF; n = 6 ASO-SPF; n = 6 WT-GF; n = 6 ASO-GF). Many differentially expressed metabolites in ASO mice are also dysregulated in human PD patients, including amine oxides, bile acids and indoles. The microbial metabolite trimethylamine N-oxide (TMAO) strongly correlates from the gut to the plasma to the brain in mice, notable since TMAO is elevated in the blood and cerebrospinal fluid of PD patients. These findings uncover broad metabolomic changes that are influenced by the intersection of host genetics and microbiome in a mouse model of PD.
© 2024. The Author(s).
Conflict of interest statement
L.H.M., J.C.B., and S.M.D. declare no financial or non-financial competing interests. R.K.D. is an inventor on a series of patents on the use of metabolomics for the diagnosis and treatment of central nervous system diseases and holds equity in Metabolon Inc., Chymia LLC and PsyProtix. S.K.M. is a co-founder of Axial Therapeutics and Nuanced Health, and declares no competing interests with this study.
Figures


Update of
-
α-Synuclein Overexpression and the Microbiome Shape the Gut and Brain Metabolome in Mice.bioRxiv [Preprint]. 2024 Jun 10:2024.06.07.597975. doi: 10.1101/2024.06.07.597975. bioRxiv. 2024. Update in: NPJ Parkinsons Dis. 2024 Oct 30;10(1):208. doi: 10.1038/s41531-024-00816-w. PMID: 38915679 Free PMC article. Updated. Preprint.
References
-
- Aarsland, D. et al. Parkinson disease-associated cognitive impairment. Nat. Rev. Dis. Prim.7, 1–21 (2021). - PubMed
Grants and funding
- U19AG063744/U.S. Department of Health & Human Services | National Institutes of Health (NIH)
- 3U19AG063744-04S1/U.S. Department of Health & Human Services | National Institutes of Health (NIH)
- U19 AG063744/AG/NIA NIH HHS/United States
- RF1AG058942/U.S. Department of Health & Human Services | National Institutes of Health (NIH)
- RF1 AG059093/AG/NIA NIH HHS/United States
- U01 AG061359/AG/NIA NIH HHS/United States
- RF1 AG057452/AG/NIA NIH HHS/United States
- R01 AG081322/AG/NIA NIH HHS/United States
- DAOU16AMPA/Foundation for the National Institutes of Health (Foundation for the National Institutes of Health, Inc.)
- R01 AG046171/AG/NIA NIH HHS/United States
- R01AG059093/U.S. Department of Health & Human Services | National Institutes of Health (NIH)
- RF1AG057452/U.S. Department of Health & Human Services | National Institutes of Health (NIH)
- U01AG061359/U.S. Department of Health & Human Services | National Institutes of Health (NIH)
- RF1AG051550/U.S. Department of Health & Human Services | National Institutes of Health (NIH)
- R01 MH108348/MH/NIMH NIH HHS/United States
- R01AG046171/U.S. Department of Health & Human Services | National Institutes of Health (NIH)
- ASAP-000375/Michael J. Fox Foundation for Parkinson's Research (Michael J. Fox Foundation)
- R01MH108348/U.S. Department of Health & Human Services | National Institutes of Health (NIH)
- ASAP-020495/Michael J. Fox Foundation for Parkinson's Research (Michael J. Fox Foundation)
- RF1 AG058942/AG/NIA NIH HHS/United States
- R01AG081322/U.S. Department of Health & Human Services | National Institutes of Health (NIH)
- RF1 AG051550/AG/NIA NIH HHS/United States
LinkOut - more resources
Full Text Sources
