. 2024 Oct 30;14(1):26092.
doi: 10.1038/s41598-024-77260-6.

Stage dependent microbial dynamics in hepatocellular carcinoma and adjacent normal liver tissues

Affiliations

Stage dependent microbial dynamics in hepatocellular carcinoma and adjacent normal liver tissues

Hee Eun Jo et al. Sci Rep. .

Abstract

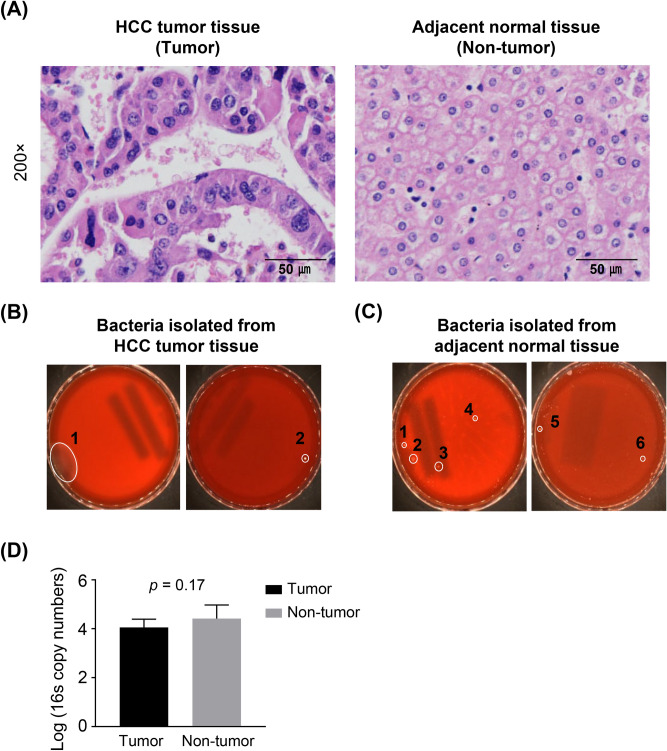
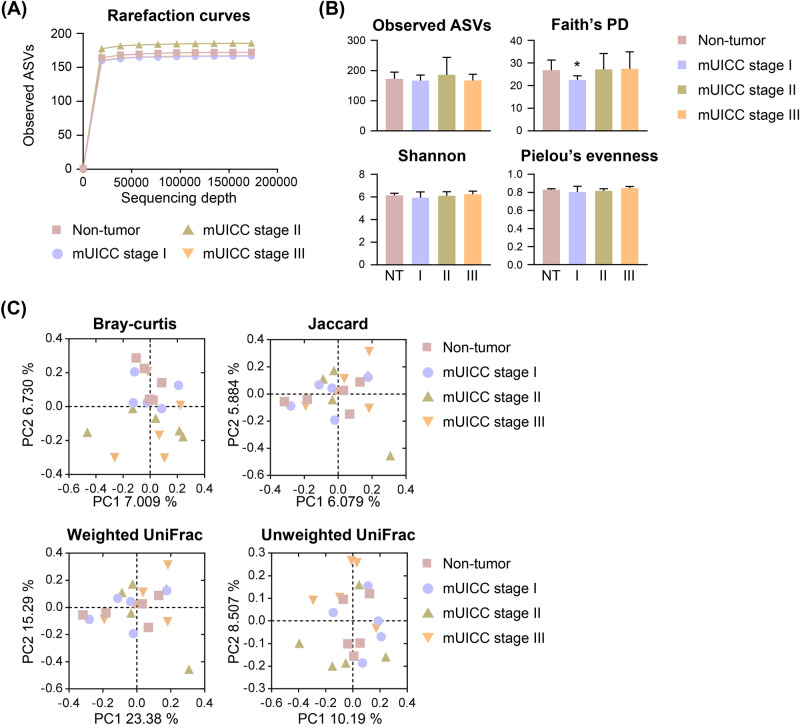
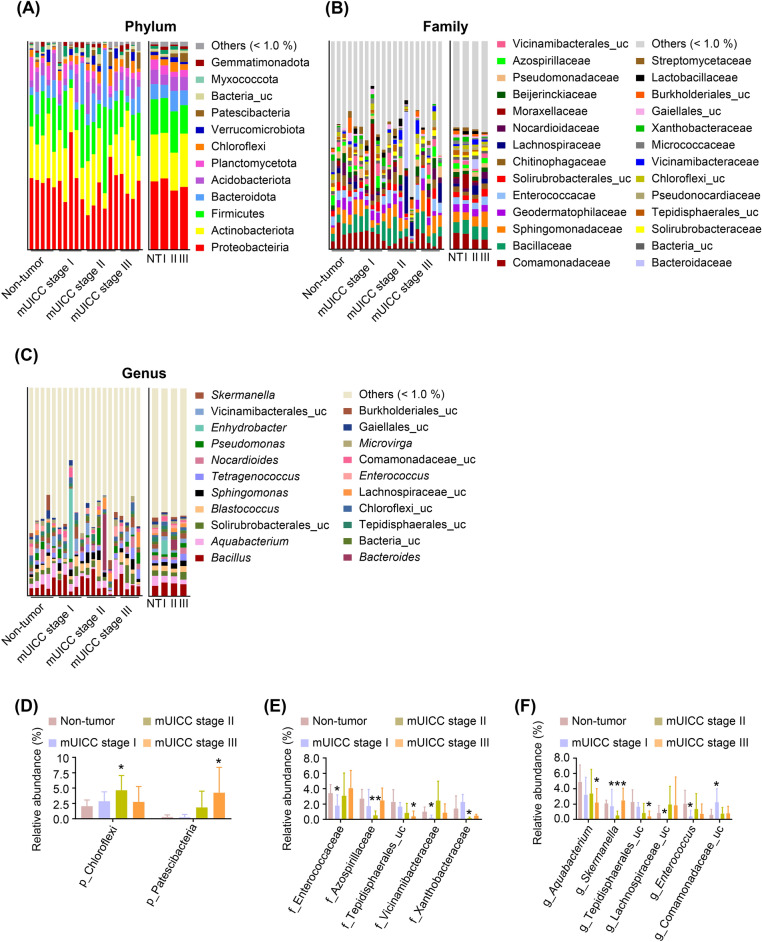
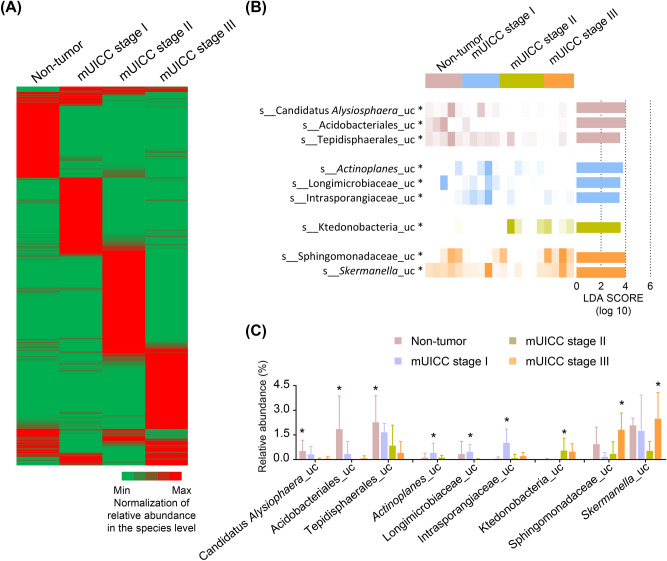
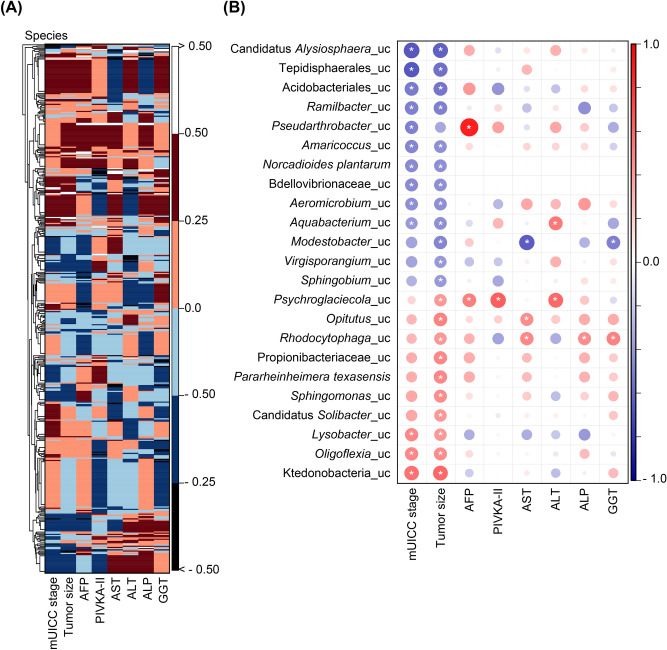
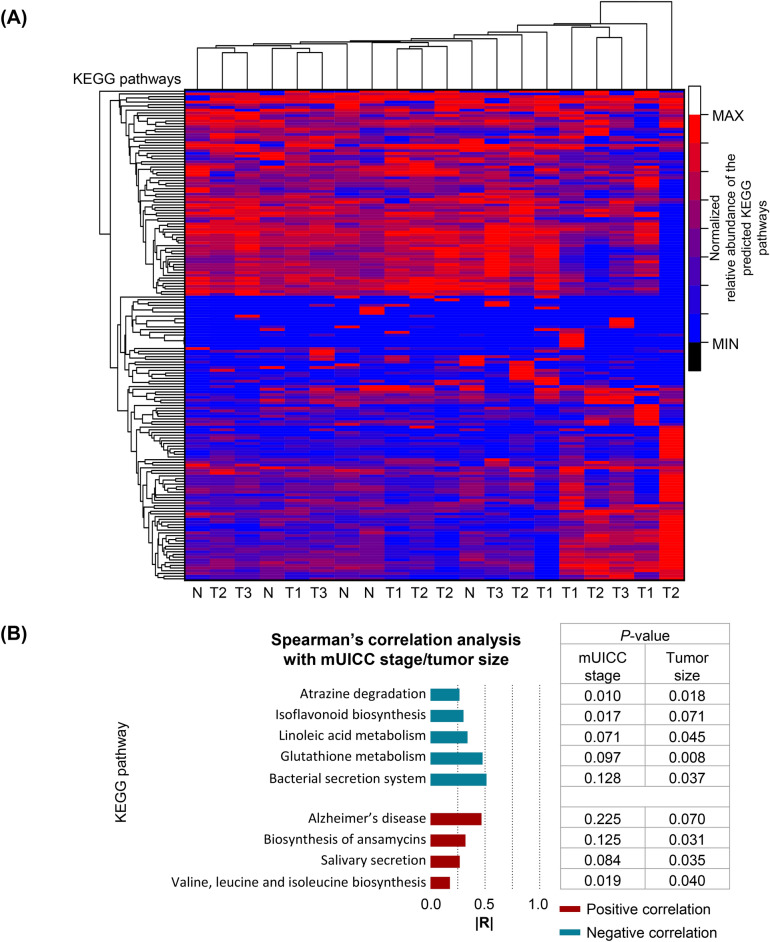
The interactive pathway of the gut-liver axis underscores the significance of microbiome modulation in the pathogenesis and progression of various liver diseases, including hepatocellular carcinoma (HCC). This study aims to investigate the disparities in the composition and functionality of the hepatic microbiota between tumor tissues and adjacent normal liver tissues, and their implications in the etiology of HCC. We conducted a comparative analysis of the hepatic microbiome between adjacent normal liver tissues and tumor tissues from HCC patients. Samples were categorized according to the modified Union for International Cancer Control (mUICC) staging system into Non-tumor, mUICC stage I, mUICC stage II, and mUICC stage III groups. Microbial richness and community composition were analyzed, and phylogenetic profiles were examined to identify significantly altered microbial taxa among the groups. Predicted metabolic pathways were analyzed using PICRUSt2. Our analysis did not reveal significant differences in microbial richness and community composition with the development of HCC. However, phylogenetic profiling identified significantly altered microbial taxa among the groups. Sphingobium, known for degrading polychlorinated biphenyls (PCBs), exhibited a significantly negative correlation with clinical indices in HCC patients. Conversely, Sphingomonas, a gut bacterium associated with various liver diseases, showed a positive correlation. Predicted metabolic pathways suggested a correlation between atrazine degradation and valine, leucine, and isoleucine biosynthesis with mUICC stage and tumor size. Our results underscore the critical link between hepatic microbial composition and function and the HCC tumor stage, suggesting a potentially pivotal role in the development of HCC. These findings highlight the importance of targeting the hepatic microbiome for therapeutic strategies in HCC.

Keywords: Gut-liver axis; Hepatocellular carcinoma; Phylogenetic analysis; Taxa associations; Tumor tissues.


Conflict of interest statement

The authors declare no competing interests.

Figures

Fig. 1
Fig. 1
HCC tissues in presence of bacteria. (A) Representative hematoxylin and eosin (H&E) staining images from different regions of HCC tumor tissues and adjacent normal tissues. Scale bar: 50 μm. (B, C) Culture-based assay of liver samples in tumor tissues (B) and adjacent normal tissues (C). BLAST results of 16S rRNA sequences of colonies selected from HCC tumor tissues. (D) Bacterial load in the tumor and non-tumor samples determined by quantitative PCR of the 16S rRNA gene. Data are presented as mean ± standard deviation (SD).
Fig. 2
Fig. 2
Microbial diversity in the liver of patients with HCC. (A) Rarefaction curves of the four groups demonstrating saturation: Non-tumor (NT), mUICC stage I (I), mUICC stage II (II), and mUICC stage III (III). The x-axis represents the number of sampled sequences, and y-axis represents the observed amplicon sequencing variants (ASVs). (B) Alpha diversity boxplots are illustrated for the observed ASVs, Faith’s phylogenetic diversity (Faith’s PD), Shannon, and Pielou’s evenness indices. Data are presented as mean ± SD. Statistical analysis was conducted using a one-tailed Student’s t-test (*p < 0.05) compared to the NT group. (C) Principal coordinates analysis (PCoA) plots generated based on Bray–Curtis distances, Jaccard, weighted-UniFrac, and unweighted-UniFrac indices among samples of the four groups. No significant differences were observed among the groups as PERMANOVA.
Fig. 3
Fig. 3
Phylogenetic profiles of the microbes at different HCC mUICC stages. Taxonomic composition of hepatic microbiota of patients with HCC at the phylum (A), family (B), and genus (C) levels; colors indicate the corresponding percentages of different taxa. The plots depict the relative abundance of two phyla (D), five families (E), and six genera (F), that exhibited statistically significant differences among the groups. Statistical analysis was conducted using a one-tailed Student’s t-test (*p < 0.05, **p < 0.01) compared to the non-tumor group. uc, unclassified taxa; others, sum of the taxa with averages of less than 1% relative abundance; NT, Non-tumor group; I, mUICC stage I group; II, mUICC stage II group; III, mUICC stage III group.
Fig. 4
Fig. 4
Differential composition in the hepatic microbiome across HCC mUICC stages. (A) Normalized heatmap of bacterial abundance at the species level in the Non-tumor, mUICC stage I, mUICC stage II, and mUICC stage III groups. (B) Linear discriminant analysis (LDA) score and p-value computed from differentially abundant bacteria among the groups at the species level, using the linear discriminant analysis effect size (LEfSe) algorithm. Statistical analysis was performed using LEfSe. Features with an LDA score > 2 were assessed, followed by Kruskal–Wallis test with a Wilcoxon test cut-off of p < 0.05 (*p < 0.05). (C) Relative abundance of significantly increased taxa in each group, followed by Kruskal–Wallis test with a Wilcoxon test cut-off of p < 0.05 (*p < 0.05). Values are expressed as mean ± SD. uc, unclassified taxa.
Fig. 5
Fig. 5
Correlation between the hepatic microbiome and HCC progression. (A) Heatmap showing Spearman’s correlation coefficient of pairwise comparison based on bacterial abundance (at the species level) and clinical indices. (B) The corrplot illustrates statistically significant associations between the hepatic microbiota and clinical indices. Positive correlations are displayed in red, and negative correlations are in blue (the darker the color and the larger the graph, the more significant the correlation). The correlation results were considered statistically significant at *p < 0.05. AFP, alpha-fetoprotein; PIVKA-II, prothrombin-induced by vitamin K absence or antagonist-II; AST, aspartate aminotransferase; ALT, alanine aminotransferase; ALP, alkaline phosphatase; GGT, gamma-glutamyl peptidase.
Fig. 6
Fig. 6
Predictive functional profiling of microbial communities in the liver tissues of patients with HCC. (A) Normalized heatmap of predicted KEGG pathways in HCC and adjacent normal tissues. N, Non-tumor group; T1, mUICC stage I; T2, mUICC stage II; T3, mUICC stage III. (B) Absolute value of Spearman’s correlation coefficient (|R|) between the hepatic microbial metabolic pathway, mUICC stage, and tumor size. The correlation results were deemed statistically significant at p < 0.05. Positive correlations are displayed in red, and negative correlations are in blue.

References

    1. Chon, Y. E., Jeong, S. W. & Jun, D. W. Hepatocellular carcinoma statistics in South Korea. Clin. Mol. Hepatol.27(3), 512–514 (2021). - PMC - PubMed
    1. Villanueva, A. Hepatocellular Carcinoma. N. Engl. J. Med.380(15), 1450–1462 (2019). - PubMed
    1. Yoon, J. H. & Choi, S. K. Management of early-stage hepatocellular carcinoma: challenges and strategies for optimal outcomes. J. Liver Cancer23(2), 300–315 (2023). - PMC - PubMed
    1. Korean Liver Cancer, A., and National Cancer Center, K 2022 KLCA-NCC Korea practice guidelines for the management of hepatocellular carcinoma. Clin Mol Hepatol, 28(4), 583–705 (2022). - PMC - PubMed
    1. Chan, A. W. H. et al. Development of pre and post-operative models to predict early recurrence of hepatocellular carcinoma after surgical resection. J. Hepatol.69(6), 1284–1293 (2018). - PubMed

MeSH terms

LinkOut - more resources