. 2024 Dec;9(12):3135-3147.
doi: 10.1038/s41564-024-01838-z. Epub 2024 Oct 30.

Post-acute sequelae of SARS-CoV-2 cardiovascular symptoms are associated with trace-level cytokines that affect cardiomyocyte function

Affiliations

Post-acute sequelae of SARS-CoV-2 cardiovascular symptoms are associated with trace-level cytokines that affect cardiomyocyte function

Jane E Sinclair et al. Nat Microbiol. 2024 Dec.

Abstract

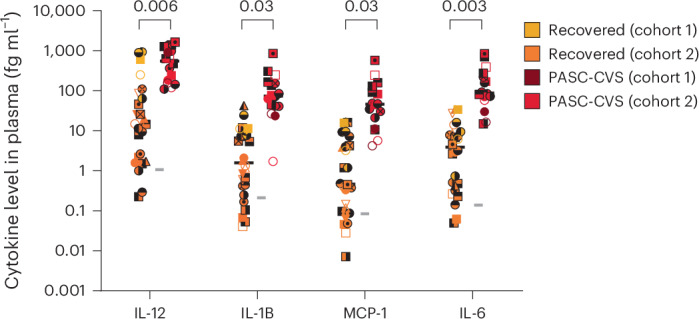
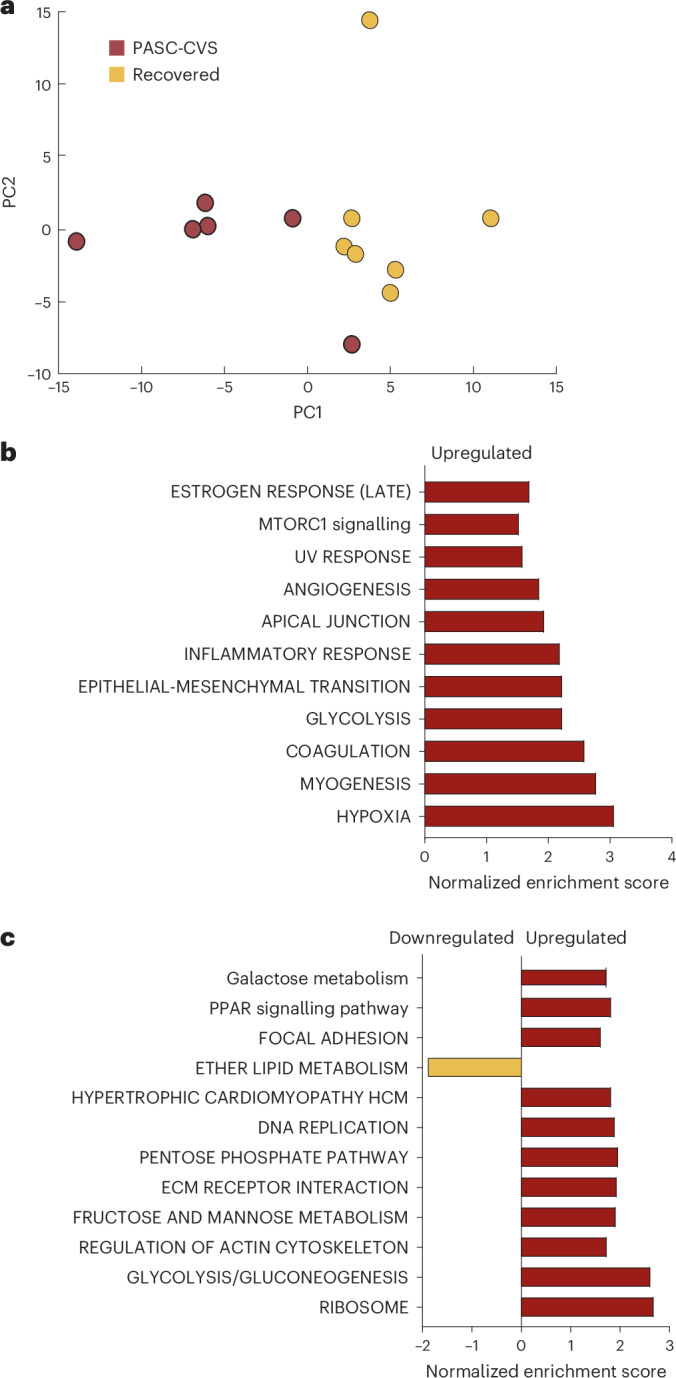
An estimated 65 million people globally suffer from post-acute sequelae of COVID-19 (PASC), with many experiencing cardiovascular symptoms (PASC-CVS) like chest pain and heart palpitations. This study examines the role of chronic inflammation in PASC-CVS, particularly in individuals with symptoms persisting over a year after infection. Blood samples from three groups-recovered individuals, those with prolonged PASC-CVS and SARS-CoV-2-negative individuals-revealed that those with PASC-CVS had a blood signature linked to inflammation. Trace-level pro-inflammatory cytokines were detected in the plasma from donors with PASC-CVS 18 months post infection using nanotechnology. Importantly, these trace-level cytokines affected the function of primary human cardiomyocytes. Plasma proteomics also demonstrated higher levels of complement and coagulation proteins in the plasma from patients with PASC-CVS. This study highlights chronic inflammation's role in the symptoms of PASC-CVS.


Conflict of interest statement

Competing interests: K.R.S. has historically been a consultant for Sanofi, Pfizer, Roche and NovoNordisk. The opinions and data presented in this manuscript are of the authors and are independent of these relationships. The remaining authors declare no competing interests.

Figures

Fig. 1
Fig. 1. Transcriptomic analyses of blood samples from participants with PASC and PASC-CVS and Recovered and Healthy participants from cohort 1.
a, UMAP of whole blood gene expression data at 44 and 68 w.p.i. for participants with PASC (n = 25), Recovered participants (n = 11) and Healthy controls (n = 14). b, The number of DEGs (false discovery rate (FDR) < 0.05 and fold change > 1.5) identified at each time point. c, Topmost upregulated and downregulated pathways and modules ranked by FDR in those participants with past COVID-19 relative to uninfected controls. SRP, signal recognition particle; GPCR, G-protein-coupled receptor; KEGG, Kyoto Encyclopedia of Genes and Genomes; MAPK, mitogen-activated protein kinase. d, Topmost upregulated and downregulated pathways and modules ranked by FDR in participants with PASC relative to Recovered participants. HOACS, hydroxyacyl-CoA synthase; ECM, extracellular matrix. e, Topmost upregulated and downregulated pathways and modules ranked by FDR in participants with PASC-CVS relative to Recovered participants. DCs, dendritic cells.
Fig. 2
Fig. 2. Transcriptomic analyses of PASC-CVS and Recovered blood samples in cohort 2.
a, UMAP of whole blood gene expression for participants with PASC-CVS (n = 5) and Recovered participants (n = 4). b, Topmost upregulated and downregulated pathways and modules ranked by FDR in participants with PASC-CVS relative to Recovered participants. CA2, calcium; ERK, extracellular signal-regulated kinases; ECM, extracellular matrix; ALS, amyotrophic lateral sclerosis; TGF, transforming growth factor. c, Heat map showing the expressions of genes increase among participants with PASC-CVS in the Gene Ontology (GO) humoral immune response (GO:0006959) and Reactome neutrophil degranulation (R-HSA-6798695) pathways.
Fig. 3
Fig. 3. Nanotechnology can detect elevated cytokine levels in PASC-CVS plasma.
Cytokine levels detected in the plasma from participants by immunostormchip. Median is shown in all graphs by a black bar. Statistical significance was determined with an ANCOVA adjusted for age, sex and/or site as covariates. Covariates were included in the analysis if statistically significant difference in the covariate was recorded between groups. Each donor is indicated by a unique symbol that is used consistently throughout all figures. Grey horizontal lines indicate the mean value derived from n = 9 Healthy donors. A description of the Healthy donor cohort is presented in Supplementary Table 14. Source data
Fig. 4
Fig. 4. Trace-level pro-inflammatory cytokine cocktail affects cardiomyocyte function.
a, Primary human cardiomyocytes were incubated for 24 h (top row) and 48 h (bottom row) with media alone ((RPMI-1640/B27 with insulin; control) or a cocktail of IL-12, IL-1β, MCP-1 and IL-6 (‘cytokines’). Cytokine concentrations were either ‘Recovered cytokine mimic’ (IL-12, 0.007 fg ml−1; IL-1β, 0.01 fg ml−1; MCP-1, 0.01 fg ml−1; IL-6, 0.004 fg ml−1) or ‘PASC-CVS cytokine mimic’ (IL-12, 41 fg ml−1; IL-1β, 21 fg ml−1; MCP-1, 14 fg ml−1; IL-6, 21 fg ml−1) to reflect levels detected in the PASC-CVS cohorts. Data are pooled from two independent experiments. Graphs show mean ± s.e.m. Normal distribution of data was assessed with the Shapiro–Wilk test. Statistical significance was determined with a Kruskal–Wallis test with Dunn’s multiple comparison test or Welch ANOVA test and Dunnett’s multiple comparison test. b, Primary human cardiomyocytes were incubated for 24 h (top row) and 48 h (bottom row) with PASC-CVS or Recovered plasma. Data are displayed relative to cardiomyocytes treated with media alone. Mean ± s.e.m. is shown in all graphs. Statistical significance was determined with an ANCOVA adjusted for age, sex and/or site as covariates. Covariates were included in the analysis if statistically significant difference in the covariate was recorded between groups. Each donor is indicated by a unique symbol that is used consistently throughout all figures. Grey horizontal lines indicate the mean value derived from n = 22 Healthy donors. A description of the Healthy donor cohort is presented in Supplementary Table 14. Source data
Fig. 5
Fig. 5. PASC-CVS plasma alters the transcriptome of cardiomyocytes relative to those treated with Recovered plasma.
a, PCA plot of cardiomyocyte transcripts following treatment with PASC-CVS or Recovered plasma for 24 h. b, Pathway analysis of transcripts derived from cardiomyocytes treated with PASC-CVS plasma relative to those treated with Recovered plasma analysed using the mSigDB Hallmark database. c, Pathway analysis of transcripts derived from cardiomyocytes treated with PASC-CVS plasma relative to those treated with Recovered plasma analysed using the mSigDB Hallmark database. In b and c, only pathways with an adjusted P value of <0.05 are shown. Bioconductor differential expression analysis was performed using the rnadeseq.m function in MATLAB on the batch-corrected gene expression counts. Gene expression was assumed to follow a negative binomial distribution with variance estimated through localized linear regression. Adjustments to P values for multiple testing were made using the Benjamini–Hochberg procedure.
Extended Data Fig. 1
Extended Data Fig. 1. Participant characteristics.
A) Comparison of characteristics between PASC-CVS and Recovered donors. B) Symptoms described by the 23 PASC-CVS participants.
Extended Data Fig. 2
Extended Data Fig. 2. Cytokine levels in the plasma of recovered and PASC-CVS donors.
Cytokine levels were detected in the plasma of participants using an ELISA (MCP-1) or a Legendplex bead-based assay (all other cytokines). Statistical significance was determined with an ANCOVA adjusted for age, sex and/or site as covariates. Covariates were included in the analysis if statistically significant difference in the covariate was recorded between groups. Values below the detection limit of the cytokine in question were taken as the assay lower bound. Each donor is indicated by a unique symbol that is used consistently throughout all figures. Mean ± SEM is shown. Grey horizontal lines indicate the mean value derived from n = 16 Healthy donors. A description of the Healthy donor cohort is presented in Supplementary Table 14. Source data
Extended Data Fig. 3
Extended Data Fig. 3. The use of the immunostorm chip to detect trace-level cytokines in patient samples.
A) Schematic workflow: Cytokines are captured on a nanopillar array and labelled with single-particle active SERS nanotags to from an immune complex (‘SERS pixel’). Trace-level cytokine measurement is achieved by mapping the nanopillar array by confocal Raman spectroscopy to count the SERS pixels. (B) Representative false-colour Raman images following treatment with a cytokine cocktail, bovine serum albumin (BSA) or PBS and (C) Representative false-colour Raman images of samples containing cytokines with a concentration of 2.6 aM, 26 aM, 260 aM, and 1031 aM. Images are representative of a single independent experiment.
Extended Data Fig. 4
Extended Data Fig. 4. Pearson correlation matrix of trace-level cytokines detected by immunostorm chip in the plasma of PASC-CVS donors.
Red indicates a negative correlation whilst blue indicates a positive correlation.
Extended Data Fig. 5
Extended Data Fig. 5. Flow cytometry characterisation of the cardiac purity of hiPSC-CMs.
(A-B) Raw data and representative gating strategy for assessing cardiomyocyte purity by flow cytometry. Cells were stained with phycoerythrin (PE)-conjugated anti-sarcomeric α-actinin (cardiac purity marker) and compared to PE-conjugated anti-human IgG isotype control (no-staining control) at day 15 of differentiation. Representative phenotyping (C) and bar plots (D) illustrating cell preparations at day 15 show that more than 80% sarcomeric α-actinin-positive cardiac population were obtained from three independent experiments. Source data
Extended Data Fig. 6
Extended Data Fig. 6. Trace-level individual pro-inflammatory cytokines did not affect cardiomyocyte function.
Human cardiomyocytes were incubated for 24 h (top line) or 48 h (bottom line) with media alone ((RPMI-1640/B27 with insulin; control) or individual pro-inflammatory cytokines. Cytokine concentrations were ‘PASC-CVS cytokine mimic’ (IL-12: 41fg/mL; IL-1β 21fg/mL; MCP-1 14fg/mL or IL-6 21fg/mL). Graphs show mean ± SEM. Normal distribution of data was assessed with the Shapiro-Wilk test. Mean ± SEM is shown. Statistical significance was determined with a Kruskal-Wallis test with Dunn’s multiple comparison test or Welch ANOVA test and Dunnett’s multiple comparison test. Data is pooled from three independent experiments. Source data
Extended Data Fig. 7
Extended Data Fig. 7. PASC-CVS plasma does not affect cardiomyocyte upstroke velocity in the presence of dexamethasone.
Primary human cardiomyocytes were incubated for 48 h with age, sex and site matched PASC-CVS and Recovered plasma. Plasma was added in the presence or absence 100 ng/mL of dexamethasone. Graphs show mean ± SEM. Normal distribution of data was assessed with the Shapiro-Wilk test. Mean ± SEM is shown. Statistical significance was determined with a two sided Mann-Whitney U Test. Data was pooled from three independent experiments. Source data
Extended Data Fig. 8
Extended Data Fig. 8. Protein Heatmap of donor plasma samples.
Heatmap of normalised abundance of A) all identified proteins in the plasma of donors and B) all proteins identified as significantly different after adjusting for age, sex and site. Rows are centered; unit variance scaling was applied to rows. Both rows and columns were clustered using correlation distance and average linkage. Heatmap created using ClustVis. Missing values are indicated in white.
Extended Data Fig. 9
Extended Data Fig. 9. Normalised protein abundance in PASC-CVS and Recovered plasma.
Statistical significance was determined with an ANCOVA adjusted for age, sex and/or site as covariates. Covariates were included in the analysis if statistically significant difference in the covariate was recorded between groups. Each donor is indicated by a unique symbol that is used consistently throughout all figures. Mean ± SEM is shown Grey horizontal lines indicate the mean value derived from n = 22 Healthy donors. A description of the Healthy donor cohort is presented in Supplementary Table 14. Source data
Extended Data Fig. 10
Extended Data Fig. 10. No increase in cardiovascular damage markers in PASC-CVS cohorts.
Levels in plasma were determined using the cardiac chip. Statistical significance was determined with an ANCOVA adjusted for age, sex and/or site as covariates. Covariates were included in the analysis if statistically significant difference in the covariate was recorded between groups. Each donor is indicated by a unique symbol that is used consistently throughout all figures. Grey horizontal lines indicate the mean value derived from n = 22 Healthy donors. A description of the Healthy donor cohort is presented in Supplementary Table 14. Source data

References

    1. Short, K. R. Long COVID. Microbiol. Aust.44, 113–114 (2023).
    1. Bowe, B., Xie, Y. & Al-Aly, Z. Postacute sequelae of COVID-19 at 2 years. Nat. Med.29, 2347–2357 (2023). - PMC - PubMed
    1. Davis, H. E., McCorkell, L., Vogel, J. M. & Topol, E. J. Long COVID: major findings, mechanisms and recommendations. Nat. Rev. Microbiol.21, 133–146 (2023). - PMC - PubMed
    1. Yin, K. et al. Long COVID manifests with T cell dysregulation, inflammation and an uncoordinated adaptive immune response to SARS-CoV-2. Nat. Immunol.25, 218–225 (2024). - PMC - PubMed
    1. Liew, F. et al. Large scale phenotyping of long COVID inflammation reveals mechanistic subtypes of disease after COVID-19 hospitalisation. Nat. Immunol.25, 607–621 (2024). - PMC - PubMed