. 2024 Oct 30;14(1):26114.
doi: 10.1038/s41598-024-76202-6.

Understanding the heterogeneous performance of variant effect predictors across human protein-coding genes

Affiliations

Understanding the heterogeneous performance of variant effect predictors across human protein-coding genes

Mohamed Fawzy et al. Sci Rep. .

Abstract

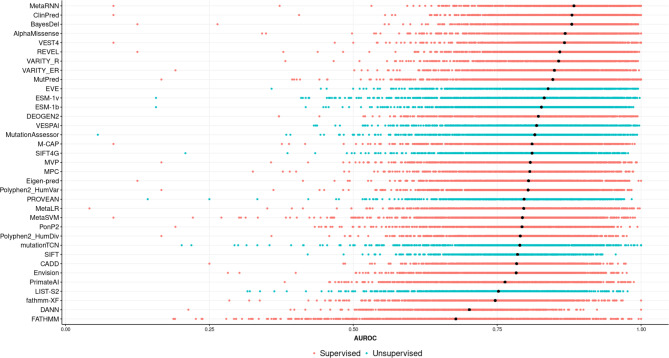
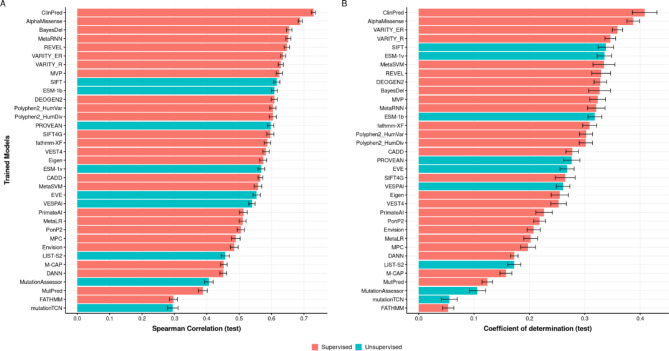
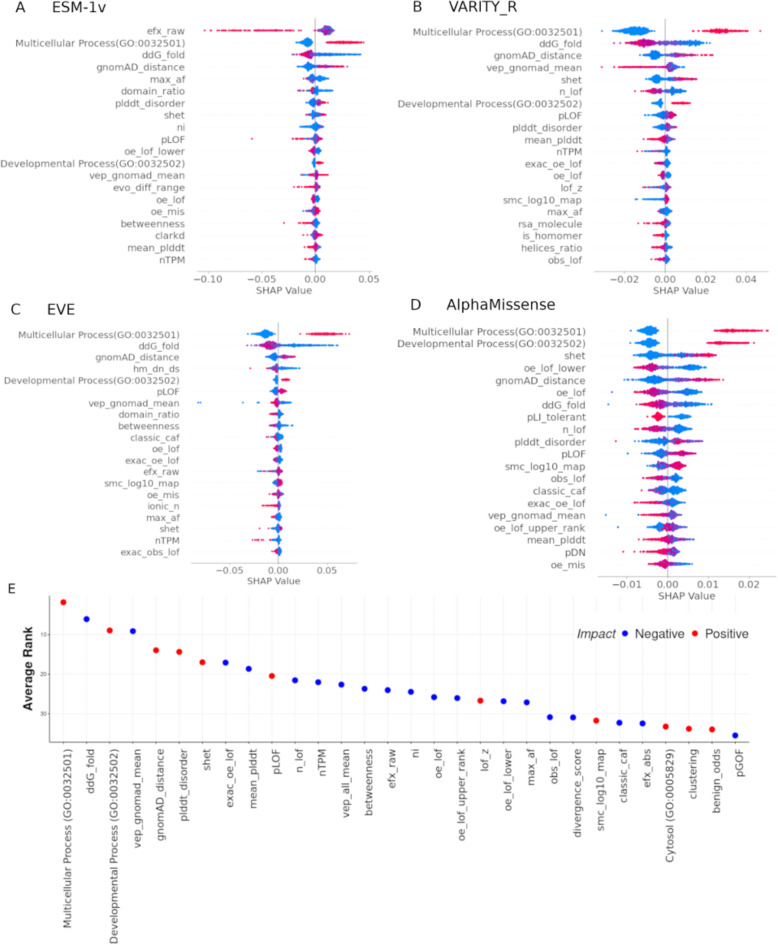
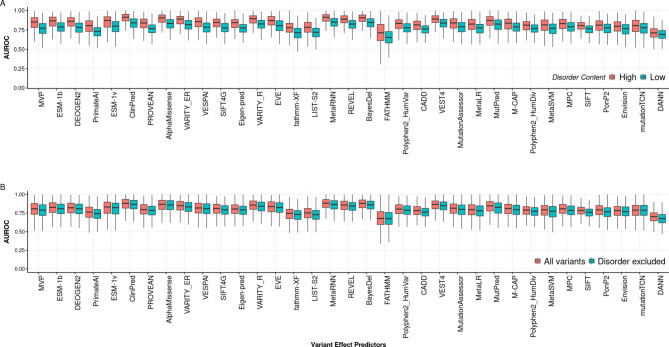
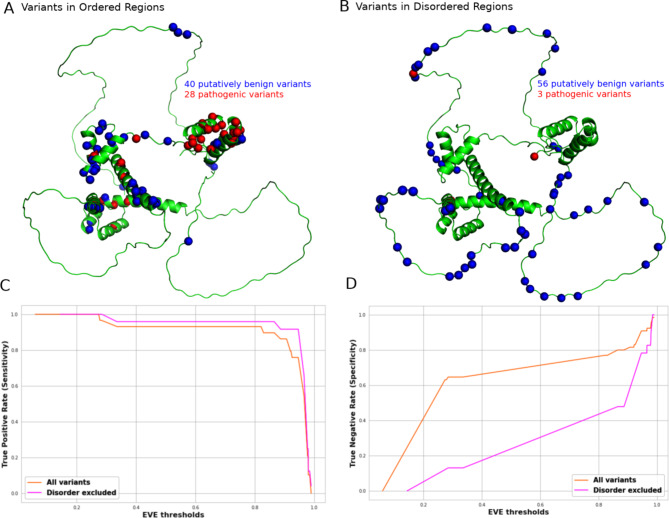
Variant effect predictors (VEPs) are computational tools developed to assess the impacts of genetic mutations, often in terms of likely pathogenicity, employing diverse algorithms and training data. Here, we investigate the performance of 35 VEPs in the discrimination between pathogenic and putatively benign missense variants across 963 human protein-coding genes. We observe considerable gene-level heterogeneity as measured by the widely used area under the receiver operating characteristic curve (AUROC) metric. To investigate the origins of this heterogeneity and the extent to which gene-level VEP performance is predictable, for each VEP, we train random forest models to predict the gene-level AUROC. We find that performance as measured by AUROC is related to factors such as gene function, protein structure, and evolutionary conservation. Notably, intrinsic disorder in proteins emerged as a significant factor influencing apparent VEP performance, often leading to inflated AUROC values due to their enrichment in weakly conserved putatively benign variants. Our results suggest that gene-level features may be useful for identifying genes where VEP predictions are likely to be more or less reliable. However, our work also shows that AUROC, despite being independent of class balance, still has crucial limitations when used for comparing VEP performance across different genes.


Conflict of interest statement

The authors declare no competing interests.

Figures

Fig. 1
Fig. 1
Heterogeneous performance of VEPs in identifying pathogenic missense variants across different human protein-coding genes.The distribution of AUROC values across 963 human protein-coding genes. The black dots refer to the median AUROC. The models were classified into either supervised or unsupervised based on the same classifications used previously. Note that the relative performance of different supervised models is of limited reliability due to the issue of data circularity.
Fig. 2
Fig. 2
Correlation of performance of different VEPs across human protein-coding genes. This matrix shows the Pearson correlation between AUROC scores across 963 human protein-coding genes for different VEPs. VEPs with high correlations do not necessarily produce similar scores to each other but show strong correspondence between the genes for which they perform better or worse, as measured by AUROC. VEPs are ordered by median AUC, as in Fig. 1.
Fig. 3
Fig. 3
Performance of trained random forest models for the prediction of AUROC across different VEPs. The figure shows both the Spearman correlation (A) and the coefficient of determination (B) between the predicted and real AUROC values for the testing gene set. Error bars represent the 95% confidence intervals calculated for each trained random forest model based on 100 repeated hold-out cross-validations. We obtained the confidence intervals by computing the standard error and critical value using a t-distribution.
Fig. 4
Fig. 4
Features most important for predicting VEP performance. The top 20 important features according to their absolute SHAP values for (A) ESM-1v, (B) VARITY_R, (C) EVE and (D) AlphaMissense. (E) The top 30 important features across all 35 different VEPs, sorted by their average rank. The features are colour-coded based on whether they have a positive or negative impact on the predicted AUROC (e.g. the ‘Multicellular Process’ GO term is associated with higher AUROC, while higher ddG_fold values are associated with lower AUROC).
Fig. 5
Fig. 5
Influence of intrinsic disorder on AUROC of VEPs. (A) The distribution of AUROC values of 35 VEPs across genes with different intrinsically disordered content. The ‘High’ group contains genes with a percentage of predicted intrinsically disordered residues greater than the median across the human proteome (12.7%), while the ‘Low’ group contains genes with less than or equal to the median. (B) The distribution of AUROC values calculated with all variants and with variants in disordered regions excluded. Intrinsically disordered residues were defined as those having pLDDT < 0.5. Boxes represent the interquartile range (IQR), while whiskers show the range of data falling within 1.5 times the IQR. VEPs were sorted based on the difference of the median of AUC between high and Low disorder groups.
Fig. 6
Fig. 6
Influence of intrinsically disordered regions on VEP performance in Pax6. Structural location of pathogenic (red) and putatively benign (blue) missense variants on the AlphaFold2 predicted structure of Pax6, showing (A) those variants occurring in ordered regions (pLDDT > 0.5) and (B) those variants occurring in disordered regions. (C) True positive rate (sensitivity) of EVE for predicting pathogenic missense mutations across different thresholds when considering all variants, and when variants at disordered positions are excluded. (D) True negative rate (specificity) of predicting putatively benign missense variants across different thresholds with and without disordered variants included.

Similar articles

Cited by

References

    1. Mardis, E. R. Next-generation sequencing platforms. Annu. Rev. Anal. Chem.610.1146/annurev-anchem-062012-092628 (2013). - PubMed
    1. Shendure, J. & Ji, H. Next-generation DNA sequencing. Nat. Biotechnol.26, 1135–1145. 10.1038/nbt1486 (2008). - PubMed
    1. Slatko, B. E., Gardner, A. F. & Ausubel, F. M. Overview of next-generation sequencing technologies. Curr. Protoc. Mol. Biol.12210.1002/cpmb.59 (2018). - PMC - PubMed
    1. Eilbeck, K., Quinlan, A. & Yandell, M. Settling the score: Variant prioritization and mendelian disease. Nat. Rev. Genet.18, 599–612. 10.1038/nrg.2017.52 (2017). - PMC - PubMed
    1. Niroula, A. & Vihinen, M. Variation interpretation predictors: Principles, types, performance, and choice. Hum. Mutat.37, 579–597. 10.1002/humu.22987 (2016). - PubMed

LinkOut - more resources