. 2024 Nov;5(11):1713-1736.
doi: 10.1038/s43018-024-00773-6. Epub 2024 Oct 30.

Differential chromatin accessibility and transcriptional dynamics define breast cancer subtypes and their lineages

Michael D Iglesia #  1   2 Reyka G Jayasinghe #  1   2 Siqi Chen #  1   2 Nadezhda V Terekhanova #  1   2 John M Herndon #  3   4 Erik Storrs  1   2 Alla Karpova  1   2 Daniel Cui Zhou  1   2 Nataly Naser Al Deen  1   2 Andrew T Shinkle  1   2 Rita Jui-Hsien Lu  1   2 Wagma Caravan  1   2 Andrew Houston  1   2 Yanyan Zhao  1   2 Kazuhito Sato  1   2 Preet Lal  1 Cherease Street  3   4 Fernanda Martins Rodrigues  1   2 Austin N Southard-Smith  1   2 André Luiz N Targino da Costa  1   2 Houxiang Zhu  1   2 Chia-Kuei Mo  1   2 Lisa Crowson  1   2 Robert S Fulton  2 Matthew A Wyczalkowski  1   2 Catrina C Fronick  2 Lucinda A Fulton  2 Hua Sun  1   2 Sherri R Davies  1 Elizabeth L Appelbaum  2 Sara E Chasnoff  3   4 Madelyn Carmody  3   4 Candace Brooks  3   4 Ruiyang Liu  1   2 Michael C Wendl  1   2   5   6 Clara Oh  1   2 Diane Bender  7 Carlos Cruchaga  8 Oscar Harari  8 Andrea Bredemeyer  1 Kory Lavine  1   9   10 Ron Bose  1   4 Julie Margenthaler  1   4 Jason M Held  1   4 Samuel Achilefu  1   11 Foluso Ademuyiwa  1   4 Rebecca Aft  3   4   12 Cynthia Ma  1   4 Graham A Colditz  3   13 Tao Ju  14 Stephen T Oh  1   9 James Fitzpatrick  15   16 E Shelley Hwang  17 Kooresh I Shoghi  4   11 Milan G Chheda  1   4 Deborah J Veis  1   4   9 Feng Chen  1 Ryan C Fields  3   4 William E Gillanders  18   19 Li Ding  20   21   22   23
Affiliations

Differential chromatin accessibility and transcriptional dynamics define breast cancer subtypes and their lineages

Michael D Iglesia et al. Nat Cancer. 2024 Nov.

Abstract

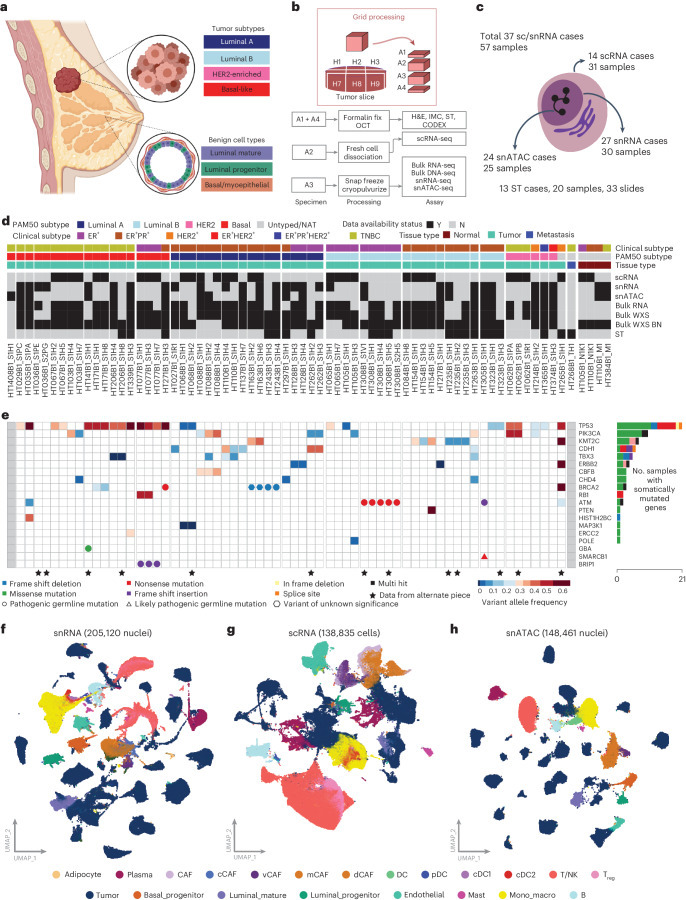
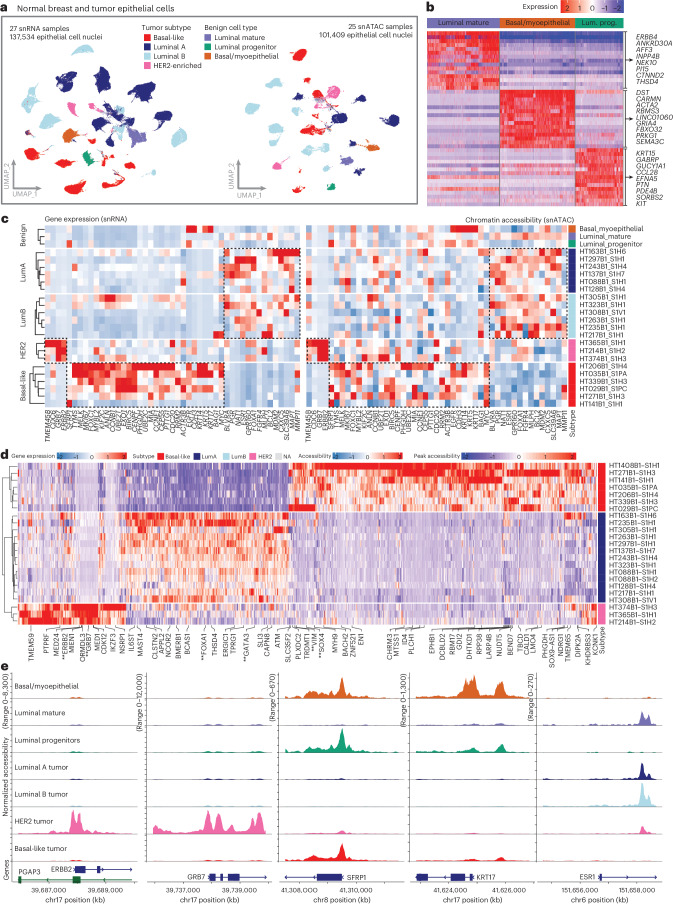
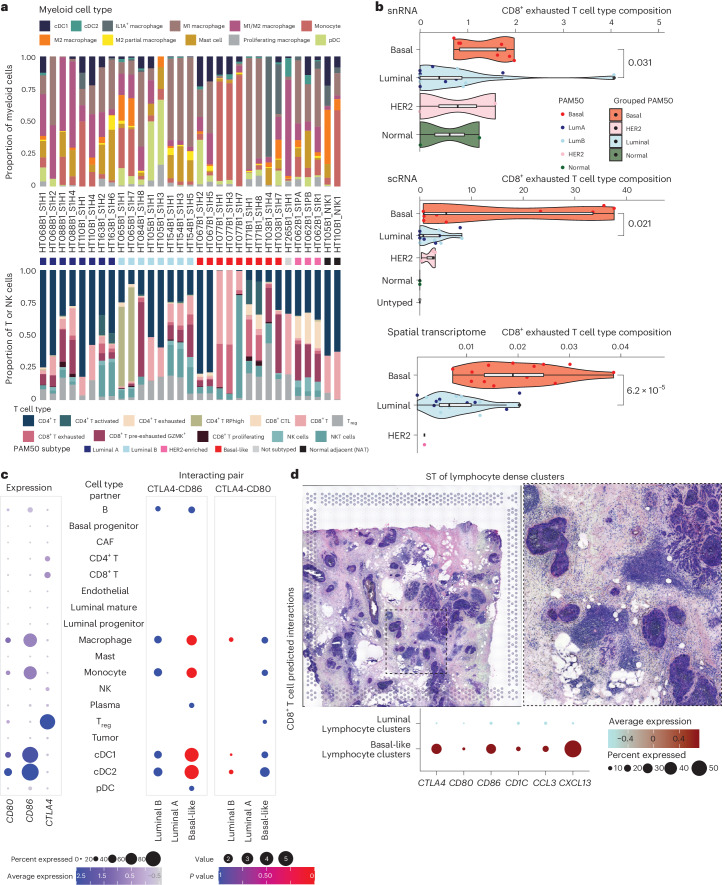
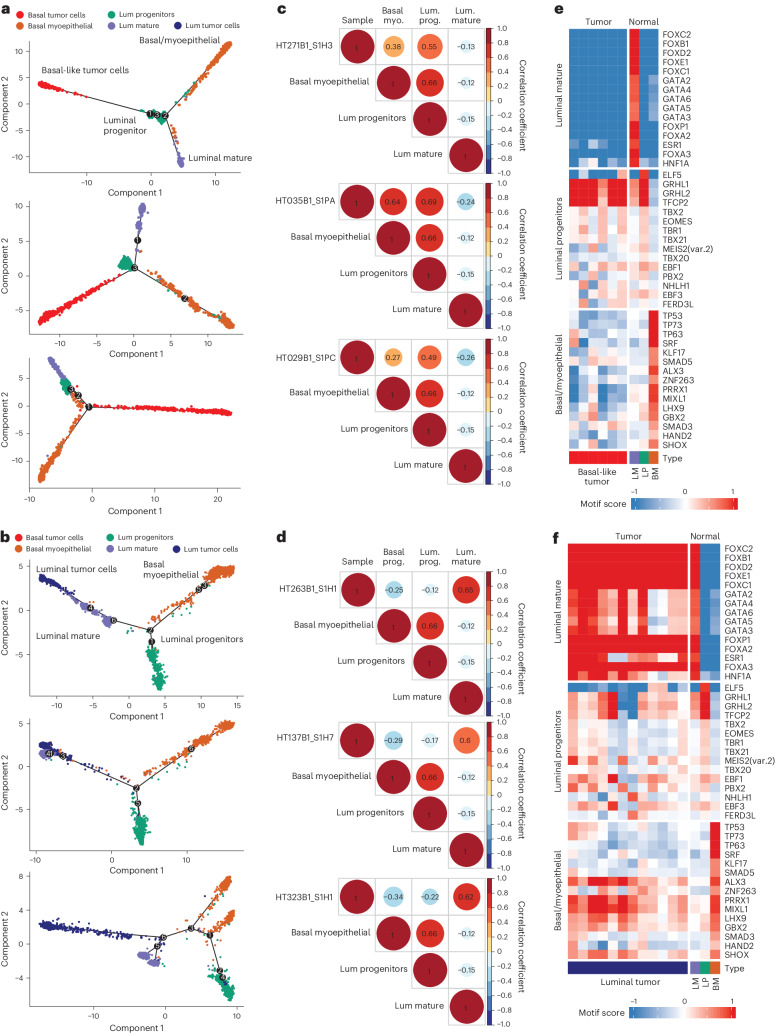
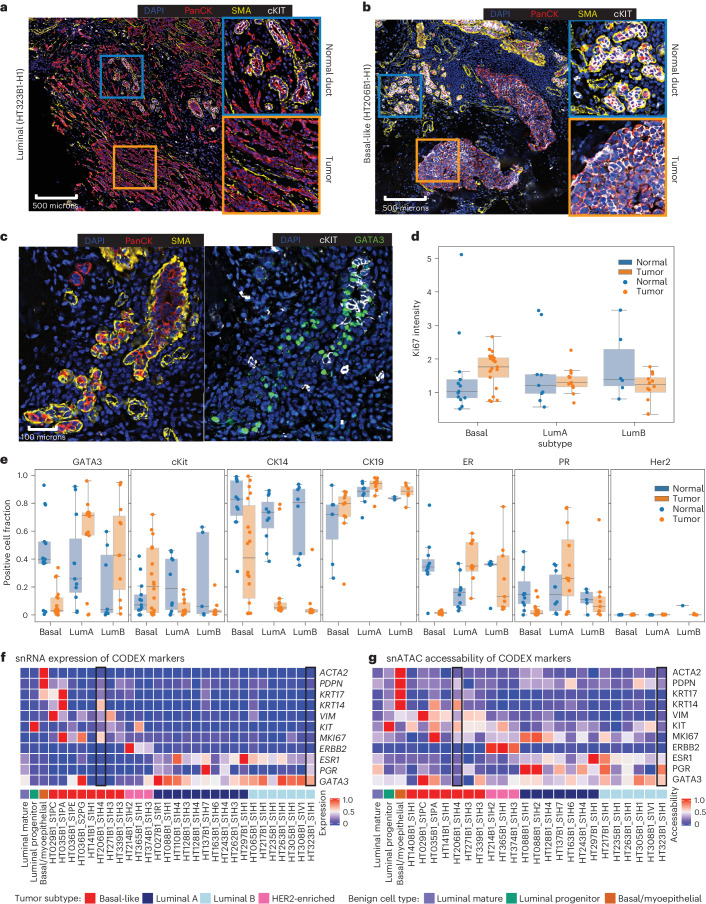
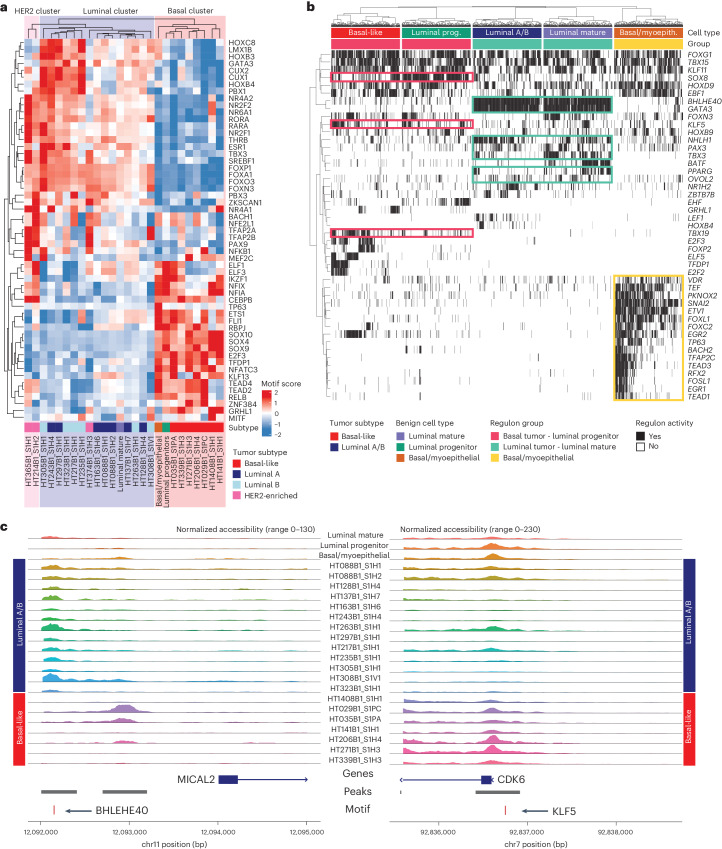
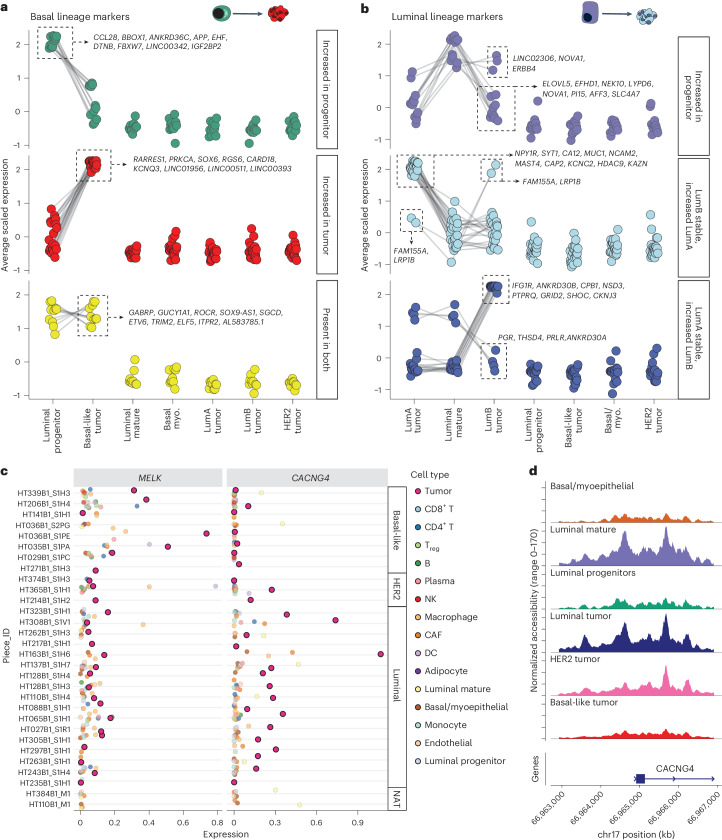
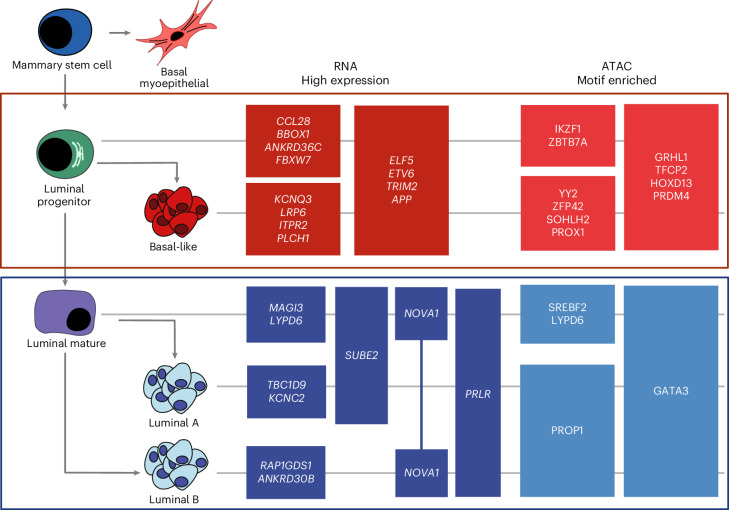
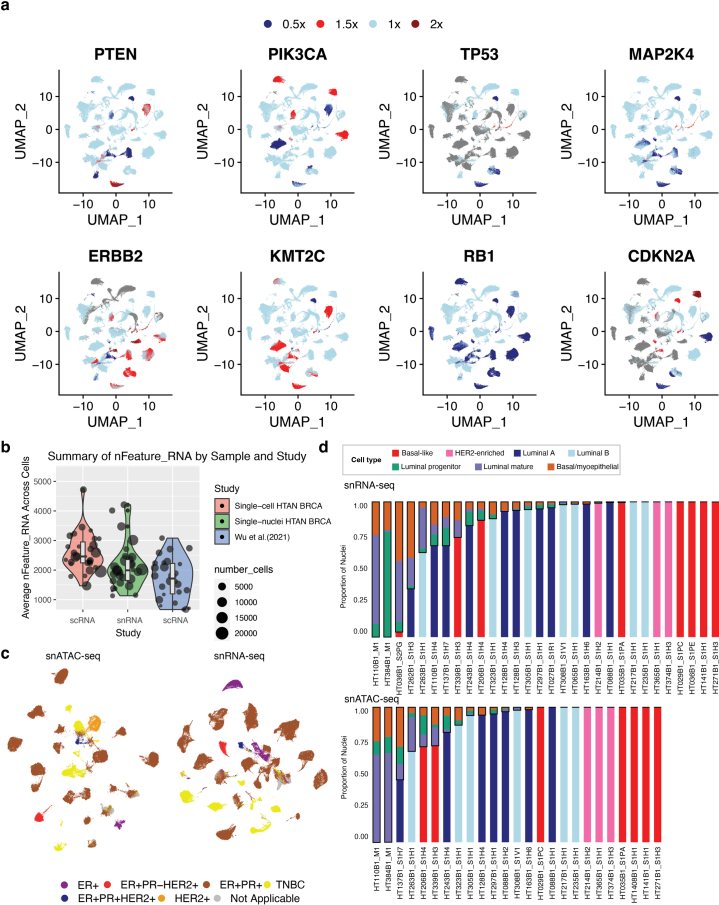
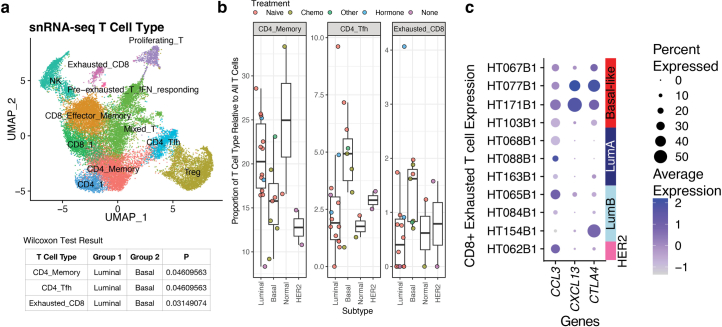
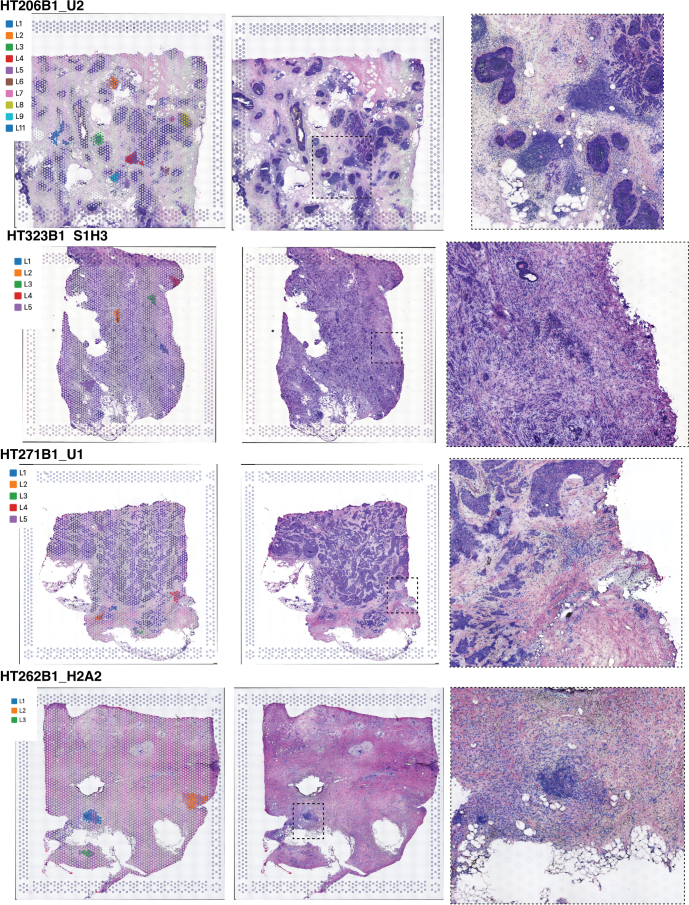
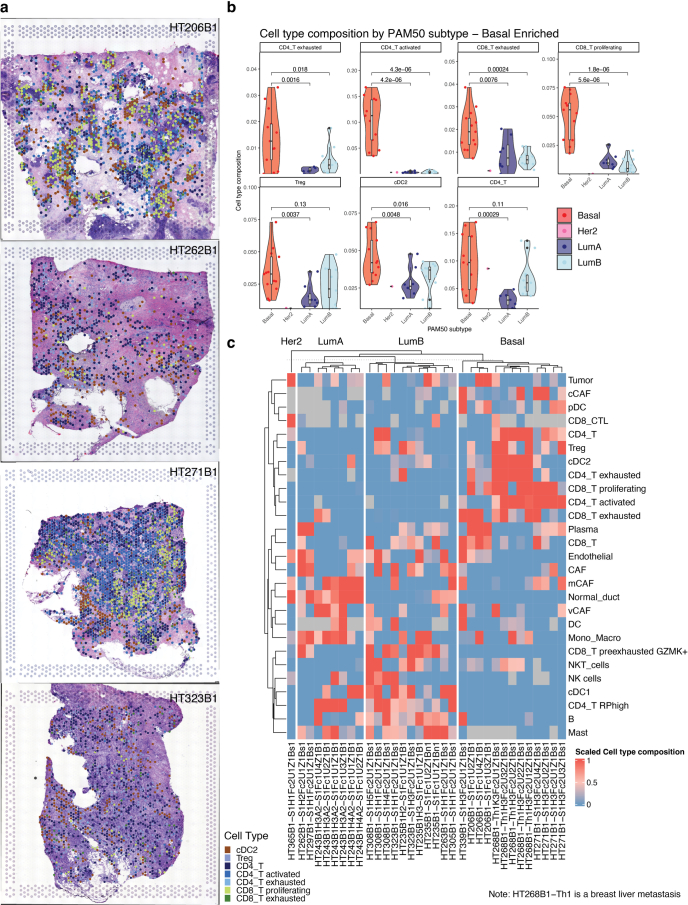
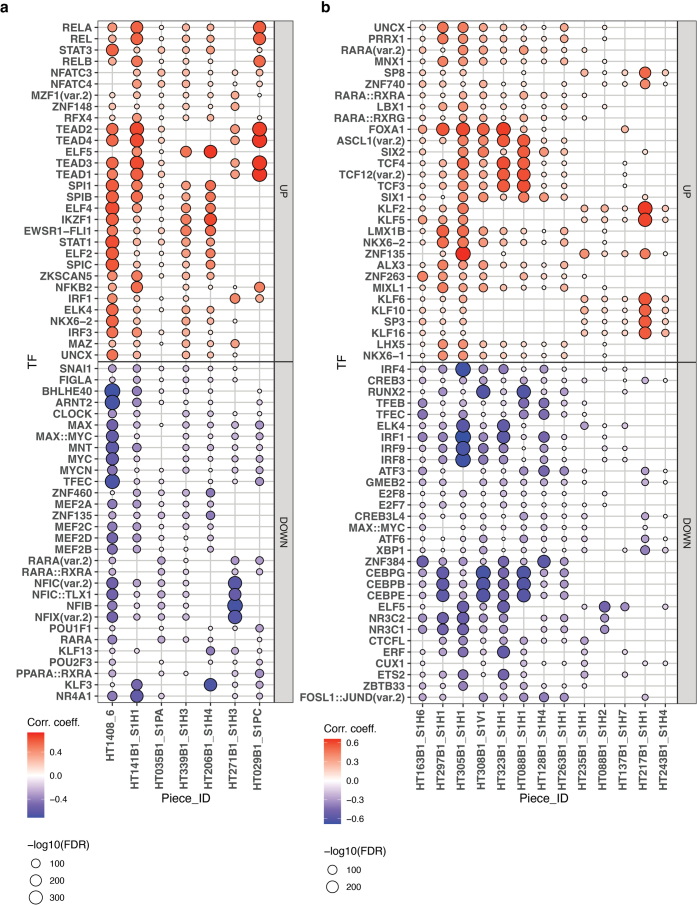
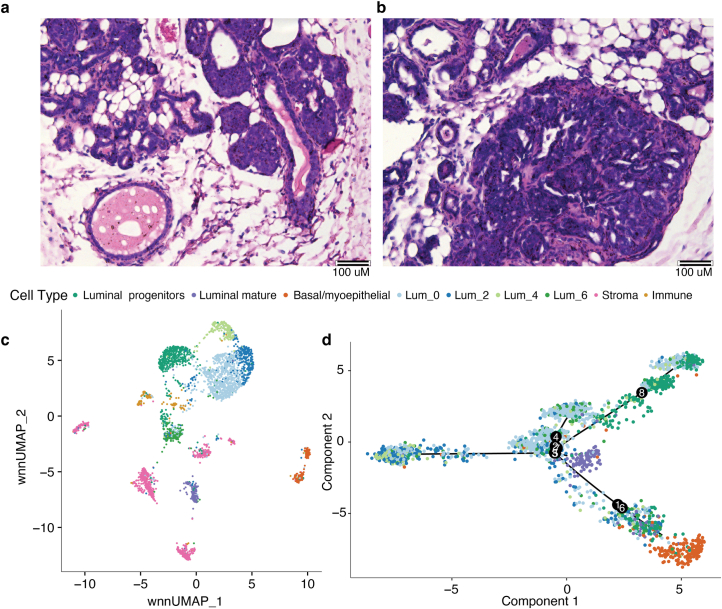
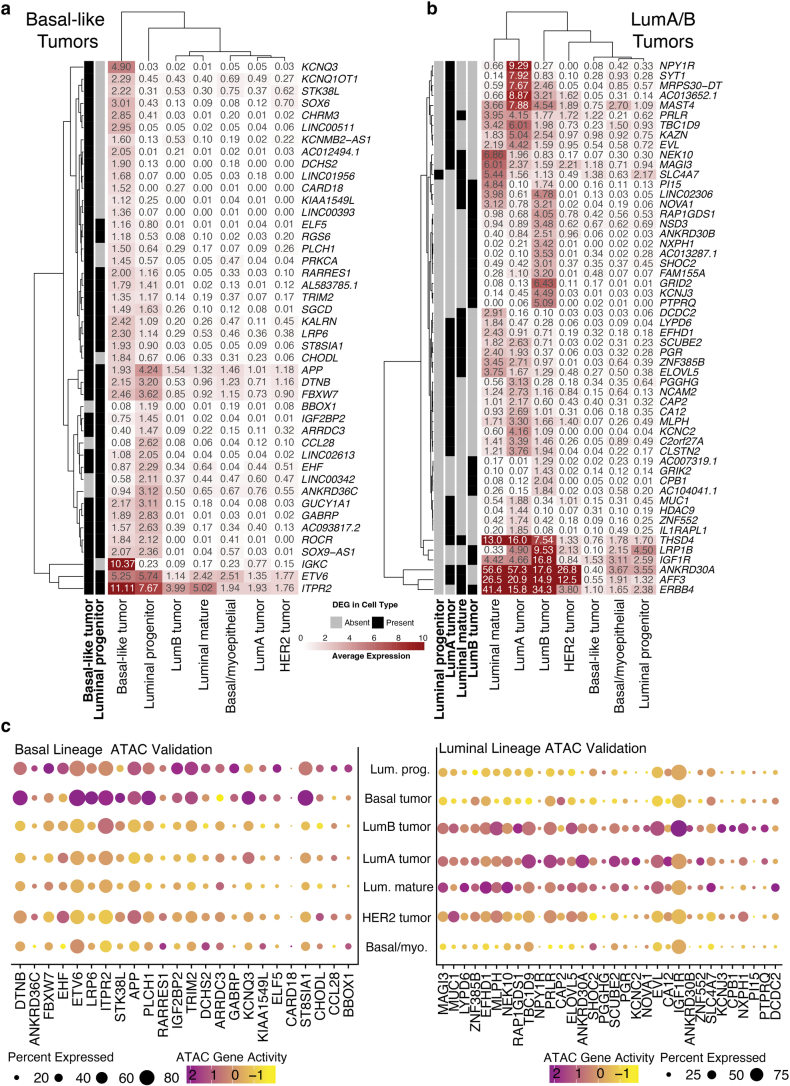
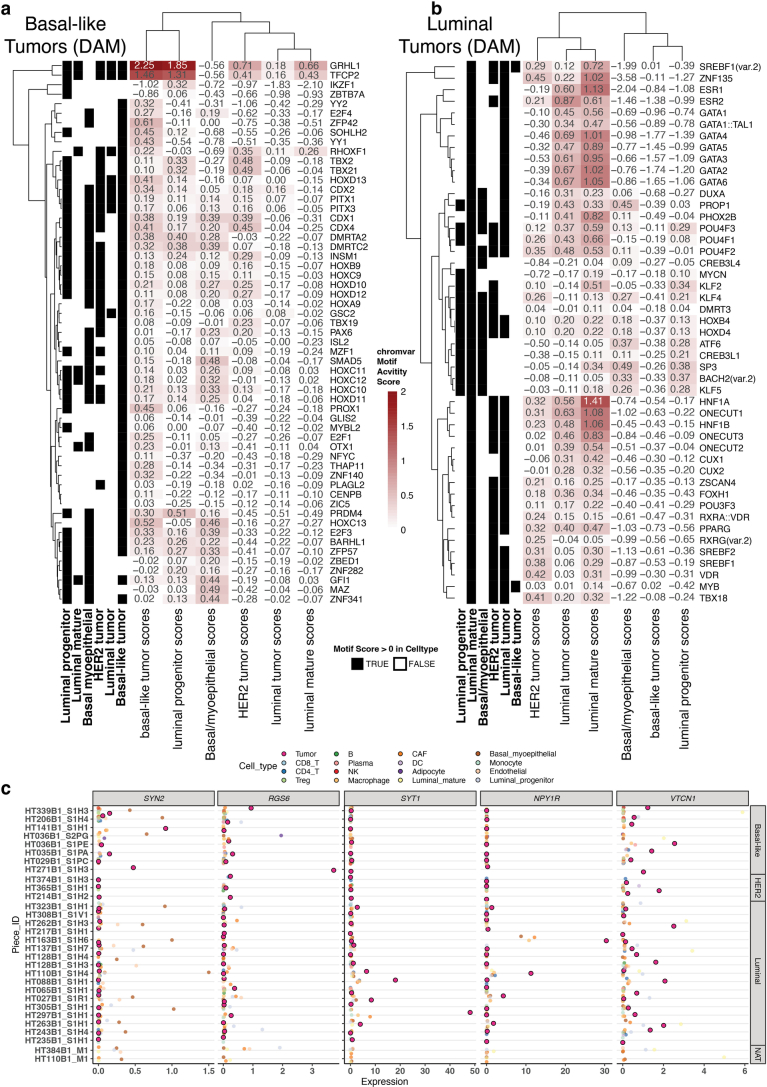
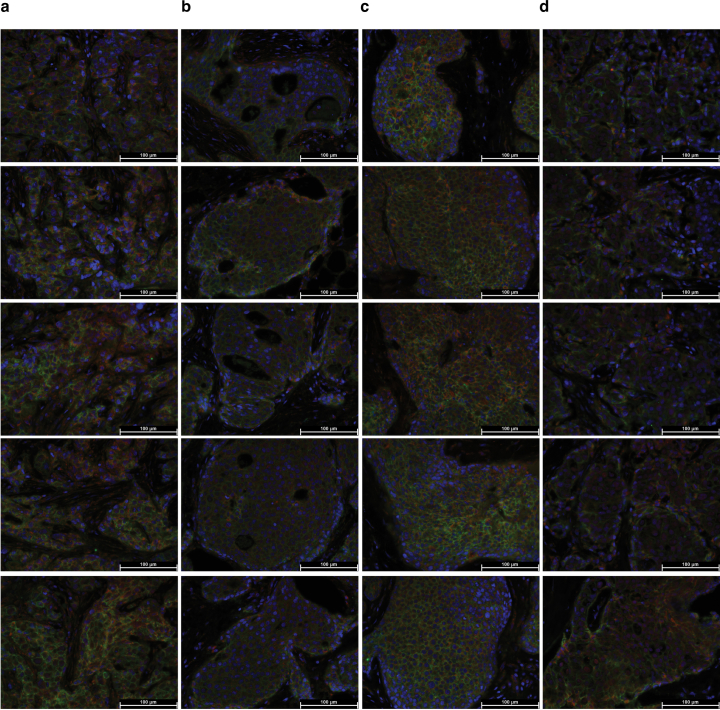
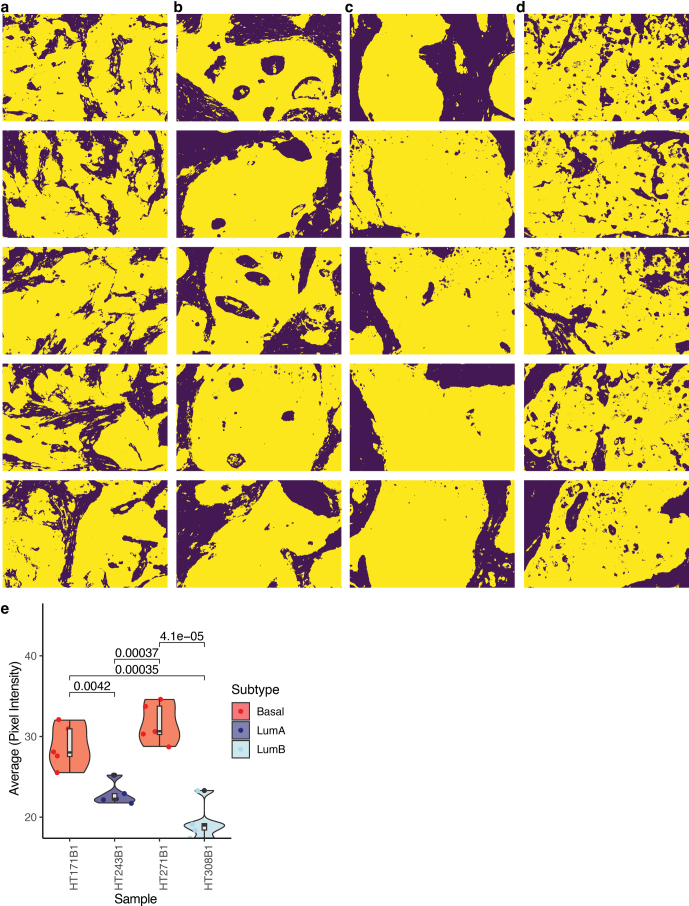
Breast cancer (BC) is defined by distinct molecular subtypes with different cells of origin. The transcriptional networks that characterize the subtype-specific tumor-normal lineages are not established. In this work, we applied bulk, single-cell and single-nucleus multi-omic techniques as well as spatial transcriptomics and multiplex imaging on 61 samples from 37 patients with BC to show characteristic links in gene expression and chromatin accessibility between BC subtypes and their putative cells of origin. Regulatory network analysis of transcription factors underscored the importance of BHLHE40 in luminal BC and luminal mature cells and KLF5 in basal-like tumors and luminal progenitor cells. Furthermore, we identify key genes defining the basal-like (SOX6 and KCNQ3) and luminal A/B (FAM155A and LRP1B) lineages. Exhausted CTLA4-expressing CD8+ T cells were enriched in basal-like BC, suggesting an altered means of immune dysfunction. These findings demonstrate analysis of paired transcription and chromatin accessibility at the single-cell level is a powerful tool for investigating cancer lineage and highlight transcriptional networks that define basal and luminal BC lineages.


Conflict of interest statement

Competing interests: The authors declare no competing interests.

Figures

Fig. 1
Fig. 1. Study design, data collected and genomic alterations.
a, Summary of benign breast duct cell types and BC subtypes. The image was created with BioRender.com. b, Sample grid processing method utilized in the study to perform various assays on each tumor sample systematically. c, Summary of data types available for single-cell, single-nucleus and ST processing. d, Data overview of the cohort of 61 samples. The N1K1 and M1 suffix denotes normal adjacent tumor samples. Clinical characteristics and data type availability are shown for each tumor piece. Data types include scRNA-seq, snRNA-seq, snATAC-seq, bulk-RNA-seq, ST and bulk WES of tumor and blood normal (BN). e, Genomic landscape of the sample cohort showing the top significantly mutated genes. Color scale in heatmap denotes VAF for each gene. All mutations are somatic, unless indicated by a colored circle/triangle/pentagon designating germline variants of different annotated significance. f, Uniform Manifold Approximation and Projection (UMAP) plots of all cell types for snRNA-seq data colored by cell types. g, UMAP plots of all cell types for single-cell RNA data colored by cell types. h, UMAP plots of all cell types for snATAC-seq data colored by cell types.
Fig. 2
Fig. 2. Tumor subtype and benign duct cell types.
a, UMAP plots of benign breast epithelial cells and BC cells for all snRNA (left) and snATAC (right) samples. Tumor cells colored by PAM50 subtype. b, Heatmap of top 15 DEGs in snRNA-seq data from benign breast duct cells. A subset of genes from each benign cell type is highlighted in the figure. c, Heatmaps of snRNA gene expression (left) and snATAC chromatin accessibility (right) for genes in the PAM50 subtyping assay. Average values are shown for all tumor cells per sample, as well as each benign breast duct cell type pooled across samples (top). Characteristic genes identifying luminal A/B, HER2-enriched and basal-like subtypes are shown in boxes. d, Peak accessibility for differentially accessible promoters by BC subtype in snATAC-seq data. Key subtype-associated genes are highlighted in bold and with two asterisks below. e, Coverage plots showing normalized chromatin accessibility across promoter regions of key subtype-associated genes in snATAC-seq data from tumor nuclei grouped by subtype and benign epithelial cell types.
Fig. 3
Fig. 3. Subtype-enriched elements of the tumor microenvironment.
a, Composition of myeloid immune subsets (top) and T/NK subsets (bottom) for each sample with scRNA-seq data. b, Proportion of Exhausted CD8+ T cells by subtype identified by snRNA-seq, scRNA-seq and ST. Each dot is the proportion of exhausted CD8+ T cells relative to other T cells for an individual piece for the snRNA and scRNA, whereas for the ST it is based on the proportion of total spots. The box-plots show the median with 1.5 × interquartile range whiskers. scRNA (basal, 9 samples, 4 cases; luminal, 16 samples, 8 cases; HER2, 3 samples, 1 case; normal, 2 samples, 2 cases; untyped, 1 sample, 1 case); snRNA (basal, 7 samples, 7 cases; luminal, 14 samples, 14 cases; HER2, 2 samples, 2 cases; normal, 2 samples, 2 cases); ST (basal,13 sections, 4 cases; luminal, 19 sections, 8 cases; HER2, 1 section, 1 case). A Wilcoxon test (default, two-sided) was used for all comparisons. c, Expression of three markers (CD80, CD86 and CTLA4) in the RNA (left). The size of the dot indicates the percentage of genes expressing the gene and the color indicates average expression. CellPhoneDB results indicating interacting gene partners in the scRNA-seq data (right). Size of dot indicates mean expression of interacting gene partners in their respective cell types and color indicates P value. d, Example of a lymphocyte-dense region in one sample of interest (top). A zoomed-in region of the left image, which we use to quantify the expression of various markers in the bottom panel (right). Expression of a subset of genes in lymphocyte-dense clusters isolated from ST data from luminal and basal cancers. The size of the dot indicates the percent of the spots included in the analysis that express the gene of interest and the color indicates average expression. Source data
Fig. 4
Fig. 4. Chromatin accessibility evidence for subtype-specific cell of origin.
a, Monocle pseudotime plots of tumor and benign breast duct cells from three representative basal-like BC samples. b, Monocle pseudotime plots of tumor and benign breast duct cells from three representative luminal BC samples. c, Correlation matrices for TF motif scores from tumor cells and benign duct cells for the BC samples in a. d, Correlation matrices for TF motif scores from tumor cells and benign duct cells for the BC samples in b. e, Heatmap of motif scores for the top 15 differentially accessible motifs identified in LM, LP and BP cells. Scores are shown for tumor cells from each basal-like snATAC-seq sample and for benign breast duct cells. f, Heatmap of motif scores for the top 15 differentially accessible motifs identified in LM, LP and BP cells. Scores are shown for tumor cells from each luminal snATAC-seq sample and for benign breast duct cells.
Fig. 5
Fig. 5. Spatial characterization of tumor subtype and normal ducts.
a, CODEX multiplex immunofluorescence on luminal sample HT323B1. Inset regions (square) are expanded to the right and colored by related inset. DAPI is stained in blue, PanCK in red, SMA in yellow and c-KIT in white. One replicate indicated in figure. b, CODEX multiplex immunofluorescence on basal sample HT206B1. Inset regions (squares) are expanded to the right and colored by related inset. DAPI is stained in blue, PanCK in red, SMA in yellow and c-KIT in white. One replicate is indicated. c, Section of CODEX immunofluorescence image from HT206B1 centered on a benign ductal region. Section on the left is stained with DAPI in blue, PanCK in red and SMA in yellow. The section on the right is stained with DAPI in blue, c-KIT in white and GATA3 in green. One replicate is indicated. d, Box-plot summarizing overall Ki67 intensity across all samples (49 sections and 21 samples) in normal duct and tumor regions separated by subtype. The box-plots show the median with 1.5 × interquartile range whiskers. e, Positive cell fraction of GATA3 (45 sections and 19 samples), c-Kit (42 sections and 17 samples), CD14 (44 sections and 20 samples), CK19 (27 sections and 8 samples), ER (39 sections and 14 samples), PR (39 sections and 14 samples) and Her2 (33 sections and 9 samples) across all samples in normal duct and tumor regions separated by subtype. f, Average expression scores of CODEX marker genes in the snRNA-seq data. Gene expression for samples HT206B1_S1H1 and HT323B1_S1H1 used for CODEX imaging are outlined. The box-plots show the median with 1.5 × interquartile range whiskers. g, Average chromatin accessibility scores of CODEX marker genes in snATAC-seq data. Chromatin accessibility for samples HT206B1_S1H1 and HT323B1_S1H1 used for CODEX imaging are outlined. Source data
Fig. 6
Fig. 6. Tumor lineage-specific regulators of gene expression.
a, Heatmap of differentially accessible motifs identified in tumor cell snATAC-seq data. Motif scores are shown for average value across tumor cells in each sample and for LP, LM and basal/myoepithelial cells pooled across all samples. b, Binarized heatmap of regulon activity in tumor-normal lineage groups. Color bars above show tumor/benign cell type and regulon group (basal-like BC and LP, luminal A/B BC and LM and basal myoepithelial). c, Coverage plots of normalized snATAC-seq accessibility across promoter regions for MICAL2 (left) and CDK6 (right). Regulon TF motifs and ATAC peak regions are shown below.
Fig. 7
Fig. 7. Differential markers of basal-like and luminal BC lineage.
a, Dot-plots showing average scaled expression of basal-like BC lineage markers. Markers are divided into genes expressed highly in LP cells but not in basal-like BC (top), genes with increased expression in basal-like BC compared to LP cells (middle) and genes high in both groups (bottom). Gene lists are shown for specific groups. b, Dot-plots showing average scaled expression of luminal A/B BC lineage markers. Markers are divided into genes expressed highly in LM cells but not in luminal BC (top), genes with increased expression in luminal A BC compared to LM cells (middle) and genes with increased expression in luminal B BC compared to LM cells (bottom). Dot size indicates average scaled gene expression. Gene lists are shown for specific groups. c, Gene expression across cell types of cell surface tumor-specific markers: MELK identified for basal samples and CACNG4 identified for luminal samples. d, Coverage plot of normalized snATAC-seq chromatin accessibility across the promoter region of CACNG4 for tumor subtypes and benign breast cell types.
Fig. 8
Fig. 8. Proposed model of BC subtype progression.
Model of proposed cell of origin for subtypes of BC, with key lineage-specific TF motifs and lineage defining expression markers annotated. Cell schematics were created with BioRender.com.
Extended Data Fig. 1
Extended Data Fig. 1. InferCNV, nFeature count and epithelial cell type distribution.
a) UMAP plots of copy number events from inferCNV mapped to epithelial cells derived from snRNA data. b) Violin plot of the average nFeature_RNA detected across each sample across three cohorts (one external dataset Wu et al. 2021 and two internal HTAN cohorts). Size of dots indicate the number of cells detected for each sample and box-plot is overlaid on violin plot (scRNA HTAN BRCA n = 31 samples (from 14 cases), snRNA HTAN BRCA n = 30 samples (from 27 cases), scRNA Wu et al. n = 26 samples). The boxplots show the median with 1.5 × interquartile range whiskers. c) UMAP representations of epithelial subsets for snATAC and snRNA samples colored by clinical subtype. d) (Left) Barplots indicating proportion of epithelial nuclei per sample identified for the snRNA-seq data. (Right) Barplots indicating proportion of epithelial nuclei per sample identified for the snATAC-seq data. Source data
Extended Data Fig. 2
Extended Data Fig. 2. Exhausted CD8 T cell analysis in snRNA-seq data.
a) UMAP of T cells identified in snRNA-seq data. Cells are colored by cell types. b) Boxplots show the proportion of T cell types relative to all T cells for each piece of tissue separated by subtype and by T cell type. Each point is colored by Treatment Status. The boxplots show the median with 1.5 × interquartile range whiskers. Sample numbers for the box-plot include the following CD4 memory (Luminal: 14 samples, 4 cases; Basal: 7 samples, 7 cases; Normal: 2 samples, 2 cases; HER2: 2 samples, 2 cases), CD4_Tfh(Luminal: 14 samples, 14 cases; Basal: 7 samples, 7 cases; Normal: 2 samples, 2 cases; HER2: 2 samples, 2 cases), Exhausted_CD8 (Luminal: 14 samples, 14 cases; Basal: 7 samples, 7 cases; Normal: 2 samples, 2 cases; HER2: 2 samples, 2 cases).Table labeled Wilcoxon test result shows the P value associated with the comparison of proportions of T cells between Group 1 and Group 2. c) Plots showing expression of CCL3, CTLA4, and CXCL13 in Exhausted CD8+ T cells. Size of dot indicates % of cells expressing the gene of interest while color indicates average expression. Source data
Extended Data Fig. 3
Extended Data Fig. 3. Lymphocyte dense regions in spatial transcriptomics data.
Each row indicates a section of a different sample. Left image indicates the lymphocyte dense clusters (L1-LX) selected for evaluating gene expression differences between subtypes. Middle image is the H&E with a region indicated in dashed box that is zoomed in on the right plot to show how we identified lymphocyte dense regions for our analysis.
Extended Data Fig. 4
Extended Data Fig. 4. Spatial mapping of snRNA-seq cell types to Spatial Transcriptomics Data using CytoSPACE.
a) CytoSPACE mapping results of CD4, CD8, Treg and cDC2 to a subset of luminal and basal samples. b) Violin plots of cell type composition of basal enriched cell types. Each grouped violin is separated by cell type and subtype. P-values are derived from stat_compare_means using the method = t.test. The boxplots show the median with 1.5 × interquartile range whiskers. For all box-plot sample numbers are as follows: Luminal 19 samples, 8 cases; Basal 13 samples, 4 cases; Her2 1 samples, 1 case. c) The heatmap represents the scaled cell type proportion across all breast spatial transcriptomic samples. Source data
Extended Data Fig. 5
Extended Data Fig. 5. TF motifs and pseudotime correlation.
a) Correlation of TF motifs’ scores with pseudotime from precursors to tumor cells from basal-like samples. Color of dot indicates correlation coefficient of each TF separated by sample while the size relates to significance (by FDR). b) Correlation of TF motifs’ scores with pseudotime from precursors to tumor cells from luminal samples.
Extended Data Fig. 6
Extended Data Fig. 6. Histology and snATAC data from MMTV-PyMT model.
a) H&E mouse mammary glands at 12 weeks indicating normal ducts and cancer cells. One replicate indicated in figure. b) A second H&E of mouse mammary glands at 12 weeks indicating normal ducts and cancer cells. One replicated indicated in figure. c) UMAP of single-nucleus ATAC-seq data from mouse model. Points are colored by cell type. d) Monocle trajectory analysis of epithelial derived cells from snATAC-seq data. Each point is colored by cell type.
Extended Data Fig. 7
Extended Data Fig. 7. Differential gene expression (DEG) analysis by epithelial lineage.
a) Average expression of differentially expressed genes specific to the basal tumor and/or luminal progenitor cell types. Columns labeled Basal_tumor and Luminal_progenitor indicate whether the gene was identified as a DEG for the respective cell type listed. Heatmap is colored and labeled by average expression of each epithelial cell type for comparison. b) Average expression of differentially expressed genes specific to the Luminal cell types, including: Luminal A tumor, Luminal B tumor, Luminal Mature or Luminal Progenitor. Columns labeled Luminal_progenitor, LumA_tumor, Luminal_mature, LumB_tumor indicate whether the gene was identified as a DEG for the respective cell type listed. Heatmap is colored and labeled by average expression of each epithelial cell type for comparison. c) Dot plot of signac ATAC gene activity values of basal (left) and luminal (right) lineage markers discovered by expression in snRNA-seq data. Data is colored by activity value and size of dot is associated with percent of cells with the associated average gene activity score.
Extended Data Fig. 8
Extended Data Fig. 8. Differentially Accessible Motifs (DAM) analysis by epithelial lineage and cell-surface tumor-specific markers.
a) Average chromvar motif activity score enriched in the basal tumor and/or luminal progenitor cell types. Columns labeled luminal progenitor (LP), luminal mature (LM), basal myoepithelial (myo), Her_tumor, Lum_tumor and Basal_tumor indicate whether the gene was identified as having a motif score greater than 0 for the respective cell type listed. Heatmap is colored and labeled by the motif activity score of each epithelial cell type for comparison. b) Average chromvar motif activity score enriched in the luminal tumors and/or luminal mature cell types. Columns labeled luminal progenitor (LP), luminal mature (LM), basal myoepithelial (myo), Her_tumor, Lum_tumor and Basal_tumor indicate whether the gene was identified as having a motif score greater than 0 for the respective cell type listed. Heatmap is colored and labeled by the motif activity score of each epithelial cell type for comparison. c) For each gene identified as a tumor-specific marker (SYN2, RGS6, SYT1, NPY1R and VTCN1) we have indicated the average expression of the gene listed in each cell type population showing an enrichment in the tumor and progenitor populations relative to other cell types.
Extended Data Fig. 9
Extended Data Fig. 9. Immunofluorescence images of MELK.
a) Immunofluorescence (IF) images of 5 representative regions of HT171B1, b) HT243B1, c) HT271B1, and d) HT308B1. One replicate of each indicated in figures. For all images green channel is e-cadherin, blue is DAPI and red is MELK.
Extended Data Fig. 10
Extended Data Fig. 10. Masks associated with Immunofluorescence images of MELK.
a) Masks of the immunofluorescence (IF) images of 5 representative regions of HT171B1, b) HT243B1, c) HT271B1, and d) HT308B1. One replicate of each is indicated in figures. Masks were generated based on the e-cadherin staining using adaptive thresholding. e) Violin plot of the average pixel intensity of each representative image from the 4 samples. P value indicated comparing the basal samples to luminal samples are derived from stat_compare_means using the method = t.test (two-sided). The boxplots show the median with 1.5 × interquartile range whiskers. For each sample, intensity from 5 regions each are indicated in the box-plot. Source data

Update of

  • Differential chromatin accessibility and transcriptional dynamics define breast cancer subtypes and their lineages.
    Iglesia MD, Jayasinghe RG, Chen S, Terekhanova NV, Herndon JM, Storrs E, Karpova A, Zhou DC, Al Deen NN, Shinkle AT, Lu RJ, Caravan W, Houston A, Zhao Y, Sato K, Lal P, Street C, Rodrigues FM, Southard-Smith AN, Targino da Costa ALN, Zhu H, Mo CK, Crowson L, Fulton RS, Wyczalkowski MA, Fronick CC, Fulton LA, Sun H, Davies SR, Appelbaum EL, Chasnoff SE, Carmody M, Brooks C, Liu R, Wendl MC, Oh C, Bender D, Cruchaga C, Harari O, Bredemeyer A, Lavine K, Bose R, Margenthaler J, Held JM, Achilefu S, Ademuyiwa F, Aft R, Ma C, Colditz GA, Ju T, Oh ST, Fitzpatrick J, Hwang ES, Shoghi KI, Chheda MG, Veis DJ, Chen F, Fields RC, Gillanders WE, Ding L. Iglesia MD, et al. bioRxiv [Preprint]. 2023 Nov 2:2023.10.31.565031. doi: 10.1101/2023.10.31.565031. bioRxiv. 2023. Update in: Nat Cancer. 2024 Nov;5(11):1713-1736. doi: 10.1038/s43018-024-00773-6. PMID: 37961519 Free PMC article. Updated. Preprint.

References

    1. DeSantis, C. E. et al. Breast cancer statistics, 2019. CA Cancer J. Clin.69, 438–451 (2019). - PubMed
    1. Waks, A. G. & Winer, E. P. Breast cancer treatment: a review. JAMA321, 288–300 (2019). - PubMed
    1. Visvader, J. E. & Stingl, J. Mammary stem cells and the differentiation hierarchy: current status and perspectives. Genes Dev.28, 1143–1158 (2014). - PMC - PubMed
    1. Van Keymeulen, A. et al. Distinct stem cells contribute to mammary gland development and maintenance. Nature479, 189–193 (2011). - PubMed
    1. Bach, K. et al. Differentiation dynamics of mammary epithelial cells revealed by single-cell RNA sequencing. Nat. Commun.8, 2128 (2017). - PMC - PubMed

Publication types