. 2024 Nov;5(11):1697-1712.
doi: 10.1038/s43018-024-00823-z. Epub 2024 Oct 30.

Global loss of promoter-enhancer connectivity and rebalancing of gene expression during early colorectal cancer carcinogenesis

Affiliations

Global loss of promoter-enhancer connectivity and rebalancing of gene expression during early colorectal cancer carcinogenesis

Yizhou Zhu et al. Nat Cancer. 2024 Nov.

Erratum in

Abstract

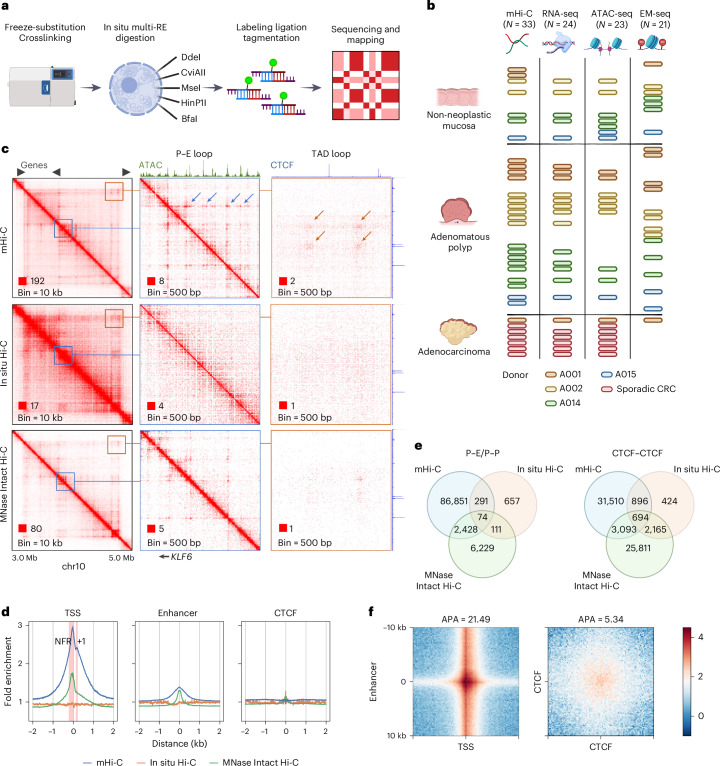
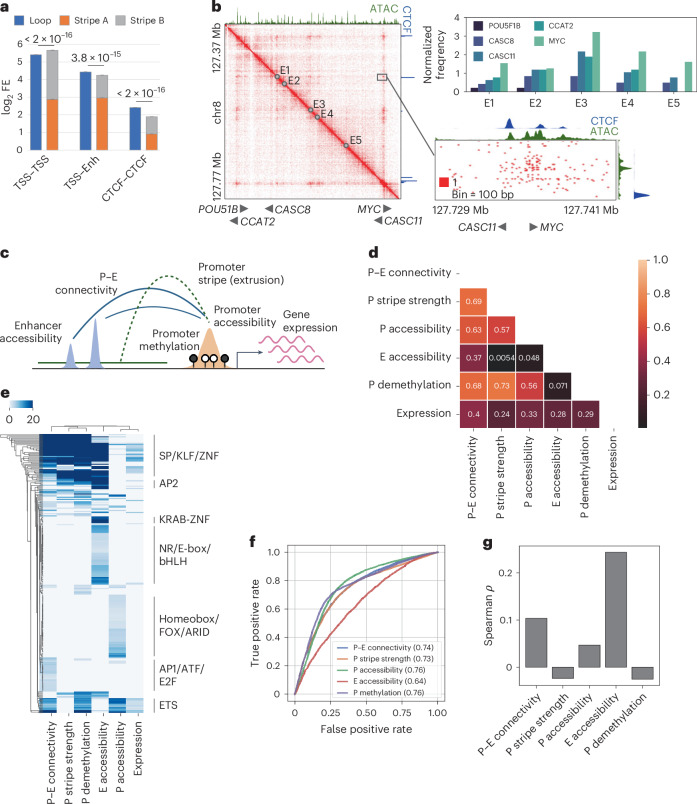
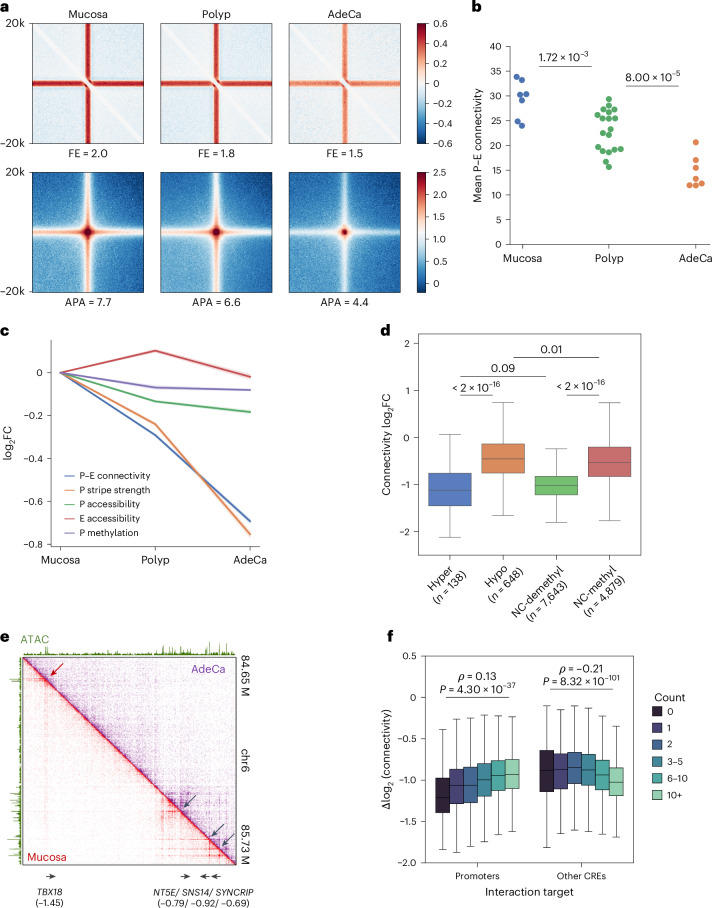
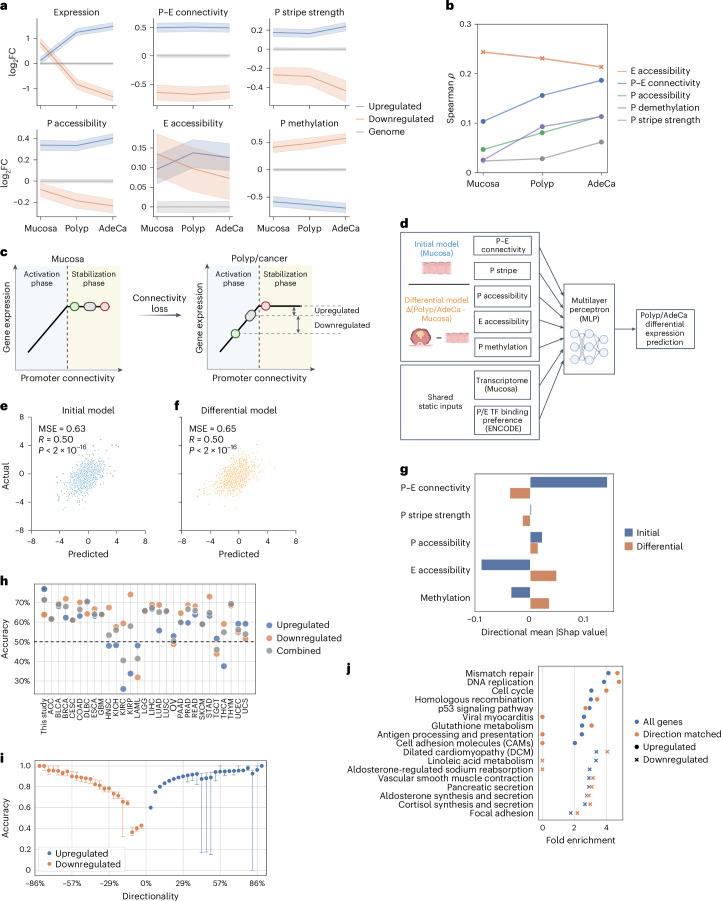
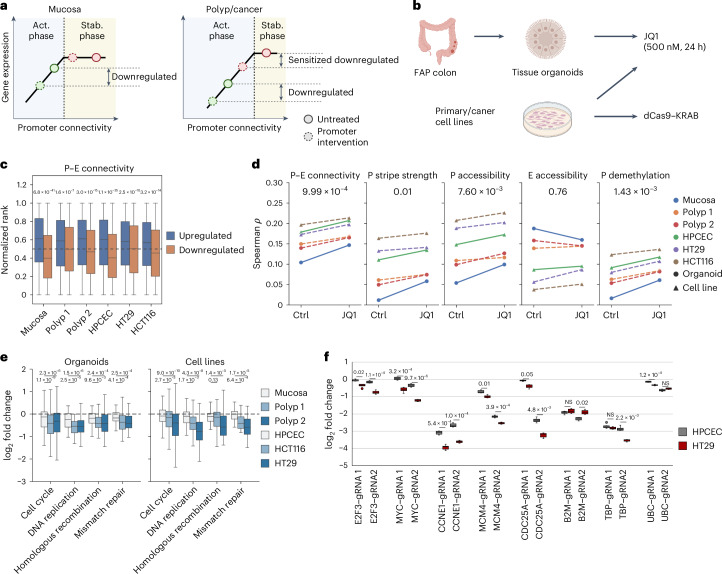
Although three-dimensional (3D) genome architecture is crucial for gene regulation, its role in disease remains elusive. We traced the evolution and malignant transformation of colorectal cancer (CRC) by generating high-resolution chromatin conformation maps of 33 colon samples spanning different stages of early neoplastic growth in persons with familial adenomatous polyposis (FAP). Our analysis revealed a substantial progressive loss of genome-wide cis-regulatory connectivity at early malignancy stages, correlating with nonlinear gene regulation effects. Genes with high promoter-enhancer (P-E) connectivity in unaffected mucosa were not linked to elevated baseline expression but tended to be upregulated in advanced stages. Inhibiting highly connected promoters preferentially represses gene expression in CRC cells compared to normal colonic epithelial cells. Our results suggest a two-phase model whereby neoplastic transformation reduces P-E connectivity from a redundant state to a rate-limiting one for transcriptional levels, highlighting the intricate interplay between 3D genome architecture and gene regulation during early CRC progression.


Conflict of interest statement

Competing interests: G.K., A.J., D.L. and Z.S. are employees and shareholders of Ultima Genomics. M.P.S is a cofounder and scientific advisor of Personalis, Qbio, SensOmics, January AI, Mirvie, Protos, NiMo and Onza and is on the advisory board of Genapsys. E.D.E. is an employee and stockholder of Invitae and an advisor and stockholder of Taproot Health and Exir Bio. W.J.G. has affiliations with Guardant Health (consultant and scientific advisory board), Protillion Biosciences (Scientifica cofounder) and 10x and has licensed patents associated with ATAC-seq. All other authors declare no competing interests.

Figures

Fig. 1
Fig. 1. mHi-C reveals interactions associated with active CREs.
a, Schematic representation of the mHi-C workflow. b, Summary of colon tissue samples analyzed by multiomics assays. Bar colors represent different donors. Each row corresponds to a unique donor with sporadic CRC. The number of biospecimens examined by each assay: n = 33 for mHi-C, n = 24 for RNA-seq, n = 23 for ATAC-seq and n = 21 for EM-seq. c, Comparison of contact matrices generated from mHi-C (combined colon tissues) with in situ Hi-C (HCT116) and MNase-digested Intact Hi-C (HCT116) at various resolutions. Blue arrows highlight interaction dots formed between the KLF6 promoter and adjacent enhancers. Orange arrows show structural loops at TAD boundaries. d, Venn diagrams illustrating the overlap of interaction loops identified by the three methods. e, Average fold enrichment (FE) of distal interactions at TSSs, active enhancers and CTCF-binding sites in mucosa samples. Red intervals indicate the nucleosome-free region (NFR) and the +1 nucleosome regions upstream and downstream of the TSS, respectively. f, APA of loops between promoters and active enhancers (n = 9,174) and between CTCFs (n = 30,208). Source data
Fig. 2
Fig. 2. Correlation between promoter stripe formation and P–E connectivity.
a, Comparison of mean loop strengths with the logarithmic sum of mean stripe strengths at the anchors for loops formed between different regulatory elements. Error bars represent confidence intervals. Statistical significance was assessed using the Wilcoxon signed-rank test. b, Contact heat map (combined colon tissues) of the MYC upstream cancer risk locus. Top right, contact frequencies of resident genes with the five putative enhancers exhibiting the highest distal interaction activity. Bottom right, a detailed view of contact distribution between enhancer E1 and the MYC and CASC11 genes. c, Schematic representation of the integration of conformational, epigenetic and transcriptional features for downstream analysis. d, Spearman correlation matrix of average feature strengths in mucosa samples for all examined coding genes (n = 14,692). e, Hierarchical clustering of genes exhibiting top 10% intensity for any of the six examined features, based on the degree of motif enrichment (adjusted −log10(P value)) on their promoters. f, ROC analysis for predicting actively expressed genes (TPM > 0.5, n = 10,663) using various structural and epigenetic features. Numbers indicate the AUC scores. g, Spearman correlation of the expression levels of actively expressed genes with the examined features. Source data
Fig. 3
Fig. 3. Loss of distal connectivity in polyps and adenocarcinoma.
a, APA of all stripe (top) and loop (bottom) anchors, with FE of signals indicated below the panels. b, Mean P–E connectivity for coding genes in mucosa, polyp and adenocarcinoma samples. The sample sizes of each stage: n = 7 for mucosa, n = 19 for polyp and n = 7 for adenocarcinoma. The P values for stage comparisons were determined by the Mann–Whitney U-test. Mucosa versus polyp, P = 1.72 × 10−3; polyp versus adenocarcinoma, P = 8.00 × 10−5. c, Average log2 fold changes of structural and epigenetic features in polyps and adenocarcinoma, with confidence intervals represented by shaded areas. d, Changes in connectivity between mucosa and adenocarcinoma for genes categorized by hypermethylation, hypomethylation or no change (NC, <5% difference) in methylation status. Groups with demethylated (<25%) and methylated (>40%) promoters are compared. The number of promoters in each category: n = 138 for hypermethylated, n = 648 for hypomethylated, n = 7,643 for NC-demethylated and n = 4,879 for NC-methylated. e, Comparison of contact heat maps for a representative locus in mucosa and adenocarcinoma samples, with log2 connectivity changes for gene promoters indicated below. f, Comparison of connectivity changes for genes (n = 9,901) interacting with varying numbers of promoters and other CREs, including Spearman correlation coefficients and P values from the Mann–Whitney U-test. Source data
Fig. 4
Fig. 4. Predictable cancer gene dysregulation by initial P–E connectivity.
a, Mean relative fold changes of features for genes upregulated (n = 1,089) or downregulated (n = 944) in both polyps and adenocarcinoma, compared to the genome average at each stage, with confidence intervals shown as shaded areas. b, Spearman correlations between transcription levels of active genes (TPM > 0.5) and their structural and epigenetic features at different stages of progression. c, Schematics for the two-phase model. In normal conditions, most genes are in the saturated stabilization phase, where increased levels of P–E connectivity stabilize the networks but do not contribute to higher gene expression. In polyp and cancer conditions, genes shift to the activation phase because of global losses of the connectivity, where expression levels are rate-limited by the connectivity levels. Alterations of gene expression during stage progression are, therefore, determined by their initial distance to the activation phase at normal condition. d, Diagram illustrating the construction of initial and differential prediction models. e,f, Predictive accuracy of the initial model for gene expression changes (r = 0.50, P < 2 × 10−16) in polyps (e) and the differential model (r = 0.50, P < 2 × 10−16) (f) for a test set of genes (n = 2,800). g, The importance of features and the average direction of association of structural and epigenetic features in the predictive models. h, Accuracy of the initial mucosa–polyp model in predicting the direction of significant expression changes in 28 cancer types from TCGA database. i, Prediction accuracy for genes (n = 13,239) grouped by their directionality scores. Whiskers indicate 1.5× the interquartile range. j, Pathway ontology analysis for genes with altered expression in any TCGA cancer type versus those with accurately predicted directional changes by the initial model. Zero values indicate no significant enrichment (FDR > 0.1). Source data
Fig. 5
Fig. 5. Two-phase model predicts gene- and polyp/cancer-specific sensitivity to inhibitions.
a, Schematic representing the prediction model. Low-connectivity genes (green dots) are vulnerable to perturbations in the activation phase, independent of overall connectivity levels. Conversely, genes with high connectivity exhibit stage-specific sensitivity to perturbations as they approach the phase transition threshold because of connectivity loss. b, Diagram of experimental designs for assessing gene expression sensitivity to various interventions. c, Comparisons of distribution of P–E connectivity levels in unaffected mucosa for genes upregulated (n = 5,504) or downregulated (n = 7,028) after JQ1 treatment of samples. P values for significance were determined by the Mann–Whitney U-test. Organoid (mucosa), P = 6.8 × 10−41; organoid (polyp 1), P = 1.6 × 10−7; organoid (polyp 2), P = 3.0 × 10−16; HPCEC, P = 1.1 × 10−35; HT29, P = 2.5 × 10−10; HCT16, P = 3.2 × 10−14. d, Spearman correlation between structural and epigenetic features in mucosa and gene expression levels in cell lines and organoids before and after JQ1 treatment. P values for significance from the Wilcoxon signed-rank test are indicated. P–E connectivity, P = 9.99 × 10−4; promoter stripe strength, P = 0.01; promoter accessibility, P = 7.60 × 10−3; enhancer accessibility, P = 0.76; promoter demethylation, P = 1.43 × 10−3. e, Expression fold change distributions for genes (n = 205) in specified pathways following JQ1 treatment. P values for sample differential responses from the Wilcoxon signed-rank test are denoted. Respective P values for comparisons between mucosa organoid and two polyps: 1.1 × 10−9 and 2.3 × 10−6 for cell cycle, 2.5 × 10−5 and 1.5 × 10−6 for DNA replication, 9.6 × 10−3 and 2.4 × 10−4 for homologous recombination and 4.1 × 10−4 and 2.5 × 10−4 for mismatch repair. Respective P values for comparisons between HPCEC and HT29/HCT116 cell lines: 2.7 × 10−3 and 9.0 × 10−10 for cell cycle, 1.7 × 10−3 and 4.3 × 10−8 for DNA replication, 0.13 and 1.4 × 10−5 for homologous recombination and 6.4 × 10−4 and 1.7 × 10−5 for mismatch repair. f, Differential gene expression following Cas9–KRAB-mediated repression using two gRNAs in primary human colon epithelial cells (HPCEC) and the HT29 colorectal adenocarcinoma cell line. Measurements were repeated for cells cultured separately (n = 8). The significance of differential responses was assessed by a two-sample t-test followed by Bonferroni correction. Respective adjusted P values for gRNA1 and gRNA2: 0.02 and 1.1 × 10−4 for E2F3, 3.2 × 10−4 and 9.6 × 10−6 for MYC, 5.4 × 10−4 and 1.0 × 10−4 for CCNE1, 0.01 and 3.9 × 10−4 for MCM4, 0.05 and 4.8 × 10−3 for CDC25A, NS and 0.02 for B2M, NS and 2.2 × 10−3 for TBP and 1.2 × 10−4 and NS for UBC. Source data
Extended Data Fig. 1
Extended Data Fig. 1. Summary statistics of mHi-C.
(a) Fragment size distribution of human genome (hg38) digested by the indicated restriction enzymes and their combination. Restriction site count: DdeI=4.95E6, CviAII=4.59E6, BfaI=2.66E6, MseI=5.82E6, HinP1I = 6.60E5, combined=1.91E7. (b) Frequency of intrachromosomal interactions by genomic distance for various sample types. (c) Count of unique interaction contacts identified across samples. Source data
Extended Data Fig. 2
Extended Data Fig. 2. Comparison of mHi-C with in situ Hi-C and MNase-digested Intact Hi-C at diverse resolutions.
Upper panel shows contact heatmaps of three genomic loci obtained by these methods at indicated bin resolution. Annotated genes, open chromatin regions, CTCF binding sites, as well as architectural stripes and loops called from mHi-C are indicated in the lower panel.
Extended Data Fig. 3
Extended Data Fig. 3. mHi-C delineates interaction features at active CREs.
(a) Aggregated read intensity of long- (>1.5 kb) and short-range (<1.0 kb) interactions before and (b) after normalizing against total coverage (All range) at distinct CRE categories. (c) Classification and annotation of identified stripes and loops in colon samples by regulatory element types. (d) Proportion of loops composed of two stripe anchors (S-S), between a stripe anchor and a non-stripe anchor (S-NS), and two non-stripe anchors (NS-NS). (e) Aggregated ChIP-seq signals for Pol II, SMC3, Rad21, and ATAC seq fold enrichment at various CRE types in colon samples, sourced from ENCODE data. Source data
Extended Data Fig. 4
Extended Data Fig. 4. Analysis of the interplay between structural features and epigenetic markers.
(a) Heatmaps displaying loop signal intensities as referred to in Fig. 2a, adjusted for the effects of stripe strengths at the loop anchors. (b) Contact heatmap at example loci where gene promoters lacking CTCF binding display gene-specific P-E interactions. (c) Hierarchical clustering of genes based on their rankings for various structural and epigenetic features in mucosa samples. Intensity of color corresponds to the strength of the features. (d) Comparative scatter plots illustrating the relationships between different structural and epigenetic features across the examined dataset. Source data
Extended Data Fig. 5
Extended Data Fig. 5. Dynamics of P-E connectivity through colorectal cancer (CRC) progression.
(a) Scatter plots depicting the comparative analysis of P-E connectivity and TSS stripe strengths across different CRC stages. The percentage of genes with reduced connectivity (y < x) during progression is indicated for each stage comparison. (b) Correlation between initial stripe strength in mucosa samples and the extent of stripe reduction in adenocarcinoma samples. Each ellipse’s center and radius represent the mean and standard deviation, respectively, for stripes associated with the specified regulatory elements. The dotted line shows the linear regression across the centers of the ellipses. (c) Distribution of SV counts in samples. Significance p values of count differences stages from Mann–Whitney U test are indicated. (d) Spearman correlation matrix detailing the changes (log2 fold change, FC) of structural and epigenetic features between polyps (M-P) and adenocarcinoma (M-D) relative to unaffected mucosa. (e) Average log2 fold change in P-E connectivity for polyps and adenocarcinoma, categorized by promoter methylation status: quantiles (Q1-Q4), demethylated, and methylated, excluding those with minimal hypo- or hyper-methylation. Confidence intervals are depicted as shaded areas behind each line. (f) Distribution of P-E connectivity in mucosa samples for gene promoters that become hypermethylated (N = 625) or remain unchanged (N = 7,080) in adenocarcinoma. The significance of differences (p = 2.51E-101) is tested using the Mann-Whitney U test. Source data
Extended Data Fig. 6
Extended Data Fig. 6. Disconnection between promoter-enhancer (P-E) connectivity and gene expression changes throughout CRC progression.
(a) Venn diagram illustrating the commonality of genes with significantly modified expression in both polyps and adenocarcinoma (AdeCa). (b) Log2 fold changes of gene expression for genes that are consistently up- (N = 1,550) or down-regulated (N = 1,272) across both stages. Statistical significance of the difference in fold changes is assessed using the Wilcoxon signed-rank test. Up-regulated genes: p = 9.15E-54; down-regulated genes: p = 3.61E-128. (c) Comparisons of P-E connectivity changes for genes that are up- (N = 1,523/3,212) or down-regulated (N = 1,270/2,061) in polyps/AdeCa, relative to genes with no significant alteration in expression (N = 9,250/6,767). The significance of connectivity changes is evaluated using the Mann–Whitney U test. Between down-reg and unchanged, p = 0.77 and p = 0.07; between up-reg and unchanged, p = 0.60 and p = 0.09 in polyp and AdeCa, respectively. (d) Two-dimensional scatter plots and density distributions correlating the changes of top fast-loss (N = 1,000) and slow-loss (N = 1,000) genes in connectivity and gene expression between mucosa and adenocarcinoma. Genes are categorized based on the rate of connectivity loss: fast (blue) and slow (orange), as determined by their feature importance on the first principal component (PC). (e) Principal component analysis (PCA) comparing P-E connectivity, scaled P-E connectivity (normalized against the aggregate sum), and gene expression changes during the stages of CRC development. Source data
Extended Data Fig. 7
Extended Data Fig. 7. Predictive modeling of gene expression changes based on promoter-enhancer (P-E) connectivity.
(a) Distributions of ranks for P-E connectivity and corresponding gene expression levels of key oncogenes and proliferation markers across various cancer progression stages. (b) Model fit assessment for the predicted changes in gene expression in adenocarcinoma using the ‘initial’ model, which utilizes the baseline P-E connectivity. (c) Model fit assessment for the predicted changes in gene expression in adenocarcinoma using the ‘differential’ model, which considers changes in epigenetic landscapes. (d) Spearman correlation matrix showing the similarity of each feature between different stages. (e) Mean squared error (MSE) and (f) Pearson’s r coefficient of the ‘initial’ model for the prediction of gene expression changes in adenocarcinoma compared to the indicated baseline stages. Prediction scores obtained by models trained with mucosa and polyp datasets were compared by using independent t test (N = 10 random initiation states). For mean square error (MSE), p = 2.10E-5, p = 3.21E-11, and p = 0.33; for Pearson’s r, p = 1.39E-5, p = 4.08E-13, and p = 2.78E-3, for mucosa-polyp, mucosa-AdeCa, and polyp-AdeCa prediction models, respectively. (g) Distributions of minimal mean square error (MSE) of ‘Initial’ model trained with equal or less than 20 epochs (N = 10 random initiation states) with the removal of indicated features. Significance p values of differential MSE caused by missing features compared to complete model (All) are evaluated by using independent t-test. Respectively, p = 3.69E-6, p = 0.57, p = 0.41, p = 0.01, and p = 0.03 for models removing P-E connectivity, P stripe strength, P accessibility, E accessibility, and P methylation feature. (h) The top 20 influential features impacting gene expression predictions in adenocarcinoma, as determined by SHAP (SHapley Additive exPlanations) analysis for the ‘initial’ model. (i) The top 20 influential features for the ‘differential’ polyp model, with features named after transcription factors indicating their binding presence at the promoter (p) or enhancer (e) regions, based on the ENCODE database. Source data
Extended Data Fig. 8
Extended Data Fig. 8. Assessment of predictive accuracy for gene expression changes in various cancer types.
ROC curve analysis using gene expression predictions derived from the ‘initial’ polyp model to determine the up- and down-regulation status of genes across different cancer types represented in the TCGA database. Source data
Extended Data Fig. 9
Extended Data Fig. 9. Transcriptomic alterations following JQ1 treatment.
(a) Distribution of epigenetic feature ranks in unaffected mucosa for genes that are up- (N = 5,504) or down-regulated (N = 7,028) subsequent to JQ1 treatment. P values indicating statistical significance between the two groups are calculated using the Mann–Whitney U test. Respective p values for comparisons of promoter accessibility, promoter methylation, and enhancer accessibility: p = 2.6E-32, p = 1.8E-37, p = 2.0E-4 for organoid (mucosa); p = 0.08, p = 6.0E-9, p = 0.01 for organoid (polyp 1); p = 5.5E-13, p = 2.3E-13, p = 0.057 for organoid (polyp 2); p = 7.4E-41, p = 1.5E-20, p = 0.12 for HPCEC; p = 3.0E-3, p = 4.6E-8, p = 2.0E-22 for HT29; p = 6.5E-15, p = 9.3E-9, p = 9.5E-9 for HCT116. (b) Comparative density plots illustrating the differences in feature rank distributions for genes down-regulated in normal tissue (mucosa organoids or primary colon epithelial cells, N = 3,207) versus diseased states (polyp organoids or cancer cell lines, N = 6,007). P values for statistical significance are derived from the Mann-Whitney U test. Individual p values: p = 6.32E-31 for P-E connectivity, p = 1.04E-21 for promoter accessibility, p = 1.62E-11 for promoter methylation, p = 9.59E-7 for enhancer accessibility. (c) Pathway analysis based on ontology for genes that are up- or down-regulated in various samples following JQ1 treatment. Source data
Extended Data Fig. 10
Extended Data Fig. 10. Gene expression changes following Cas9-mediated perturbations in HPCEC and HT29 cells.
(a) Changes in gene expression after introducing dCas9-gRNA ribonucleoproteins (RNPs) targeting promoters in wild-type cell lines (N = 8). For E2F3, MYC, CCNE1, MCM4, CDC25A, B2M, TBP, UBC, p = 0.13, p = 1.9E-3, p = 3.6E-3, p = 5.8E-3, p = 1.1E-4, p = 0.02, p = 0.56 (N.S.), p = 1 (N.S.), respectively. (b) Changes in gene expression after introducing Cas9-gRNA RNPs targeting exons in wild-type cell lines (N = 4). For all comparisons, p = 1 after multiple testing correction. (c) Gene expression alterations upon gRNA delivery targeting exons in cell lines stably expressing dCas9-KRAB (N = 4). For all comparisons, p = 1 after multiple testing correction. N numbers indicate replication of measurements in cells cultured separately. Statistical significance of the differential response was assessed using a two-sample t-test followed by Bonferroni correction. Source data

References

    1. Bonev, B. & Cavalli, G. Organization and function of the 3D genome. Nat. Rev. Genet.17, 661–678 (2016). - PubMed
    1. Rowley, M. J. & Corces, V. G. Organizational principles of 3D genome architecture. Nat. Rev. Genet.19, 789–800 (2018). - PMC - PubMed
    1. Cavalheiro, G. R., Pollex, T. & Furlong, E. E. To loop or not to loop: what is the role of TADs in enhancer function and gene regulation? Curr. Opin. Genet. Dev.67, 119–129 (2021). - PubMed
    1. Misteli, T. The self-organizing genome: principles of genome architecture and function. Cell183, 28–45 (2020). - PMC - PubMed
    1. Dixon, J. R. et al. Topological domains in mammalian genomes identified by analysis of chromatin interactions. Nature485, 376–380 (2012). - PMC - PubMed

Publication types

MeSH terms