. 2024 Nov;5(11):1737-1753.
doi: 10.1038/s43018-024-00831-z. Epub 2024 Oct 30.

Multiomic analysis of familial adenomatous polyposis reveals molecular pathways associated with early tumorigenesis

Affiliations

Multiomic analysis of familial adenomatous polyposis reveals molecular pathways associated with early tumorigenesis

Edward D Esplin et al. Nat Cancer. 2024 Nov.

Abstract

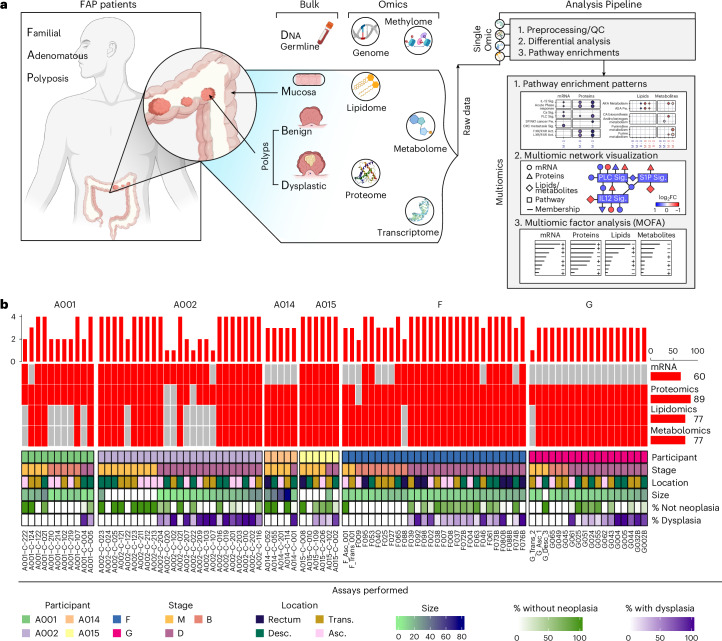
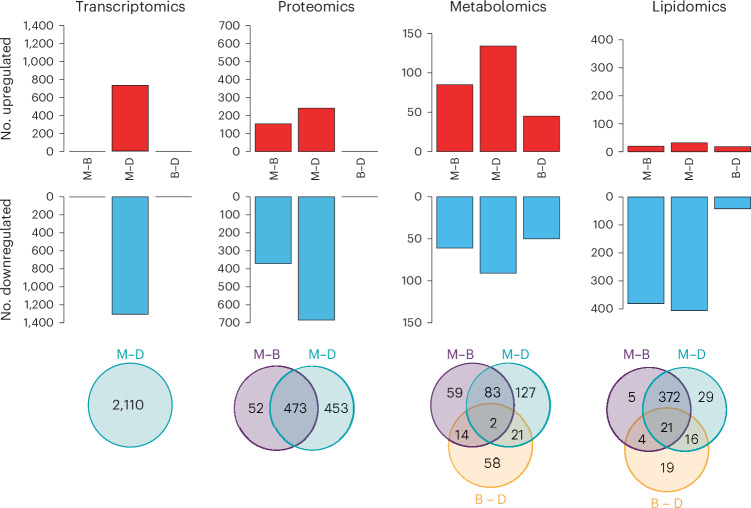
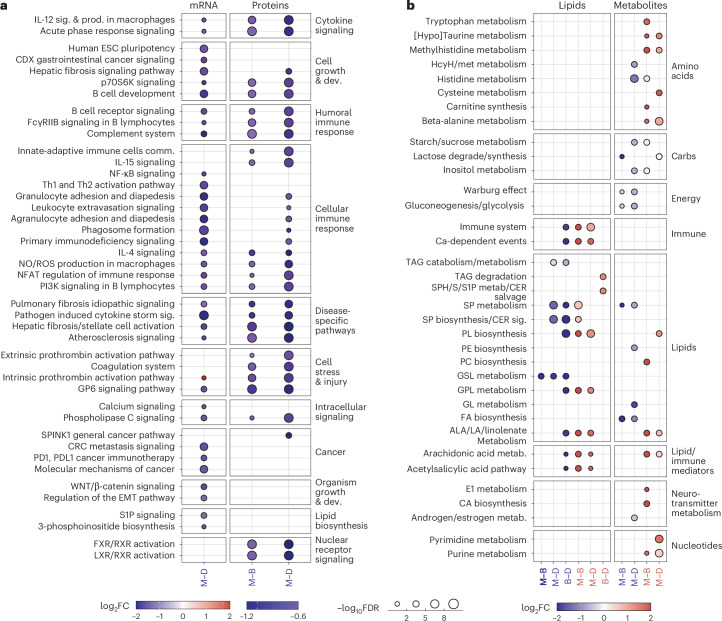
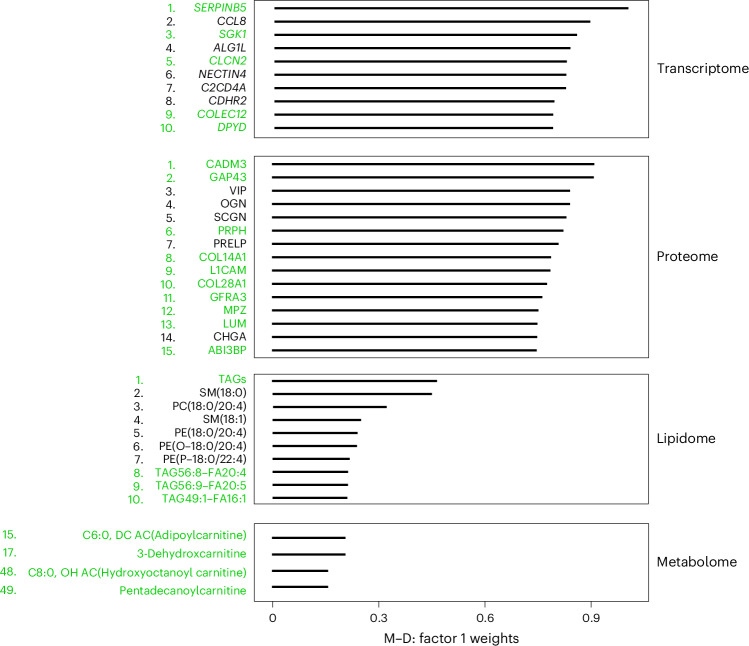
Familial adenomatous polyposis (FAP) is a genetic disease causing hundreds of premalignant polyps in affected persons and is an ideal model to study transitions of early precancer states to colorectal cancer (CRC). We performed deep multiomic profiling of 93 samples, including normal mucosa, benign polyps and dysplastic polyps, from six persons with FAP. Transcriptomic, proteomic, metabolomic and lipidomic analyses revealed a dynamic choreography of thousands of molecular and cellular events that occur during precancerous transitions toward cancer formation. These involve processes such as cell proliferation, immune response, metabolic alterations (including amino acids and lipids), hormones and extracellular matrix proteins. Interestingly, activation of the arachidonic acid pathway was found to occur early in hyperplasia; this pathway is targeted by aspirin and other nonsteroidal anti-inflammatory drugs, a preventative treatment under investigation in persons with FAP. Overall, our results reveal key genomic, cellular and molecular events during the earliest steps in CRC formation and potential mechanisms of pharmaceutical prophylaxis.


Conflict of interest statement

Competing interests: M.P.S. is a cofounder and scientific advisor of Personalis, SensOmics, Qbio, January AI, Fodsel, Filtricine, v Protos, RTHM, Iollo, Marble Therapeutics, Crosshair Therapeutics, NextThought and Mirvie. He is a scientific advisor of Jupiter, Neuvivo, Swaza, Mitrix, Yuvan, TranscribeGlass and Applied Cognition. A. Kundaje has affiliations with Biogen (consultant), SerImmune (scientific advisory board (SAB)), RavelBio (scientific cofounder and SAB) and PatchBio (SAB). K.C. is currently an AstraZeneca employee. W.J.G. has affiliations with Guardant Health (consultant and SAB), Protillion Biosciences (scientific cofounder) and 10x and has licenced patents associated with ATAC-seq. E.D.E. is an employee and stockholder of Labcorp, and advisor and stockholder of Taproot Health, Exir Bio and ROMTech. The other authors declare no competing interests.

Figures

Fig. 1
Fig. 1. Overview of the multiomic FAP study.
a, Schematic of tissue and blood collections, assays and downstream single-omic and multiomic analyses performed in this study. b, Summary of the clinical features of each of 93 colorectal samples derived from six persons with FAP, with up to four assays were performed on each sample. Portions of this figure were created with BioRender.com. Source data
Fig. 2
Fig. 2. Differentially abundant molecules per -omic.
Top, histograms of the number of differentially abundant molecules per -omic analysis and contrast (M–B, M–D and B–D) separated by upregulated (red) and downregulated (blue) directionality (for example, red or upregulated in M–D indicates increasing abundance from mucosa to dysplastic polyp). Differential abundance was defined by an FC of ±15% and FDR of 5% for the transcriptome, an FC of ±15% and FDR of 1% for the proteome and a P value of 5% for the lipidome and metabolome. Bottom, Venn diagrams show the degree of differentially abundant molecules shared between the contrasts regardless of directionality for each single -omic. The absence of a bar (histogram) or circle (Venn diagram) means that no significant analytes were identified. The statistical tests used were two-sided Wald tests for the transcriptomic, lipidomic and metabolomic data and one-sided F-tests for the proteomic data. Source data
Fig. 3
Fig. 3. Selected pathway enrichments run for differentially abundant molecules for each -omic.
Each dot indicates an enrichment of a pathway for a particular -omic; its size indicates the −log10FDR of the enrichment (a larger dot indicates a smaller adjusted P value) and the color indicates the median log2FC. a, Enrichment analyses for the transcriptome and proteome (separately) were performed using IPA and upregulated and downregulated molecules were enriched separately, although only downregulated enrichments were significant. Pathways were selected that reflected strong agreement between the proteome and transcriptome and were distributed across a variety of cellular and molecular functions relevant to CRC. b, Enrichment analysis for the lipidome and metabolome used the CPDB and MSEA tools rather than IPA and, similarly to the transcriptome and proteome, selected pathways spanning a variety of molecular and cellular functions relevant to CRC were selected (for example, arachidonic acid). Enrichments were performed with all differential molecules and pathways were deemed upregulated and downregulated according to the median log2FC of the enriched molecules. E1, estrone; CA, caffeine; ALA, alpha-linolenic acid; LA, linoleic acid; PL, phospholipid; S, sphingosine; HcyH, homocysteine; Met, methionine; [Hypo]Taurine, taurine and hypotaurine. Source data
Fig. 4
Fig. 4. A multiomic diagram describing the relationship between various enriched pathways in the M–D transition in terms of the hundreds of molecules they share in common.
The molecules are colored according to the log2FC and are generally shaped according to their molecular function. Lipids and metabolites are both symbolized as chemicals, while the remaining molecules are genes or proteins. Some molecules have both gene and protein information and are outlined with dots; otherwise, a bold outline indicates that the molecule is a protein. To reduce the complexity, molecules with similar prefixes and belonging to the same family were combined; subscript characters denote the different members of the family and the molecule complex is colored by the median log2FC. In situations where a complex contains both upregulated and downregulated members, half the molecule is colored with the median log2FC for one direction and the other half of the molecule is colored with the median log2FC for the other direction. Large circles are pathways from IPA, MSEA or CPDB ORA and are colored blue to indicate that all are downregulated from M–D. Lines flow from molecules to pathways to indicate membership. Thick lines that intersect with multiple thin lines simplify the flow of information and indicate that all thin lines move along the direction of thick lines. Lines that are dotted obviate lines they so happen to intersect. The asterisk collapses the following molecules with the IGHV (immunoglobulin heavy chain variable region) prefix: 1-18, 1-2, 1-46, 1-69, 2-26, 2-5, 2-70D, 3-13, 3-15, 3-30, 3-35, 3-43, 3-49, 3-7, 3-74, 4-28, 4-34, 4-4, 5-51 and 6-1. Source data
Fig. 5
Fig. 5. Selected molecules from MOFA with high weight alongside the latent factor (factor 1) correlated with dysplasia.
Relevant molecules are highlighted in green. The top ten and four of the top 50 molecules for the lipidome and metabolome are shown, respectively. The four metabolites are all carnitines. Source data
Fig. 6
Fig. 6. A panorama of immune response pathways in FAP enriched in the M–D transition.
The representative immune signaling pathways are marked next to or inside of the symbols of each immune cell type. The immune response pathways that were significantly enriched in our -omic data are highlighted in red. The three boxes contain the key lipid mediators involved in immunity detected in the lipidomic dataset and their chemical relationships. The connections in the map are based on the Qiagen IPA database and literature. Lipidomic and metabolomic connections are based on pathways in CPDB and MSEA enriched for the M–D transition. Portions of this figure were created with BioRender.com. Source data
Extended Data Fig. 1
Extended Data Fig. 1. Omic PCA Plots.
Principal component analysis across -omic assays (transcriptome is omitted due to technical effects).
Extended Data Fig. 2
Extended Data Fig. 2. DESeq2 Plots.
Transcriptomic DESeq2 MA plots from various (Patient, Batch) pairs along with the number of samples from which mRNA was derived for each of the three stages and contrasts. Green indicates contrasts that ultimately contribute to differential expression. (a) MA plot for patient A001 in Batch 1 with 10 samples (3 Mucosa, 5 Benign Polyp, 2 Dysplastic Polyp). (b) MA plot for patient A002 in Batch 1 with 11 samples (3 Mucosa and 8 Dysplastic Polyp). (c) MA plot for patient A002 in Batch 3 with 14 samples (7 Mucosa and 7 Dysplastic). (d) MA plot for patient A015 in Batch 3 (4 Mucosa and 2 Dysplastic Polyps). (e) MA plot for patient F in Batch 3 (4 Benign Polyp and 16 Dysplastic Polyp). (f) Shows the total breakdown in the number of samples from which mRNA was extracted across the different (Patient, Batch) pairs. Though there were 61 samples, one sample (A002-C-213) was present in two batches.
Extended Data Fig. 3
Extended Data Fig. 3. MOFA Statistics.
Multi-omic Factor Analysis (MOFA) statistics for 10 factors. (a) Shown are the 4 -omic modalities and their number of molecules. On the left are 43 Dysplastic Polyps shown (10 for transcriptome) and on the right are 23 Mucosa samples (4 for the transcriptome). (b) Shows the % variance explained by each -omic and factor for the Dysplastic and Mucosa Samples. (c) Show the % variance explained by the 1st factor for the Dysplastic and Mucosa samples. (d) Shows the correlation coefficient of each factor with several metadata variables including dysplasia (Dys). Factor 1 is highly correlated with Dysplastic status and molecules separated at the extremes of this axis are implicated with dysplasia and investigated.
Extended Data Fig. 4
Extended Data Fig. 4. MOFA Factor 1 Omic Rankings.
The top 50 transcripts (a), proteins (b), lipids (c), and metabolites (d) along dysplasia correlated factor 1 in MOFA.

References

    1. Siegel, R. L., Miller, K. D. & Jemal, A. Cancer statistics, 2018. CA Cancer J. Clin.68, 7–30 (2018). - PubMed
    1. Green, E. D., Guyer, M. S. & National Human Genome Research Institute. Charting a course for genomic medicine from base pairs to bedside. Nature470, 204–213 (2011). - PubMed
    1. Phelps, R. A. et al. A two-step model for colon adenoma initiation and progression caused by APC loss. Cell137, 623–634 (2009). - PMC - PubMed
    1. Cancer Genome Atlas Network. Comprehensive molecular characterization of human colon and rectal cancer. Nature487, 330–337 (2012). - PMC - PubMed
    1. Esplin, E. D. & Snyder, M. P. Genomic era diagnosis and management of hereditary and sporadic colon cancer. World J. Clin. Oncol.5, 1036–1047 (2014). - PMC - PubMed

Publication types

MeSH terms

LinkOut - more resources