. 2024 Oct 30;7(1):1413.
doi: 10.1038/s42003-024-07107-3.

A spatial hierarchical network learning framework for drug repositioning allowing interpretation from macro to micro scale

Affiliations

A spatial hierarchical network learning framework for drug repositioning allowing interpretation from macro to micro scale

Zhonghao Ren et al. Commun Biol. .

Abstract

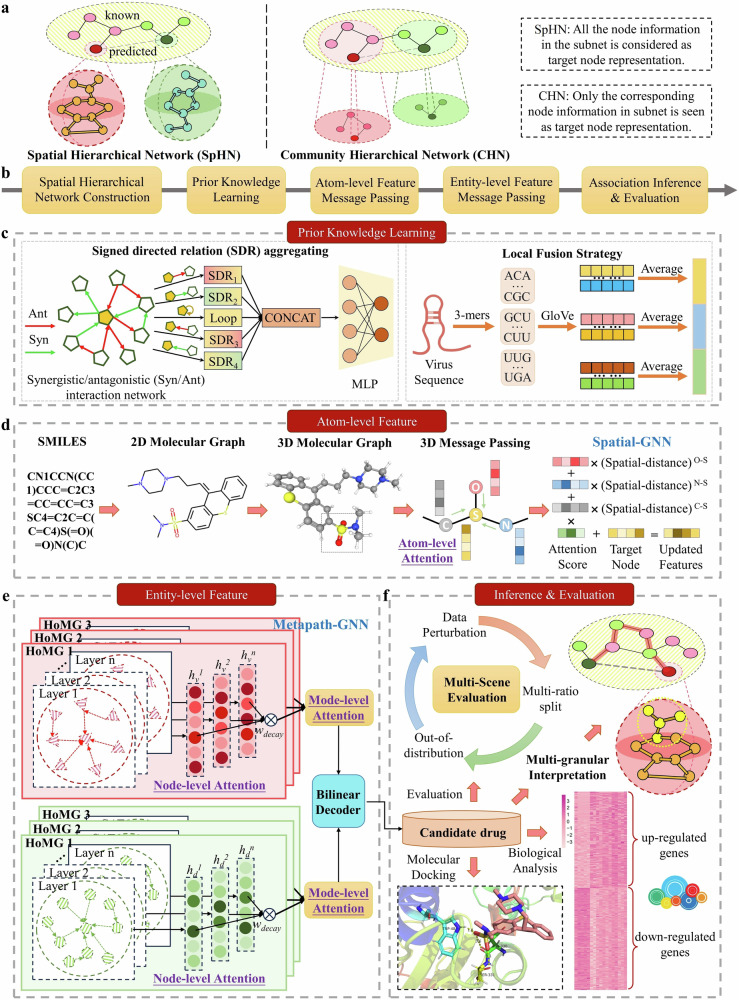
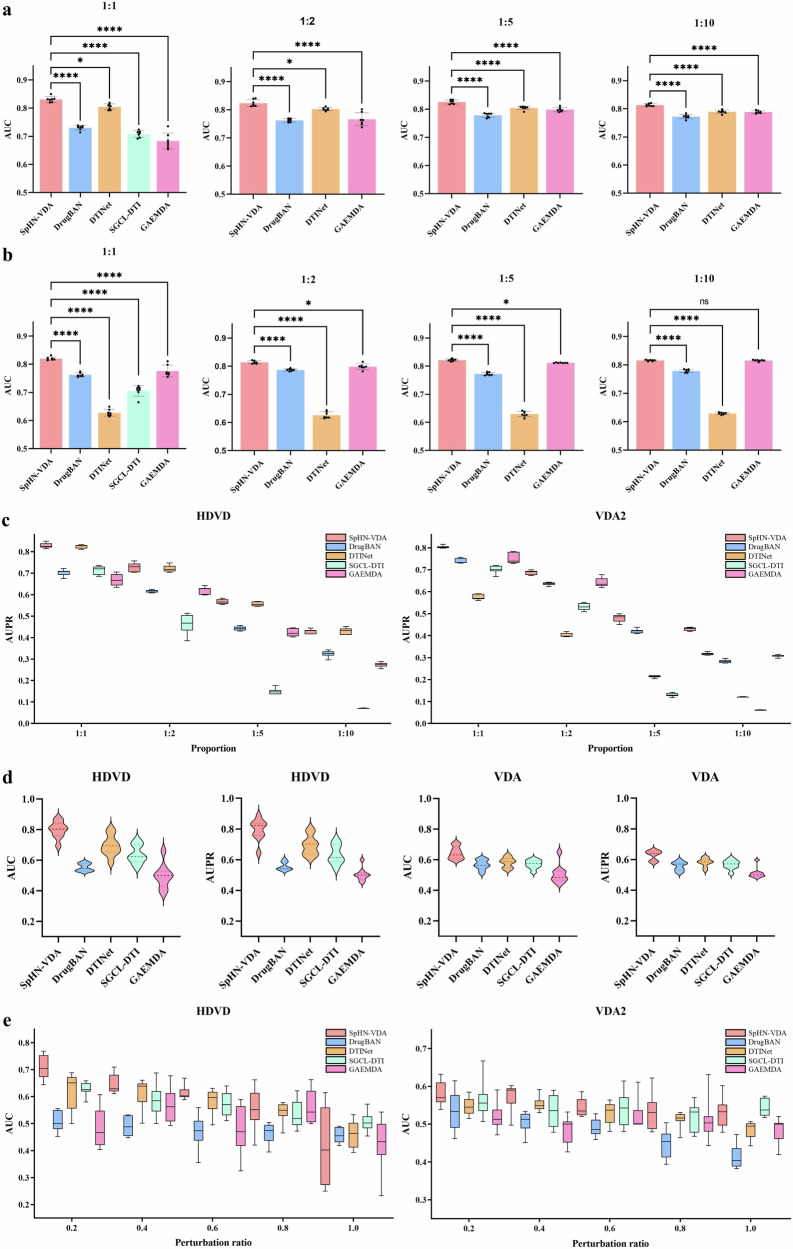
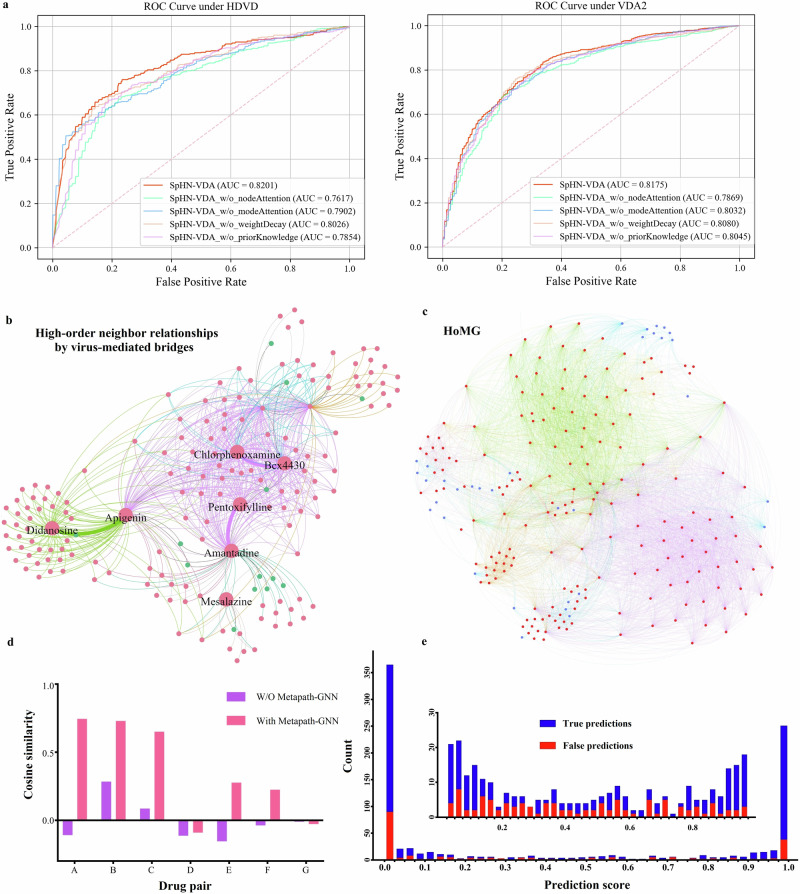
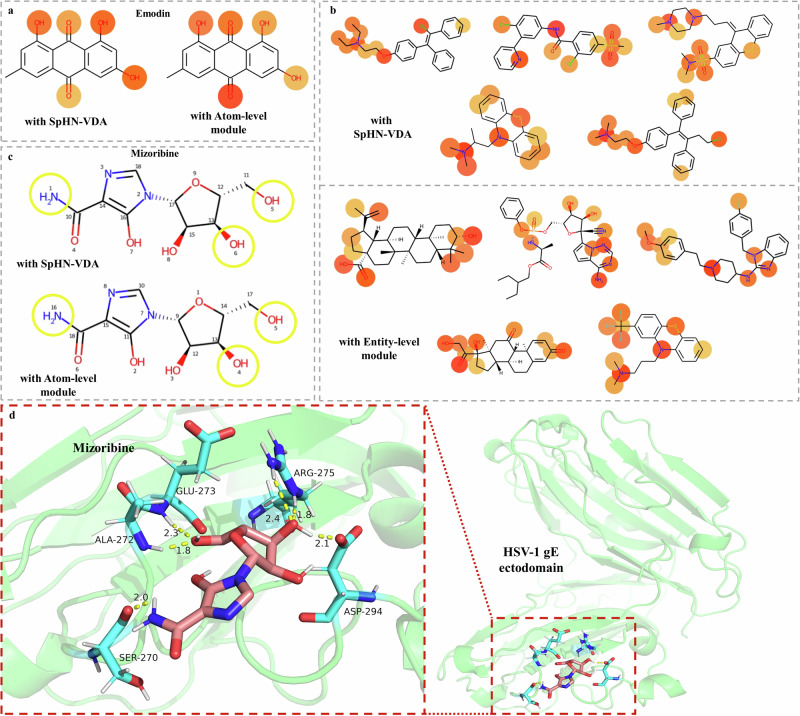
Biomedical network learning offers fresh prospects for expediting drug repositioning. However, traditional network architectures struggle to quantify the relationship between micro-scale drug spatial structures and corresponding macro-scale biomedical networks, limiting their ability to capture key pharmacological properties and complex biomedical information crucial for drug screening and therapeutic discovery. Moreover, challenges such as difficulty in capturing long-range dependencies hinder current network-based approaches. To address these limitations, we introduce the Spatial Hierarchical Network, modeling molecular 3D structures and biological associations into a unified network. We propose an end-to-end framework, SpHN-VDA, integrating spatial hierarchical information through triple attention mechanisms to enhance machine understanding of molecular functionality and improve the accuracy of virus-drug association identification. SpHN-VDA outperforms leading models across three datasets, particularly excelling in out-of-distribution and cold-start scenarios. It also exhibits enhanced robustness against data perturbation, ranging from 20% to 40%. It accurately identifies critical motifs for binding sites, even without protein residue annotations. Leveraging reliability of SpHN-VDA, we have identified 25 potential candidate drugs through gene expression analysis and CMap. Molecular docking experiments with the SARS-CoV-2 spike protein further corroborate the predictions. This research highlights the broad potential of SpHN-VDA to enhance drug repositioning and identify effective treatments for various diseases.


Conflict of interest statement

The authors declare no competing interests.

Figures

Fig. 1
Fig. 1. Schematic diagram of the SpHN-VDA architecture.
a An illustrative example of Spatial Hierarchical Network and Community Hierarchical Network reveals their markedly distinct structures and learning processes. b The pipeline of SpHN-VDA. We formulated the whole process as five phases. c The process of prior knowledge learning, whose information is extracted from the drug synergistic/antagonistic interaction network and virus sequences, is used to initialize the features. Furthermore, both the drug spatial structure and the association structure are essential for VDA prediction. Thus, the SpHN-VDA contains two-level perspectives: d the micro-atom-level perspective, which serves each atom of the molecule as the node and connects the spatially proximate atoms to learn the atom-level features, and e the macro entity-level perspective, which serves drugs and viruses as nodes and uses the prior knowledge information and atom-level representation as node initialization to learn the entity-level features. f According to the prediction results of the SpHN-VDA, we evaluate the performance in diverse scenarios, containing sample splitting with multiple ratios, out-of-distribution, and perturbational datasets; provide interpretable biochemical evidence by uncovering the complete reasoning process from the 3D molecular structure to the biological association metapath coherently; find a potential candidate drug with high confidence through further biological data analysis of gene expression analysis and CMap; and visualize the molecular docking result for further verification.
Fig. 2
Fig. 2. Overall performance of the SpHN-VDA in VDA prediction.
a The AUC for VDA prediction on the HDVD dataset across 7 independent experiments (each with a different random seed) for various negative sample proportions under positive-to-negative ratios of 1:1, 1:2, 1:5, and 1:10. For each ratio, 7 distinct sets of negative samples were randomly selected. Error bars represent the mean standard deviation across the 7 independent experiments, which differs from technical replicates. Each bar graph shows the performance significance of intergroup differences. The estimated effect sizes of four ratios are 0.94, 0.79, 0.86, and 0.87, respectively. The significance of SpHN-VDA versus DTINet is shown in each case (Tukey’s HSD test: *P = 2.65 × 10-2 for 1:1, *P = 3.84 × 10-2 for 1:2, ****P < 1 × 10-4 for 1:5, and ****P < 1 × 10-4 for 1:10). The details of statistical test result are reported in the Supplementary Table 11–14 and the significance test results based on the t-test are reported in the Supplementary Tables 8–10. b The AUC for VDA prediction on the VDA2 dataset with 7 independent experiments (each with a different random seed) for various negative sample proportions under positive-to-negative ratios of 1:1, 1:2, 1:5, and 1:10. For each ratio, 7 distinct sets of negative samples were randomly selected. Error bars represent the mean standard deviation across the 7 independent experiments, which differs from technical replicates. The estimated effect sizes of four ratios are 0.96, 0.98, 0.99, and 0.99, respectively. The significance of SpHN-VDA versus GAEMDA is shown in each case (Tukey’s HSD test: ****P <  1 × 10-4 for 1:1, *P = 1.01 × 10-2 for 1:2, *P = 1.88 × 10-2 for 1:5, and nsP = 0.99 for 1:10). The details of statistical test result are reported in the Supplementary Tables 15–18 and the significance test results based on the t-test are reported in the Supplementary Tables 8–10. c The change in AUPR on HDVD and VDA2 datasets is illustrated under different negative proportions with 7 independent experiments (each with a different random seed). For each proportion, 7 distinct sets of negative samples were randomly selected, which differs from technical replicates. For boxplots, the center line represents the median, upper and lower edges represent the interquartile range, and the whiskers extend from the minimum to the maximum values. d Generalization evaluation for OOD scenarios portrays the distributions of AUC and AUPR under 9 independent experiments (each with a different random seed) regarding 20% of viruses as cold-start viruses. For each independent experiment, a distinct set of cold-start viruses were randomly sampled. The evaluation metrics are represented as violin plots, where the center line depicts the median and the upper and lower lines denote the interquartile range. e Under 9 independent experiments (each with a different random seed), robustness evaluation showing the best AUC of each model prediction against different ratios of random perturbation of VDA pairs where the pairs are replaced with adding or removing. For each perturbation ratio, 9 distinct sets of cold-start viruses and perturbative samples were randomly sampled, which differs from technical replicates. For boxplots, the center line represents the median, upper and lower edges represent the interquartile range, and the whiskers extend from the minimum to the maximum values. Source data are provided as a Source Data file in Supplementary Data 4.
Fig. 3
Fig. 3. Performance of the atom-level structure learning of the SpHN-VDA to extract drug features for VDA prediction.
a The average ROC curves based on fivefold cross-validation of VDA prediction with the different message-passing structures in the HDVD and VDA2 datasets show the performance of SpHN-VDA compared to variant methods containing SpHN-VDA_atomGCN, SpHN-VDA_w/o_3DAttention, and SpHN-VDA_w/o_3DInformation. b The correlation of the heatmap of each atomic feature under SpHN-VDA training, SpHN-VDA_atomGCN training, and random generation without training. The color of each pixel is determined by the Pearson correlation coefficient of the corresponding pairwise atom features. Red indicates a high value of the Pearson correlation coefficient, and green indicates a low value. The larger the number of high values represents the powerful ability of model capturing long-range dependence. c The binding sites for the HIV-1 protease IRM mutant (PDB id: 2FXD) with atazanavir and the predicted critical motifs of atazanavir. The contribution of these motifs is presented as a heatmap, where color depth is positively correlated to the z score. The top three motifs were confirmed to maintain the corresponding binding sites of GLY-48 and GLY-27. Source data are provided as a Source Data file in Supplementary Data 4.
Fig. 4
Fig. 4. Performance of the entity-level structure learning of the SpHN-VDA in extracting complex biomedical relation information in the VDA network.
a The average ROC curves based on fivefold cross-validation of VDA prediction with different entity-level feature message-passing variants in the HDVD and VDA2 datasets show the performance of SpHN-VDA compared to methods containing SpHN-VDA _w/o_nodeAttention, SpHN-VDA _w/o_modeAttention, SpHN-VDA _w/o_weightDecay, and SpHN-VDA _w/o_priorKnowledge. b The visualization of high-order neighbor relationships between study drugs in the HoMG, containing chlorphenoxamine-Bcx4430, amantadine-pentoxifylline, and apigenin and didanosine, whose different colors represent corresponding virus-mediated associations, specifically SARS-CoV and HIV-1. c The HoMG visualization, where the blue edges indicate the original heterogeneous network without introducing relationships of the metapath pattern, and the other edge with diverse colors denotes corresponding virus-mediated associations under the metapath pattern of Drug1treatVirus1treatedbyDrug2. The red nodes represent drugs, while the blue nodes represent viruses. d Quantifying the correlation between node embedding distances and the inferred biological function similarity post-message passing. We compare the embedding distances of drugs with similar biological functions to those without, under Metapath-GNN learning employed and not employed, respectively. The degree of relationship is assessed through cosine distance after normalization. Our evaluation aims to ascertain the effectiveness of metapath-based high-order neighbor message passing in capturing implicit biological function similarities. e Detailed view of the prediction accuracy distribution on HDVD, where the length of blue indicates the count of the true prediction sample and the length of red indicates the count of the false prediction sample, based on fivefold cross-validation. Source data are provided as a Source Data file in Supplementary Data 4.
Fig. 5
Fig. 5. Interpretable analysis based on hierarchical information.
a The structure capturing of Emodin with SpHN-VDA and Atom-level module. The attention scores are extracted from the corresponding models. b The selection of critical entity-level neighbors with SpHN-VDA and Entity-level module. As the Entity-level module has no attention score for the molecular structure, it uses the score from SpHN-VDA. The same score source is useful for analyzing potential neighbor selection criteria. c All atoms scores of Mizoribine with SpHN-VDA and Atom-level module. The attention scores are extracted from the corresponding models. d The docking results of Mizoribine with HSV-1 gE ectodomain (PDB: 2GIY). The figure displays six binding sites and three important molecular structures under the optimal docking structure.
Fig. 6
Fig. 6. Molecular docking results for thiothixene binding with SARS-CoV-2 spike protein/ACE2 and prediction results for important atoms.
The results show that thiothixene binds with ACE2 by forming three hydrogen bonds with residues TRP-48, SER-331, and ASN-330. The distances are 1.8 Å, 3.1 Å and 3.6 Å, respectively.

References

    1. Dickson, M. & Gagnon, J. P. Key factors in the rising cost of new drug discovery and development. Nat. Rev. Drug Discov.3, 417–429 (2004). - PubMed
    1. Fernández-Torras, A., Duran-Frigola, M., Bertoni, M., Locatelli, M. & Aloy, P. Integrating and formatting biomedical data as pre-calculated knowledge graph embeddings in the Bioteque. Nat. Commun.13, 5304 (2022). - PMC - PubMed
    1. Wang, R.-S. & Loscalzo, J. Repurposing drugs for the treatment of COVID-19 and its cardiovascular manifestations. Circ. Res.132, 1374–1386 (2023). - PMC - PubMed
    1. Pushpakom, S. et al. Drug repurposing: progress, challenges and recommendations. Nat. Rev. Drug Discov.18, 41–58 (2019). - PubMed
    1. Guy, R. K., DiPaola, R. S., Romanelli, F. & Dutch, R. E. Rapid repurposing of drugs for COVID-19. Sci368, 829–830 (2020). - PubMed

Substances

LinkOut - more resources