. 2024 Dec;16(12):3033-3056.
doi: 10.1038/s44321-024-00157-4. Epub 2024 Oct 30.

Fibrolytic vaccination against ADAM12 reduces desmoplasia in preclinical pancreatic adenocarcinomas

Affiliations

Fibrolytic vaccination against ADAM12 reduces desmoplasia in preclinical pancreatic adenocarcinomas

Jing Chen et al. EMBO Mol Med. 2024 Dec.

Abstract

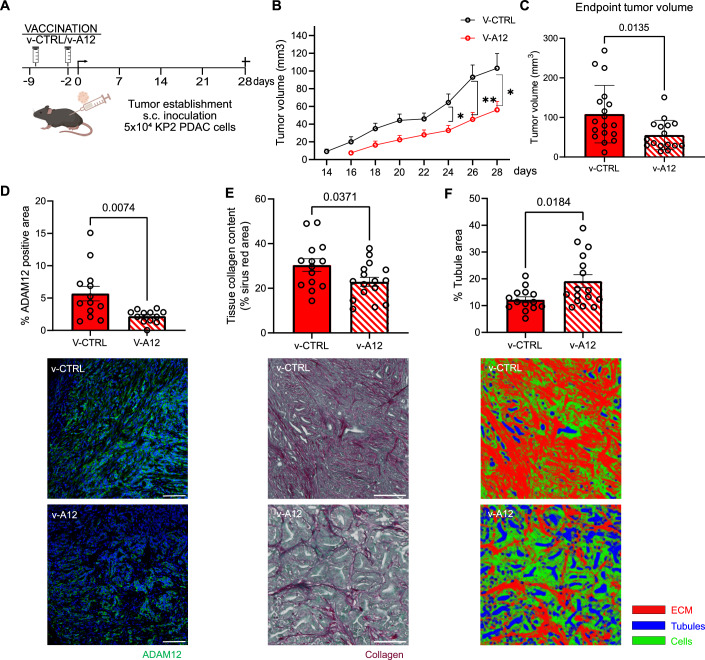
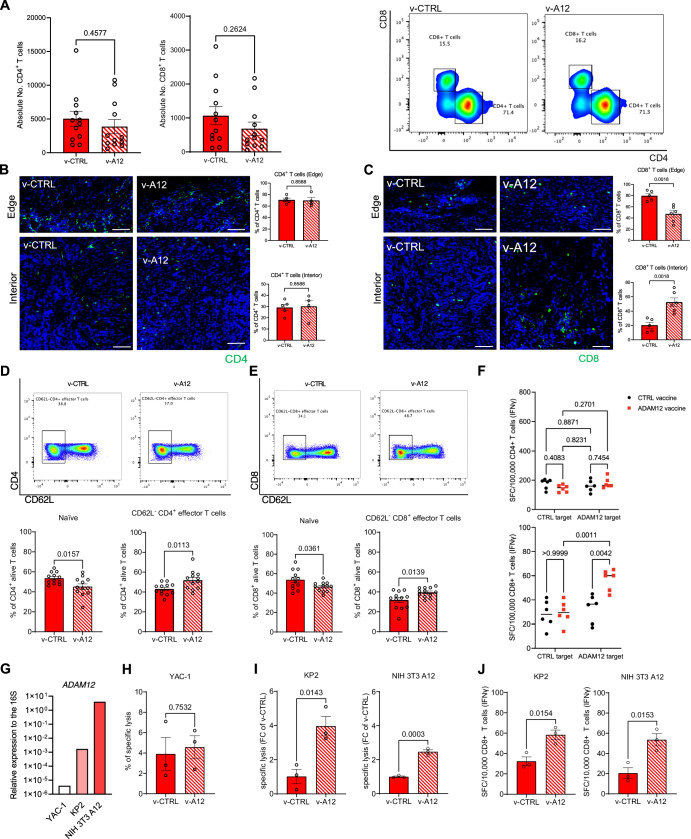
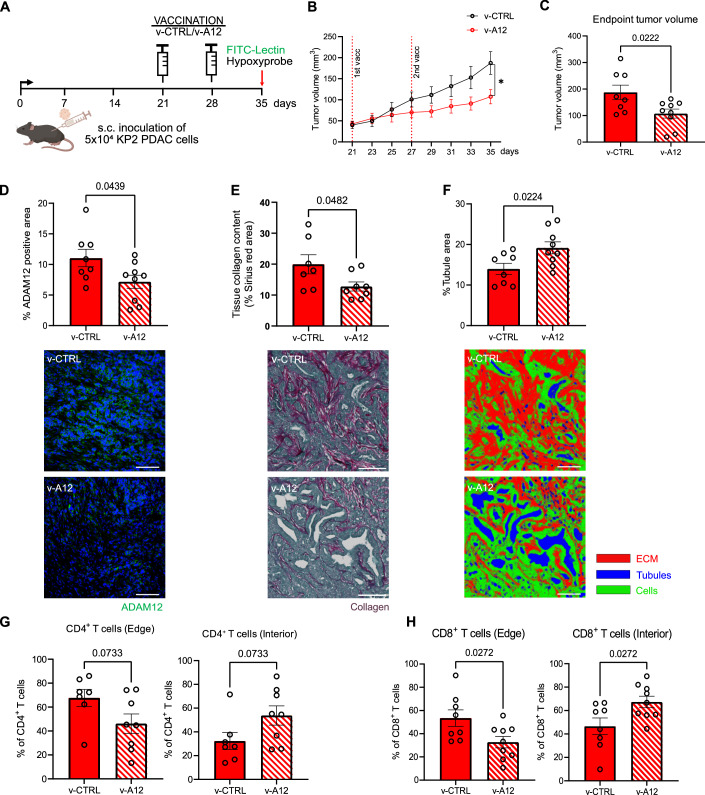
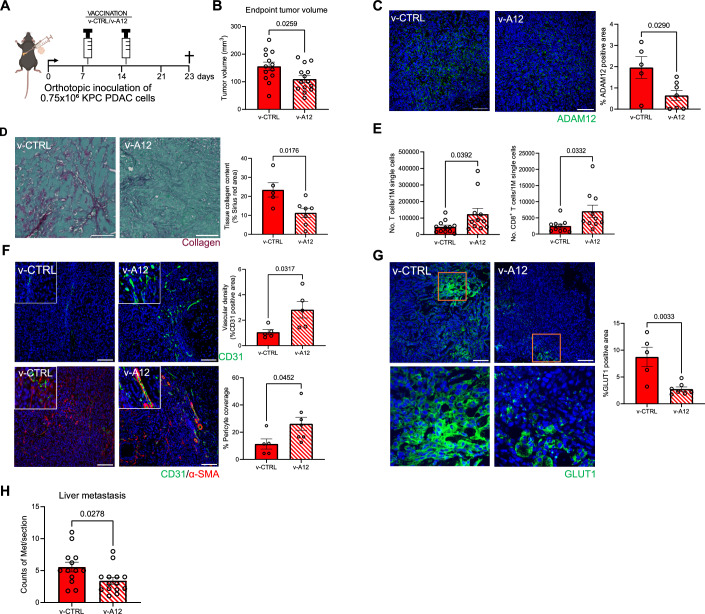
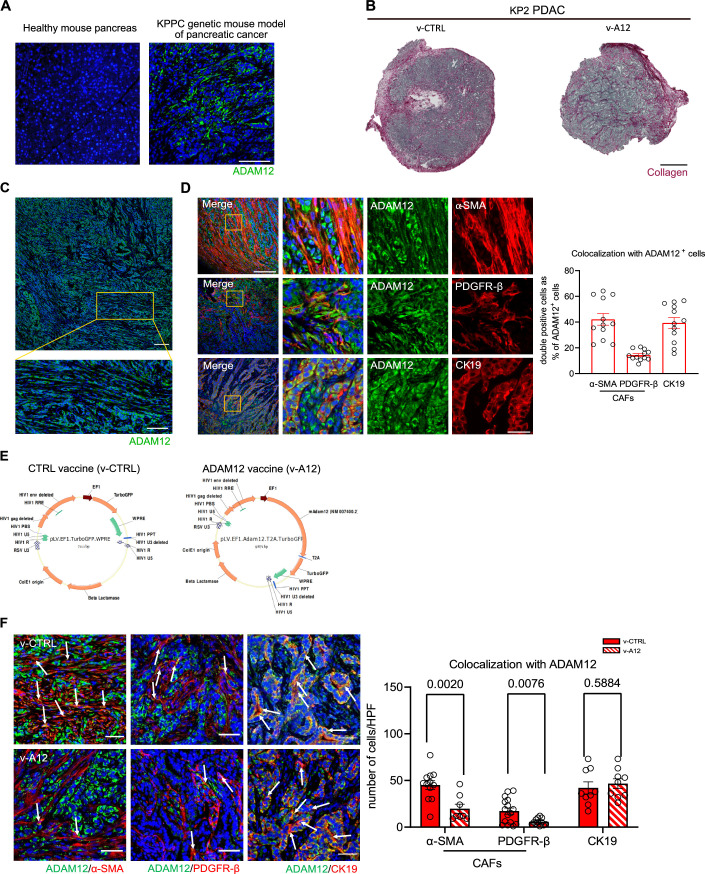
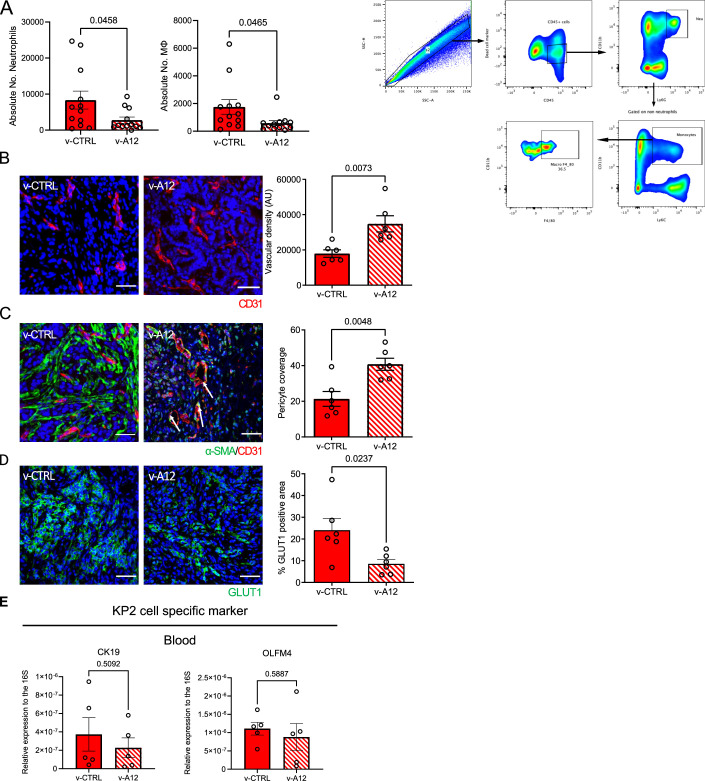
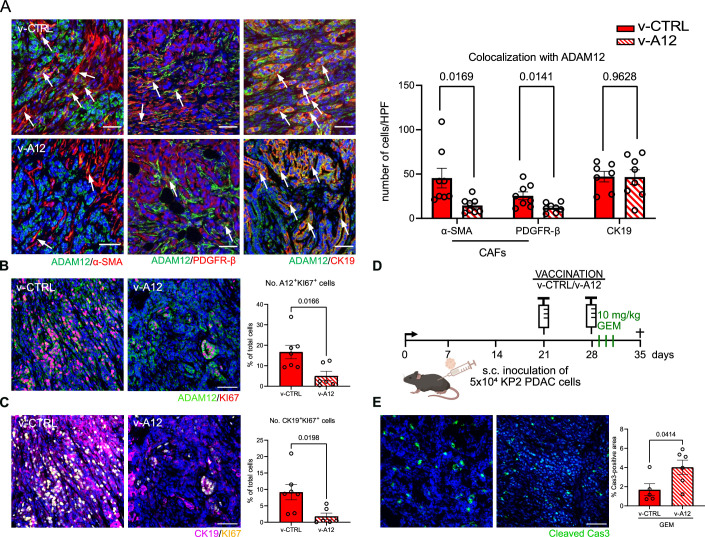
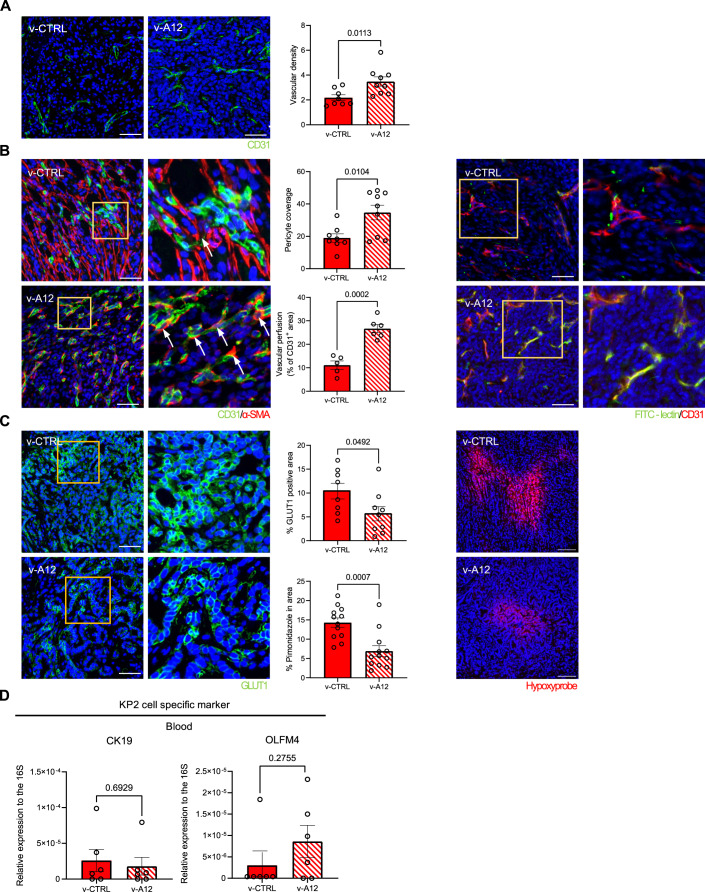
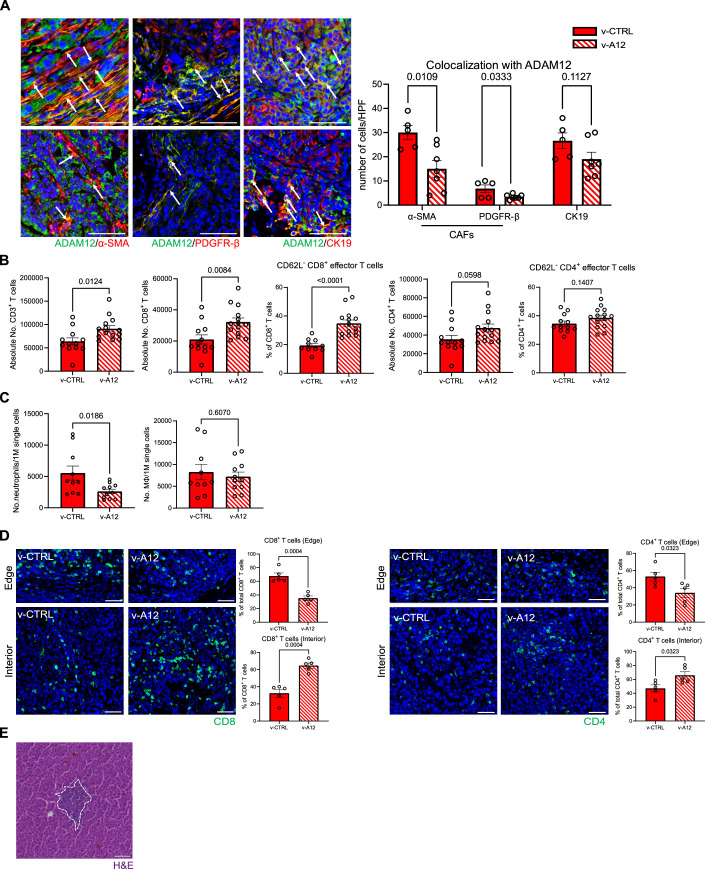
A hallmark feature of pancreatic ductal adenocarcinoma (PDAC) is massive intratumoral fibrosis, designated as desmoplasia. Desmoplasia is characterized by the expansion of cancer-associated fibroblasts (CAFs) and a massive increase in extracellular matrix (ECM). During fibrogenesis, distinct genes become reactivated specifically in fibroblasts, e.g., the disintegrin metalloprotease, ADAM12. Previous studies have shown that immunotherapeutic ablation of ADAM12+ cells reduces fibrosis in various organs. In preclinical mouse models of PDAC, we observe ADAM12 expression in CAFs as well as in tumor cells but not in healthy mouse pancreas. Therefore, we tested prophylactic and therapeutic vaccination against ADAM12 in murine PDAC and observed delayed tumor growth along with a reduction in CAFs and tumor desmoplasia. This is furthermore associated with vascular normalization and alleviated tumor hypoxia. The ADAM12 vaccine induces a redistribution of CD8+ T cells within the tumor and cytotoxic responses against ADAM12+ cells. In summary, vaccination against the endogenous fibroblast target ADAM12 effectively depletes CAFs, reduces desmoplasia and delays the growth of murine PDACs. These results provide proof-of-principle for the development of vaccination-based immunotherapies to treat tumor desmoplasia.

Keywords: Cancer-Associated Fibroblasts; Immunotherapy; Pancreatic Adenocarcinoma; Vaccination.


Conflict of interest statement

Disclosure and competing interests statement. A patent application based on this work has been deposited.

Figures

Figure 1
Figure 1. Prophylactic ADAM12 vaccination hampered KP2 PDAC tumor growth.
(A) Experimental scheme of prophylactic ADAM12 vaccination (v-A12) on subcutaneous KP2 PDAC tumor-bearing mice. (B) Time course of tumor volume measurement in mm3 after tumors were measurable. (n = 18 mice in v-CTRL, n = 16 mice in v-A12; * at day 24 indicates p = 0.0116, ** at day 26 indicates p = 0.0062, * at day 28 indicates p = 0.0229. Data were presented as mean ± SEM. Statistical test: unpaired two-tailed Student’s t-test.). (C) Tumor volume (C) at the endpoint. (n = 18 mice in v-CTRL, n = 16 mice in v-A12. Data were presented as mean ± SEM. Statistical test: unpaired two-tailed Student’s t-test.). (D) Quantitative analysis of ADAM12 expression via immunofluorescence staining (ADAM12 antibody, Invitrogen, PA5-50594) and corresponding representative images (bottom). (n = 13 mice in v-CTRL, n = 12 mice in v-A12. Data were presented as mean ± SEM. Statistical test: unpaired two-tailed Student’s t-test. Scale bar 100 μm). (E) Quantitative analysis of tissue collagen deposition (upper) by Sirius Red/Fast Green staining and corresponding representative images (bottom). (n = 14 mice in v-CTRL, n = 16 mice in v-A12. Data were presented as mean ± SEM. Statistical test: unpaired two-tailed Student’s t-test. Scale bar 50 μm). (F) Tubule area quantification result based on Sirius red staining pictures with Image segmentation (Ilastik). (n = 14 mice in v-CTRL, n = 16 mice in v-A12. Data were presented as mean ± SEM. Statistical test: unpaired two-tailed Student’s t-test.). Source data are available online for this figure.
Figure 2
Figure 2. Prophylactic ADAM12 vaccination stimulates specific T cell response in PDAC tumor-bearing mice.
(A) Quantitative analysis by flow cytometry of absolute count of CD4+ T cells (left) and CD8+ T cells (middle) in tumor samples from subcutaneous PDAC model treated with control vaccine (v-CTRL) and ADAM12 vaccine (v-A12), along with corresponding gating strategy (right). (n = 12 mice in v-CTRL and v-A12 respectively. Data were presented as mean ± SEM. Statistical test: unpaired two-tailed Student’s t-test.). (B) Quantitative analysis of CD4+ T cell population at the edge of PDAC tumor tissue (left, upper) and interior of PDAC tissue (left, bottom), along with corresponding representative images. (n = 5 mice in v-CTRL and n = 4 mice in v-A12. Data were presented as mean ± SEM. Statistical test: unpaired two-tailed Student’s t-test. Scale bar 50 μm). (C) Quantitative analysis of CD8+ T cell population at the edge of PDAC tumor tissue (left, upper) and interior of PDAC tissue (left, bottom), along with corresponding representative images. (n = 5 mice in v-CTRL and n = 6 mice in v-A12. Data were presented as mean ± SEM. Statistical test: unpaired two-tailed Student’s t-test. Scale bar 50 μm). (D) Representative flow cytometry gating (upper) of CD62L- CD4+ effector T cells between control-vaccinated (v-CTRL) mice and ADAM12-vaccinated (v-A12) mice; corresponding quantitative analysis of naïve CD4+ T cells (bottom, left) and CD62L- CD4+ effector T cells (bottom, right) within splenic CD4+ T cells from PDAC tumor-bearing mice treated with control vaccine (v-CTRL) and ADAM12 vaccine (v-A12). (n = 12 mice in v-CTRL and v-A12 respectively. Data were presented as mean ± SEM. Statistical test: unpaired two-tailed Student’s t-test.). (E) Representative flow cytometry gating of CD62L- CD8+ effector T cells (upper) between control-vaccinated mice and ADAM12-vaccinated mice; corresponding quantitative result of naïve CD8+ T cells (bottom, left) and CD62L- CD8+ effector T cells (bottom, right) within splenic CD8+ T cells from PDAC tumor-bearing mice treated with control vaccine (v-CTRL) and ADAM12 vaccine (v-A12). (n = 12 mice in v-CTRL and v-A12 respectively. Data were presented as mean ± SEM. Statistical test: unpaired two-tailed Student’s t-test.). (F) Spot-forming cells (SFC) in IFN-γ ELISpot of splenic CD4+ T cell and CD8+ T cell populations purified from tumor-bearing animals vaccinated with v-CTRL or v-A12 and restimulated with MutuDC1940 cells expressing ADAM12-derived epitopes (ADAM12 target) or with corresponding CTRL target (TurboGFP alone). (n = 6 independent samples in v-CTRL and v-A12 respectively. Data were presented as mean ± SEM. Statistical test: two-way ANOVA.). (G) Gene expression analysis of Adam12 in YAC-1, “KPPC”-derived KP2 PDAC cells (KP2) and ADAM12-expressing NIH 3T3 cells (NIH 3T3 A12). (H) Spontaneous baseline killing of YAC-1 cells by purified splenic CD8+ T cells from PDAC tumor-bearing mice vaccinated with v-CTRL or v-A12. (n = 3 independent samples in v-CTRL and v-A12, respectively. Data were presented as mean ± SEM. Statistical test: unpaired two-tailed Student’s t-test.). (I) Cytotoxic assay of purified splenic CD8+ T cells from PDAC tumor-bearing mice vaccinated with v-CTRL or v-A12 with target cells (KP2, NIH 3T3 A12). Data represented as fold change to v-CTRL. (n = 3 samples in v-CTRL and v-A12, respectively. Data were presented as mean ± SEM. Statistical test: unpaired two-tailed Student’s t-test.). (J) Spot-forming cells (SFC) in IFN-γ ELISpot of purified splenic CD8+ T cells from PDAC tumor-bearing mice vaccinated with control vaccine (v-CTRL) or ADAM12 vaccine (v-A12) co-cultured with target cells (KP2, NIH 3T3 A12). (n = 3 samples in v-CTRL and v-A12, respectively. Data were presented as mean ± SEM. Statistical test: unpaired two-tailed Student’s t-test). Source data are available online for this figure.
Figure 3
Figure 3. Therapeutic ADAM12 vaccination limits the growth of subcutaneous pancreatic carcinoma.
(A) Scheme of therapeutic vaccination on subcutaneous KP2 PDAC tumor-bearing mice. (B) Time course of tumor volume (in mm3) of KP2 PDAC allografts upon the first prime vaccination (day 21). (n = 8 mice in v-CTRL, n = 9 mice in v-A12, * indicates p = 0.0222, Statistical test: unpaired two-tailed Student’s t-test.). (C) KP2 PDAC tumor volume at the endpoint day 35. (n = 8 mice in v-CTRL, n = 9 mice in v-A12. Data were presented as mean ± SEM. Statistical test: unpaired two-tailed Student’s t-test.). (D, E) Quantitative analysis of ADAM12-positive area (D, upper) (ADAM12 antibody, Invitrogen, PA5-50594) and collagen deposition (E, upper) on tumor sections of KP2 PDAC allografts treated with v-CTRL and v-A12 and representative images of ADAM12 immunostaining (D, bottom) and Sirius Red/Fast Green staining (E, bottom). (n = 7–8 mice in v-CTRL, n = 9 mice in v-A12. Data were presented as mean ± SEM. Statistical test: unpaired two-tailed Student’s t-test. Scale bar 100 μm). (F) Quantitative analysis of tubule area on PDAC tumors treated with v-CTRL and v-A12 (upper), and representative images of image segmentation strategy (bottom). (n = 8 mice in v-CTRL, n = 9 mice in v-A12. Data were presented as mean ± SEM. Statistical test: unpaired two-tailed Student’s t-test. Scale bar 50 μm). (G) Quantitative analysis of CD4+ T cell population at the edge of PADC tumor tissue (left) and interior of PDAC tissue (right). (n = 7 mice in v-CTRL, n = 8 mice in v-A12. Data were presented as mean ± SEM. Statistical test: unpaired two-tailed Student’s t-test. Scale bar 100 μm). (H) Quantitative analysis of CD8+ T cell population at the edge of PADC tumor tissue (left) and interior of PDAC tissue (right). (n = 8 mice in v-CTRL, n = 9 mice in v-A12. Data were presented as mean ± SEM. Statistical test: unpaired two-tailed Student’s t-test. Scale bar 100 μm). Source data are available online for this figure.
Figure 4
Figure 4. Therapeutic vaccination against ADAM12 limits the growth of orthotopic pancreatic carcinomas.
(A) Experimental scheme of therapeutic ADAM12 vaccination (v-A12) on orthotopic KPC PDAC tumor-bearing mice. (B) Tumor volume at the endpoint, day 23. (n = 13 mice in v-CTRL, n = 14 mice in v-A12. Data were presented as mean ± SEM. Statistical test: unpaired two-tailed Student’s t-test.). (C) Representative images of ADAM12 immunostaining (left) (ADAM12 antibody, Invitrogen, PA5-50594) and quantitative analysis of ADAM12-positive area (right) on tumor sections of orthotopic PDAC allografts treated with v-CTRL and v-A12. (n = 5 mice in v-CTRL, n = 7 mice in v-A12. Data were presented as mean ± SEM. Statistical test: unpaired two-tailed Student’s t-test. Scale bar 100 μm). (D) Representative images of collagen tissue collagen deposition by Sirius Red/Fast Green staining (left) and quantitative analysis of collagen deposition (right) on tumor sections of orthotopic PDAC allografts treated with v-CTRL and v-A12. (n = 5 mice in v-CTRL and n = 7 mice in v-A12. Data were presented as mean ± SEM. Statistical test: unpaired two-tailed Student’s t-test. Scale bar 50 μm). (E) FACS analysis of the total number of T cells (left) and CD8+ T cells (right) per 1 M single cells analyzed in orthotopic PDAC tumors. (n = 10–12 mice in v-CTRL, n = 10–11 mice in v-A12. Data were presented as mean ± SEM. Statistical test: unpaired two-tailed Student’s t-test.). (F) Representative immunofluorescence staining images (left) and quantitative analysis of vascular density as indicated by CD31 (upper, right) and pericyte coverage assessed by α-SMA/CD31 co-localization (bottom, right) on PDAC tumors with either control vaccine (v-CTRL) or ADAM12 vaccine (v-A12). (n = 5 mice in v-CTRL and n = 7 mice in v-A12. Data were presented as mean ± SEM. Statistical test: unpaired two-tailed Student’s t-test. Scale bar 100 μm). (G) Representative immunofluorescence staining images (left) and quantitative analysis of tumor hypoxia via the coverage of GLUT1-positive cells (fight) on orthotopic PDAC from v-CTRL mice v-A12 mice. (n = 5 mice in v-CTRL and n = 7 mice in v-A12. Data were presented as mean ± SEM. Statistical test: unpaired two-tailed Student’s t-test. Scale bar 100 μm). (H) Liver metastasis quantification. (n = 13 mice in v-CTRL, n = 14 mice in v-A12. Data were presented as mean ± SEM. Statistical test: unpaired two-tailed Student’s t-test.). Source data are available online for this figure.
Figure EV1
Figure EV1. ADAM12 expression and characterization on KP2 PDAC tumor tissue.
(A) Representative image of ADAM12 immunofluorescence staining (ADAM12 antibody, Invitrogen, PA5-50594) on the healthy pancreas and PDAC tumor tissue from KPPC transgenic mice. (Scale bar 100 μm). (B) Representative images of Sirius Red/Fast Green staining on subcutaneous KP2 PDAC sections from v-CTRL mice and v-A12 mice. (Scale bare 100 μm). (C) Representative image of ADAM12 immunostaining (ADAM12 antibody, Invitrogen, PA5-50594) on PDAC tumor sections from subcutaneous KP2 PDAC grafts. (Scale bar 100 μm; for the zoom-in picture, the scale bar is 50 μm). (D) Representative images (left) and quantitative analysis (right) of ADAM12+ cell characterization, ADAM12+ CAFs were indicated as ADAM12+/α-SMA+ (upper, left) and ADAM12+/PDGFR-β+ (middle, left), and ADAM12+ tumor cells were indicated as ADAM12+/CK19+ (bottom, left) co-expression on subcutaneous KP2 PDAC tumors. (n = 12 fields of view from four mice. Data were presented as mean ± SEM. Scale bar is 200 μm, and the scale bar of the zoomed-in picture is 50 μm). (E) Vector maps of CTRL vaccine (v-CTRL) and ADAM12 vaccine (v-A12). (F) Quantitative analysis of ADAM12+/α-SMA+ (left, left), ADAM12+/PDGFR-β+ (left, middle), and ADAM12+/CK19+ (left, right) co-expression on PDAC tumors from control-vaccinated mice (v-CTRL) and ADAM12-vaccinated mice (v-A12). Data were represented as the number of cells per high power field (HPF). Representative double positive cells were indicated by white arrows respectively. (n = 12–16 in v-CTRL, n = 8–9 in v-A12. Data were presented as mean ± SEM. Statistical test: multiple t-test. Scale bar 50 μm).
Figure EV2
Figure EV2. Prophylactic ADAM12 vaccination increased tumor vascular density and pericyte coverage.
(A) Quantitative analysis of the absolute number of neutrophils (left) and macrophages (middle) within PDAC tumor tissues from control-vaccinated mice (v-CTRL) and ADAM12-vaccinated mice (v-A12); corresponding flow cytometry gating strategy of myeloid cells (right): neutrophils were identified as CD45+CD11b+Ly6G+ cells; monocytes were gated based on non-neutrophils (negative gating), and then identified as CD11b+Ly6C+ population. Then, monocyte macrophages were further defined with an F4/80+ signal. (n = 12 mice in v-CTRL, n = 12 mice in v-A12. Data were presented as mean ± SEM. Statistical test: unpaired two-tailed Student’s t-test). (B) Representative immunofluorescence staining images (left) and quantitative analysis of CD31-positive endothelial cells (right) on PDAC tumors from mice treated with either control vaccine (v-CTRL) or ADAM12 vaccine (v-A12). (n = 6 mice in v-CTRL, n = 6 mice in v-A12. Data were presented as mean ± SEM. Statistical test: unpaired two-tailed Student’s t-test. Scale bar 50 μm). (C) Representative immunofluorescence staining images (left) and quantitative analysis of pericyte coverage assessed by α-SMA/CD31 co-localization on PDAC tumors with either control vaccine (v-CTRL) or ADAM12 vaccine (v-A12) and representative images of α-SMA/CD31 immunostaining. (n = 6 mice in v-CTRL, n = 6 mice in v-A12. Data were presented as mean ± SEM. Statistical test: unpaired two-tailed Student’s t-test. Scale bar 50 μm). (D) Representative immunofluorescence staining images (left) and quantitative analysis of tumor hypoxia via GLUT1-positive cells on subcutaneous PDAC from v-CTRL mice and v-A12 mice together with representative images of GLUT1 immunostaining. (n = 6 mice in v-CTRL, n = 6 mice in v-A12. Data were presented as mean ± SEM. Statistical test: unpaired two-tailed Student’s t-test. Scale bar 50 μm). (E) Gene expression analysis of the KP2-specific gene CK19 in peripheral blood at endpoint (day 28 post tumor inoculation) from subcutaneous PDAC mouse model with control vaccine (v-CTRL) or ADAM12 vaccine (v-A12). (n = 5 mice in v-CTRL, n = 5 mice in v-A12. Data were presented as mean ± SEM. Statistical test: unpaired two-tailed Student’s t-test).
Figure EV3
Figure EV3. Therapeutic ADAM12 vaccination targets ADAM12+ CAFs and inhibits cell proliferation in subcutaneous PDAC tumors.
(A) Representative immunofluorescence staining images (left) and quantitative analysis (right) of ADAM12+/α-SMA+ (left, left), ADAM12+/PDGFR-β+ (left, middle), and ADAM12+/CK19+ (left, right) co-expression on PDAC tumors from control-vaccinated mice (v-CTRL) and ADAM12-vaccinated mice (v-A12). Data were represented as the number of cells per high power field. Representative double positive cells were indicated by white arrows respectively. (n = 7–8 mice in v-CTRL, n = 8 mice in v-A12. Data were presented as mean ± SEM. Statistical test: multiple t-test. Scale bar 50 μm). (B) Representative immunofluorescence images (left) and quantitative analysis (right) of proliferating (Ki67+) ADAM12+ cells on PDAC tumors from v-CTRL mice and v-A12 mice. (n = 7 mice in v-CTRL, n = 6 mice in v-A12. Data were presented as mean ± SEM. Statistical test: unpaired two-tailed Student’s t-test. Scale bar 50 μm). (C) Representative immunofluorescence staining images (left) and quantitative analysis (right) of proliferating (Ki67+) tumor (CK19+) cells on PDAC tumors from v-CTRL mice (n = 7) and v-A12 mice (n = 6). (n = 7 mice in v-CTRL, n = 6 mice in v-A12. Data were presented as mean ± SEM. Statistical test: unpaired two-tailed Student’s t-test. Scale bar 50 μm). (D) Scheme of therapeutic vaccination with gemcitabine treatment on subcutaneous KP2 PDAC tumor-bearing mice. (E) Representative immunofluorescence images (left) and quantitative analysis (right) of apoptotic cells (cleaved caspase 3+) on PDAC tumors from v-CTRL mice and v-A12 mice. (n = 5 mice in v-CTRL, n = 6 mice in v-A12. Data were presented as mean ± SEM. Statistical test: unpaired two-tailed Student’s t-test. Scale bar 50 μm).
Figure EV4
Figure EV4. Therapeutic ADAM12 vaccination increased tumor vascular density, pericyte coverage, and decreased tumor hypoxia.
(A) Representative images of immunofluorescence staining (left) and quantitative analysis of CD31-positive endothelial cells (right) on subcutaneous PDAC tumors treated with control vaccine (v-CTRL) and ADAM12 vaccine (v-A12) together with representative images of CD31 immunostaining. (n = 8 mice in v-CTRL, n = 9 mice in v-A12, Data were presented as mean ± SEM. Statistical test: unpaired two-tailed Student’s t-test. Scale bar 100 μm). (B) Representative images of immunofluorescence staining (left, right) and quantitative analysis of pericyte coverage (middle, upper) assessed by α-SMA/CD31 co-localization (yellow) as well as vascular perfusion (middle, bottom) presented by FITC-lectin+/CD31+ cells on PDAC tumors treated with control vaccine (v-CTRL) and ADAM12 vaccine (v-A12). Representative pericytes were indicated by white arrows respectively. (Pericyte coverage: n = 8 mice in v-CTRL, n = 9 mice in v-A12; vascular perfusion: n = 5 mice in v-CTRL, n = 6 mice in v-A12. Data were presented as mean ± SEM. Statistical test: unpaired two-tailed Student’s t-test. Scale bar 50 μm). (C) Representative images of immunofluorescence staining (left, right) and quantitative analysis of tumor hypoxia by GLUT1-positive cells (middle, upper) as well as by the coverage of Pimonidazole positive area (middle, bottom) on PDAC tumors from mice treated with control vaccine (v-CTRL, n = 8) or ADAM12 vaccine (v-A12, n = 9). (GLUT1 staining: n = 8 mice in v-CTRL, n = 9 mice in v-A12; Pimonidazole staining (hypoxyprobe): n = 12 mice in v-CTRL, n = 12 in v-A12. Data were presented as mean ± SEM. Statistical test: unpaired two-tailed Student’s t-test. Scale bar 100 μm). (D) Gene expression analysis of the KP2-specific gene CK19 and OLFM4 in peripheral blood at endpoint (day 28 post tumor inoculation) from subcutaneous PDAC mouse model with control vaccine (v-CTRL) or ADAM12 vaccine (v-A12). (n = 5 mice in v-CTRL, n = 5 mice in v-A12. Data were presented as mean ± SEM. Statistical test: unpaired two-tailed Student’s t-test).
Figure EV5
Figure EV5. Therapeutic ADAM12 vaccination in mice bearing orthotopic PDAC tumors decreased ADAM12+CAFs, stimulated splenic CD8 T cell response, and promoted T cell relocalization within the PDAC tumor tissue.
(A) Representative immunofluorescence staining images (left) and quantitative analysis (right) of ADAM12+/α-SMA+ (left, left), ADAM12+/PDGFR-β+ (left, middle) and ADAM12+/CK19+ (left, right) co-expression on PDAC tumors from control-vaccinated mice (v-CTRL, n = 5 mice) and ADAM12-vaccinated mice (v-A12, n = 7 mice). Data were represented as the number of cells per high power field (HPF). Representative double positive cells were indicated by white arrows respectively. (n = 5 in v-CTRL, n = 7 in v-A12. Data were presented as mean ± SEM. Statistical test: unpaired two-tailed Student’s t-test. Scale bar 50 μm). (B) Quantitative FACS analysis of the absolute number of T cells, CD8+ T cells, CD62L-CD8+ effector T cells, CD4+ T cells, and CD62L-CD4+ effector T cells in spleens from control-vaccinated mice (v-CTRL) and ADAM12-vaccinated mice (v-A12). (n = 12 mice in v-CTRL, n = 14 mice in v-A12. *n = 10 mice in v-CTRL in the CD62L-CD8+ effector T cell population because of two outliers. Data were presented as mean ± SEM. Statistical test: unpaired two-tailed Student’s t-test.). (C) Quantitative analysis of the number of neutrophils (left) and macrophages (right) per 1 M single cells in PDAC tumors from control-vaccinated mice (v-CTRL) and ADAM12-vaccinated mice (v-A12). (n = 10 mice in v-CTRL, n = 11 mice in v-A12. Data were presented as mean ± SEM. Statistical test: unpaired two-tailed Student’s t-test.). (D) Representative images of CD8+ T cell (left) and CD4+ T cell (right) localization, and quantitative analysis of CD8+ T cell and CD4+ T cell population at the edge of PADC tumor tissue (right, upper) and the interior of PDAC tumor tissue (right, bottom). (n = 5 mice in v-CTRL, n = 5 mice in v-A12. Data were presented as mean ± SEM. Statistical test: unpaired two-tailed Student’s t-test. Scale bar 50 μm). (E) Representative hepatic micrometastasis (area indicated within the white dotted outline) image with H&E staining, scale bar 50 µm.

References

    1. Aghababaei M et al (2013) A disintegrin and metalloproteinase 12 (ADAM12) localizes to invasive trophoblast, promotes cell invasion and directs column outgrowth in early placental development. Mol Hum Reprod 20(3):235–249 - PubMed
    1. Airley RE et al (2003) Glut-1 and CAIX as intrinsic markers of hypoxia in carcinoma of the cervix: relationship to pimonidazole binding. Int J Cancer 104(1):85–91 - PubMed
    1. Cazet AS et al (2018) Targeting stromal remodeling and cancer stem cell plasticity overcomes chemoresistance in triple negative breast cancer. Nat Commun 9(1):2897 - PMC - PubMed
    1. Devaud C et al (2013) Immune modulation of the tumor microenvironment for enhancing cancer immunotherapy. Oncoimmunology 2(8):e25961 - PMC - PubMed
    1. Di Carlo SE et al (2023) Depletion of slow-cycling PDGFRα+ADAM12+ mesenchymal cells promotes antitumor immunity by restricting macrophage efferocytosis. Nat Immunol 24(24):1867–1878 - PMC - PubMed

MeSH terms