. 2024 Oct 30;8(1):246.
doi: 10.1038/s41698-024-00742-3.

CCL3 predicts exceptional response to TGFβ inhibition in basal-like pancreatic cancer enriched in LIF-producing macrophages

Affiliations

CCL3 predicts exceptional response to TGFβ inhibition in basal-like pancreatic cancer enriched in LIF-producing macrophages

Silvia Pietrobono et al. NPJ Precis Oncol. .

Abstract

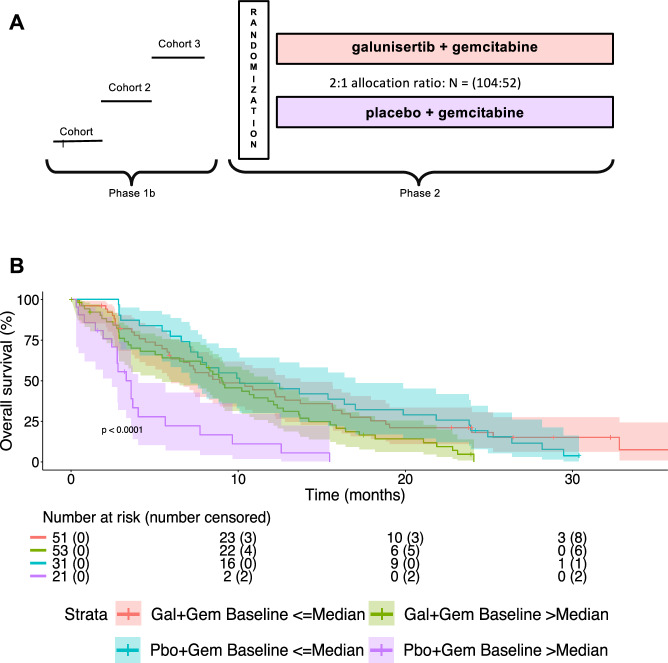
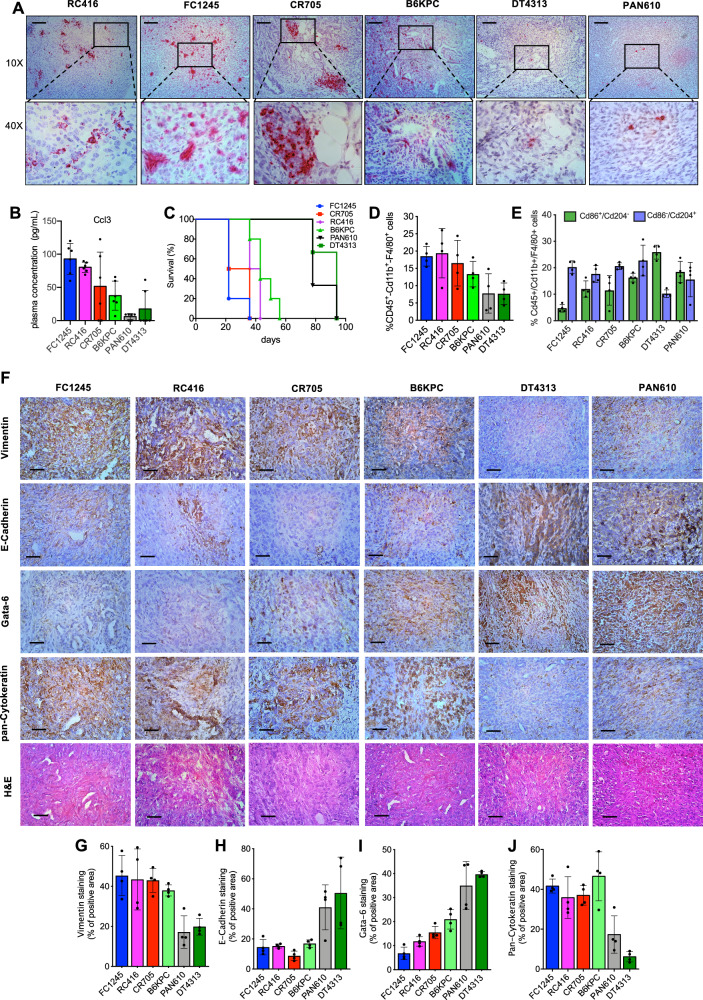
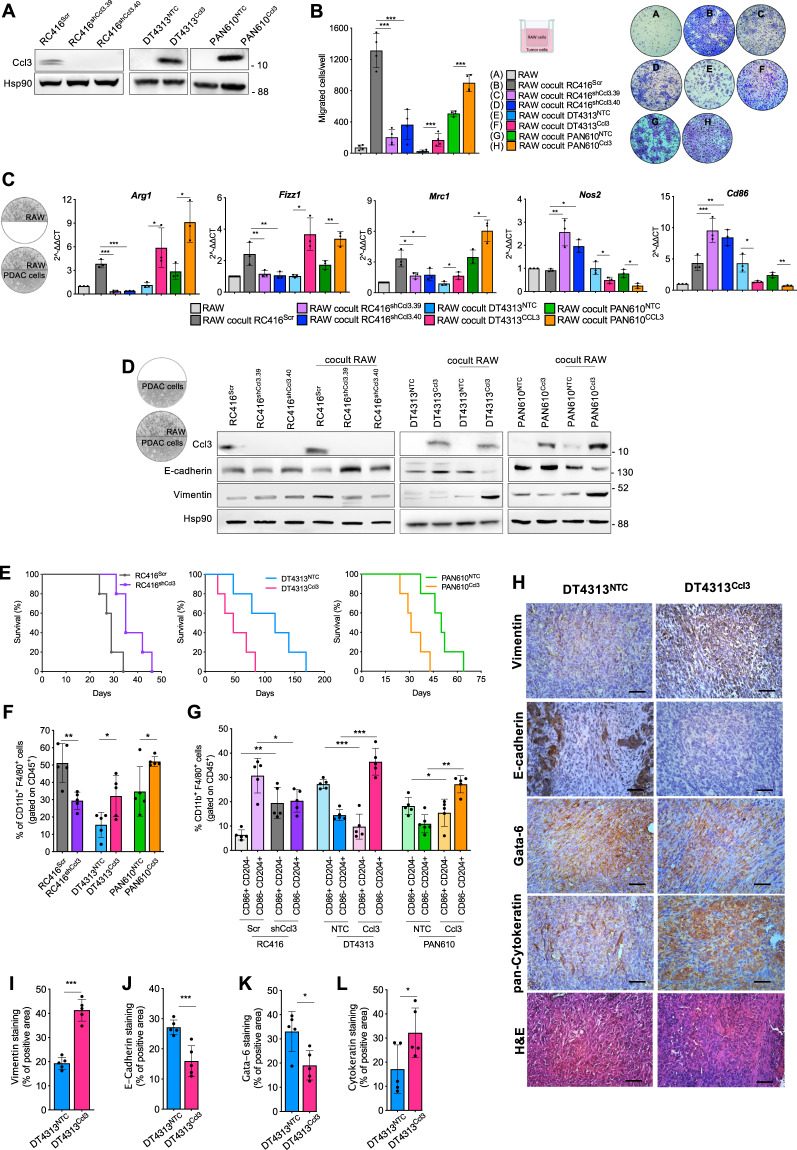
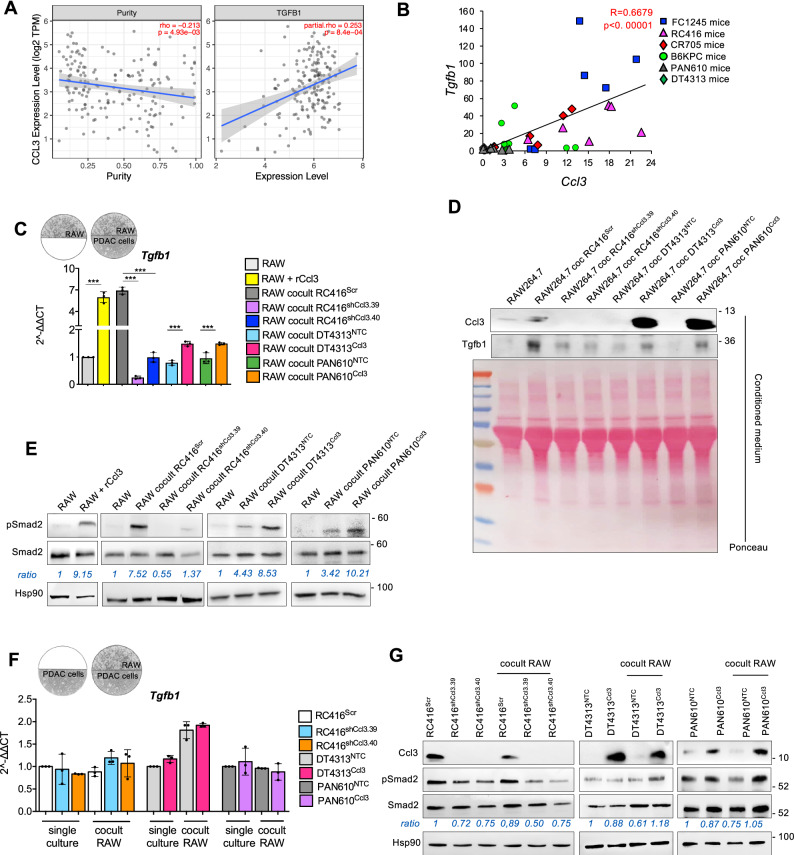
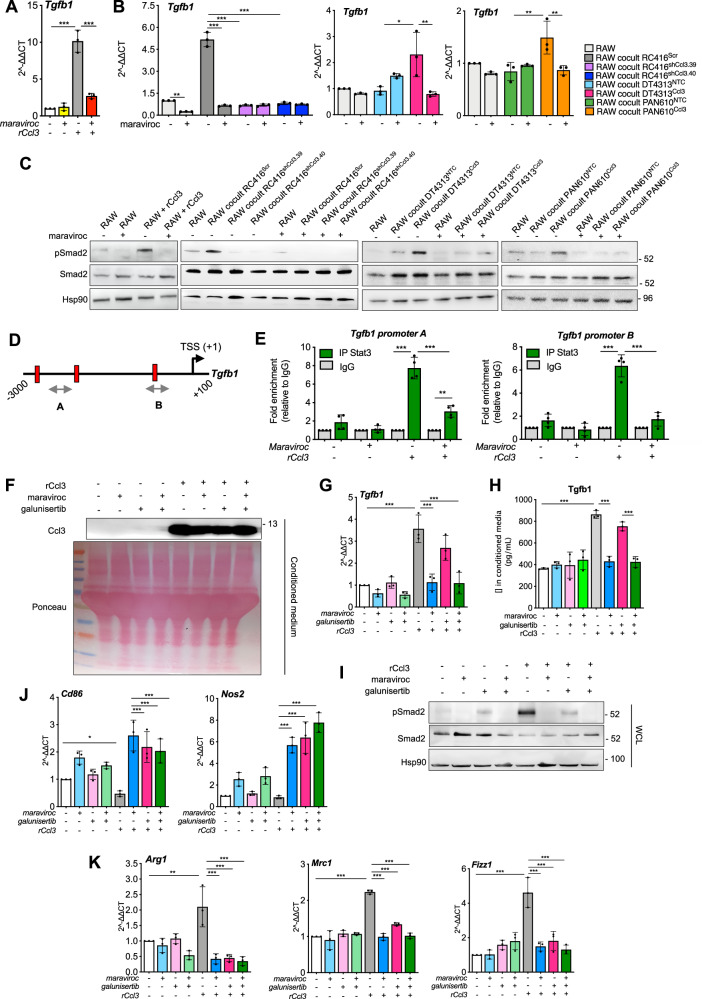
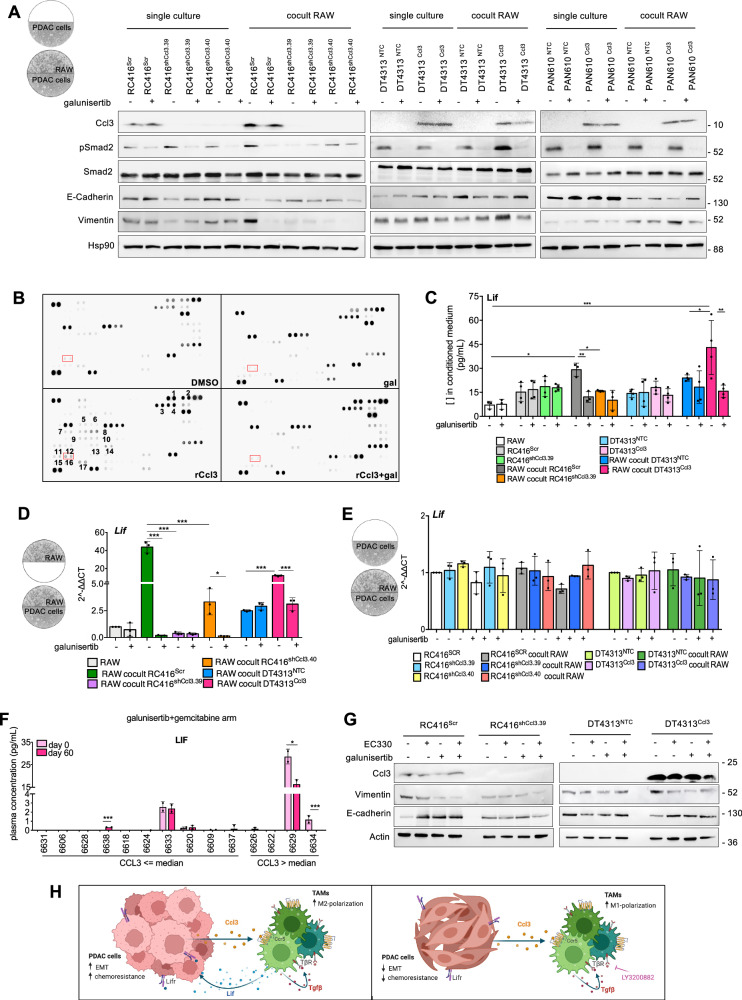
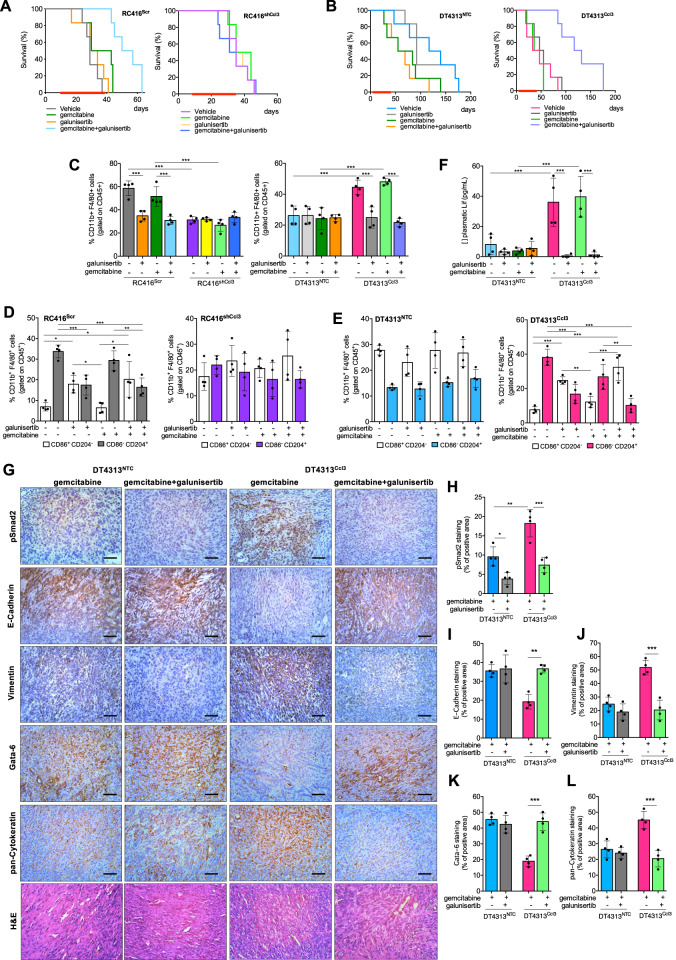
The TGFβ receptor inhibitor galunisertib showed promising efficacy in patients with pancreatic ductal adenocarcinoma (PDAC) in the phase 2 H9H-MC-JBAJ study. Identifying biomarkers for this treatment remains essential. Baseline plasma levels of chemokine CCL3 were integrated with clinical outcomes in PDAC patients treated with galunisertib plus gemcitabine (n = 104) or placebo plus gemcitabine (n = 52). High CCL3 was a poor prognostic factor in the placebo group (mOS 3.6 vs. 10.1 months; p < 0.01) but a positive predictor for galunisertib (mOS 9.2 vs. 3.6 months; p < 0.01). Mechanistically, tumor-derived CCL3 activates Tgfβ signaling in macrophages, inducing their M2 phenotype and Lif secretion, sustaining a mesenchymal/basal-like ecotype. TGFβ inhibition redirects macrophage polarization to M1, reducing Lif and shifting PDAC cells to a more epithelial/classical phenotype, improving gemcitabine sensitivity. This study supports exploring TGFβ-targeting agents in PDAC with a mesenchymal/basal-like ecotype driven by high CCL3 levels.


Conflict of interest statement

DM received honoraria as an advisory board member or consultant from Servier, Incyte, Tahio, iOnctura, Eli Lilly, Evotec, Shire, Baxter; received institutional support for research project from Shire, Celgene, Incyte, iOnctura, Roche. The other authors have declared that no conflict of interest exists.

Figures

Fig. 1
Fig. 1. Plasma levels of CCL3 predict response to galunisertib plus chemotherapy in patients with advanced PDAC.
A Study design diagram. B Kaplan-Meier estimates of overall survival (OS) by plasma levels of CCL3, with 95% confidence bands and numbers at risk. Gal galunisertib, Gem gemcitabine, Pbo placebo.
Fig. 2
Fig. 2. Characterization of orthotopic murine PDAC tumors.
A Representative RNA in situ hybridization (ISH) images of Ccl3 in tumor sections from mice bearing FC1245, RC416, CR705, B6KPC, DT4313 and PAN610 cells. Scale bar: 150 μm. B Plasma levels of Ccl3 were measured in C57BL/6 J mice bearing orthotopic PDAC tumors from 6 different murine PDAC cell lines using Enzyme-Linked Immunosorbent Assay (ELISA). Data are expressed as mean ± s.d. (n = 6). C Median overall survival (mOS) of C57BL/6 J mice bearing orthotopic PDAC tumors (n = 6). D, E Flow cytometry analysis of Cd45+/Cd11b+/F4/80+ tumor-associated macrophages (TAMs) (D) and their M2 (Cd45+/Cd11b+/F4/80+/Cd204+/Cd86)/M1(Cd45+/Cd11b+/F4/80+/Cd204/Cd86+) ratio (E) in FC1245, RC416, CR705, B6KPC, DT4313 and PAN610 tumor samples. Data are expressed as mean ± s.d. (n = 4). F Representative images of FC1245, RC416, CR705, B6KPC, DT4313 and PAN610 tumors stained with E-cadherin, vimentin, gata-6, pan-cytokeratin antibodies and H&E. Scale bar = 60 μm. GJ Quantification of paraffin sections from orthotopic murine PDAC tumors stained as indicated in (F). Data are expressed as mean ± s.d. (n = 4).
Fig. 3
Fig. 3. Ccl3 favors recruitment and M2-polarization of TAMs that induce the acquisition of mesenchymal features in tumor cells.
A Representative western blot of Ccl3 in RC416, DT4313 and PAN610 cells transduced as indicated. Hsp90 was used as loading control. B Transwell migration assay of RAW264.7 macrophages as single culture or co-cultured as indicated. Results show mean ± s.d (n = 4). C qPCR analysis of M2 (Arg1, Fizz1, Mrc1) and M1 (Inos2, Cd86) markers in RAW264.7 cells as single cultures or co-cultured with RC416, DT4313 or PAN610 transduced as indicated. Data are shown as mean ± s.d (n = 3). A schematic representation of the co-culture technique used to culture RAW264.7 macrophages with PDAC cell lines is shown. D Representative western blot of Ccl3 and EMT markers in RC416, DT4313 and PAN610 transduced as indicated. Hsp90 was used as loading control. A schematic representation of the co-culture technique used to culture PDAC cell lines with RAW264.7 macrophages is shown. E mOS duration of C57BL6/J mice bearing orthotopic tumors from RC416, DT4313 or PAN610 transduced as indicated (n = 5). F, G Flow cytometry analysis showing increased Cd45+/Cd11b+/F4/80+ TAMs recruitment (F) and M1(Cd45+/Cd11b+/F4/80+/Cd204/Cd86+)/M2(Cd45+/Cd11b+/F4/80+/ Cd204+/Cd86) skewing (G) in Ccl3-high RC416Scr, DT4313Ccl3 and PAN610 Ccl3 tumors compared with Ccl3-low RC416shCcl3, DT4313NTC or PAN610NTC controls (n = 5). Data are expressed as mean ± s.d. P values were calculated by two-tailed unpaired Student’s t test (F, I, J, K, L), or ANOVA and Tukey’s test (B, C, G). HL Representative images of paraffin sections from DT4313NTC and DT4313Ccl3 orthotopic tumors stained with vimentin, E-cadherin, Gata-6 or pan-cytokeratin antibodies (H) and relative quantifications (IL). Scale bar = 60 μm. Data are expressed as mean ± s.d. (n = 5). *p < 0.05; **p < 0.01; ***p < 0.001.
Fig. 4
Fig. 4. Ccl3 activates TGFβ signaling in macrophages.
A Correlation of Ccl3 expression with tumor purity (left) and with TGFB1 expression (right) in PAAD patients from TIMER2.0 (n = 179). B Correlation between Tgfb1 and Ccl3 mRNA expression in tumors from C57BL6/J orthotopic PDAC models (n = 36). C qPCR of Tgfb1 in RAW264.7 unstimulated or stimulated with rCcl3, and as single cultures or co-cultured with RC416, DT4313 or PAN610 transduced as indicated. Results show mean ± s.d of 3 biological replicates. A schematic representation of the co-culture technique used to culture RAW264.7 macrophages with PDAC cell lines is shown. D Representative western blot of secreted Ccl3 and Tgfβ1 proteins in the conditioned medium of RAW264.7 macrophages as single cultures or cocultured with RC416, DT4313 and PAN610 transduced as indicated. Ponceau served as loading control. E Representative western blot of pSmad2 and Smad2 in RAW264.7 as single cultures or co-cultured as indicated. Hsp90 was used as loading control. Quantification of pSmad2/Smad2 is shown. F qPCR of Tgfb1 in RC416, DT4313 or PAN610 transduced as indicated, as single cultures or co-cultured with RAW264.7. Results show mean ± s.d of 3 biological replicates. A schematic representation of the co-culture technique used to culture PDAC cells with RAW264.7 macrophages is shown. P values in (C) and (F) were calculated by one-way ANOVA and Tukey’s test. G Representative western blot of pSmad2 and Smad2 in RC416, DT4313 or PAN610 transduced as indicated, as single cultures or co-cultured with RAW264.7. Hsp90 was used as loading control. Quantification of pSmad2/Smad2 is shown. *p < 0.05; **p < 0.01; ***p < 0.001.
Fig. 5
Fig. 5. The Ccr5 inhibitor maraviroc prevents the Ccl3-mediated activation of TGFβ signaling in macrophages.
A qPCR of Tgfb1 in RAW264.7 macrophages in presence or absence of rCcl3, after treatment with DMSO or 5 μM maraviroc. Results show mean ± s.d (n = 3). B qPCR of Tgfb1 in RAW as single cultures or co-cultured with RC416, DT4313 or PAN610 transduced as indicated, after treatment with DMSO or maraviroc (5 μM). Results show mean ± s.d (n = 3). C Representative western blot of pSmad2 and Smad2 in RAW264.7 in presence or absence of rCcl3, and as single cultures or in co-culture with RC416, DT4313 and PAN610 transduced as indicated, after treatment with DMSO or 5 μM maraviroc. Hsp90 was used as loading control. D Schematic representation of Tgfb1 promoter (available at UCSC Genome Browser GRCm38/mm10) with the position of ChIP probes (gray double arrowhead) and consensus Stat3 binding sites (TTC(N)2-4GAA) (vertical slashes) relative to the transcription starting site (TSS). E ChIP-qPCR of Stat3 occupancy at the Tgfb1 promoter in RAW264.7 macrophages upon stimulus with rCcl3, in the presence or absence of 5 μM maraviroc. The y-axis represents relative promoter enrichment, normalized on input material. IgG was set to 1. Data are represented as mean ± s.d. (n = 4). F Representative western blot of secreted Ccl3 in the conditioned media of RAW264.7 macrophages stimulated or not with rCcl3, and treated with 5 μM maraviroc, 5 μM galunisertib, their combination or DMSO as control. G qPCR of Tgfb1 in RAW264.7 macrophages in the presence or absence of rCcl3 and treated as indicated. Results show mean ± s.d (n = 3). H Secreted levels of Tgfβ1 ligand measured in conditioned medium of RAW264.7 macrophages treated as indicated using Enzyme-linked immunosorbent assay (ELISA). Data are expressed as mean ± s.d. (n = 3). I Representative western blot of pSmad2 and Smad2 in RAW264.7 macrophages treated as indicated. Hsp90 was used as loading control. J, K qPCR of M1 (J) and M2 (K) markers in RAW264.7 macrophages in presence or absence of rCcl3 and treated as indicated. Results show mean ± s.d (n = 3). P values in (A, B, E, G, H, J and K) were calculated by one-way ANOVA and Tukey’s test. *p < 0.05; **p < 0.01; ***p < 0.001.
Fig. 6
Fig. 6. TAM-derived Lif acts as a mediator of TGFβ signaling in sustaining EMT in PDAC cells.
A Representative western blot of pSmad2, Smad2, E-cadherin or vimentin in RC416, DT4313 or PAN610 transduced as indicated, as single culture or co-cultured with RAW264.7 and treated with DMSO or 5 μM galunisertib for 48 h. Hsp90 was used as loading control. A schematic representation of the co-culture technique used to culture PDAC cells with RAW264.7 macrophages is shown. B Representative cytokine array from the supernatants of RAW264.7 macrophages treated with DMSO or galunisertib, in presence or absence of recombinant Ccl3 (rCcl3). 1.Ccl3; 2.Ccl5; 3.Cd14; 4.Cd40; 5.Cxcl11; 6.Cxcl13; 7.Fgf21; 8.Gas6; 9.IGFBP-6; 10.Il1a; 11.Il10; 12.Il11; 13.Il13; 14.Il15; 15.Leptin; 16.Lif; 17.Pentraxin-3. C Lif concentration in the supernatants of RAW264.7, RC416Scr, RC416shCcl3, DT4313NTC or DT4313Ccl3 as single cultures or in co-culture, after treatment with 5 μM galunisertib or DMSO for 48 h, measured by ELISA. Data are expressed as mean ± s.d. (n = 4). D qPCR of Lif in RAW as single culture or co-cultured as indicated and treated with 5 μM galunisertib or DMSO for 48 h. Data are expressed as mean ± s.d. (n = 3). A schematic representation of the co-culture technique used to culture RAW264.7 macrophages with PDAC cells is shown. E qPCR of Lif in RC416Scr, RC416shCcl3, DT4313NTC or DT4313Ccl3 tumor cells as single cultures or in co-culture with RAW264.7 macrophages, treated with 5 μM galunisertib or DMSO for 48 h. Data are expressed as mean ± s.d. (n = 3). A schematic representation of the co-culture technique used to culture PDAC cells with RAW264.7 macrophages is shown. F Plasma levels of LIF at baseline (day 0) and after two cycles of treatment (day 60) in low- and high-CCL3 patients enrolled in the H9H-MC-JBAJ trial treated with galunisertib plus gemcitabine, measured by ELISA. P values were calculated by two-tailed unpaired Student's t test. G Representative western blot of vimentin and E-cadherin in RC416 and DT4313 transduced as indicated, co-cultured with RAW264.7 macrophages and treated with 1 μM of the Lif inhibitor EC330, 5 μM of the TGFβ inhibitor galunisertib, their double combination or DMSO as vehicle control. Actin was used as loading control. H Proposed mechanism of action of the Ccl3/Ccr5/Tgfβ/Lif axis. P values in (CE) were calculated by one-way ANOVA and Tukey’s test. *p < 0.05; **p < 0.01; ***p < 0.001.
Fig. 7
Fig. 7. Inhibition of TGFβ signaling improves the activity of gemcitabine in Ccl3-high PDAC tumors.
A mOS of mice bearing RC416Scr or RC416shCcl3 orthotopic tumors treated with gemcitabine, galunisertib, their double combinations or their respective vehicles as control (n = 6). B mOS of mice bearing DT4313NTC or DT4313Ccl3 orthotopic tumors treated with gemcitabine, galunisertib, their double combinations, or their respective vehicles as control (n = 6). CE Flow cytometry analysis of Cd45+/Cd11b+/F4/80+ TAMs (C) and their M2 (Cd45+/Cd11b+/F4/80+/Cd204+/Cd86)/M1(Cd45+/Cd11b+/F4/80+/Cd204/Cd86+) ratio in tumors from mice bearing RC416 (D) or DT4313 (E) cells transduced as indicated and treated for 4 weeks with gemcitabine, galunisertib, their double combinations or their respective vehicles as control (n = 4). F Plasma levels of Lif measured by ELISA in DT4313NTC or DT4313Ccl3 orthotopic tumors treated as indicated (n = 4). G Representative images for DT4313NTC or DT4313Ccl3 tumors stained with pSmad2, E-cadherin, vimentin, Gata-6, pan-Cytokeratin antibodies, and H&E. Scale bar = 60 μm. HL Quantification of paraffin sections from orthotopic murine PDAC tumors stained as indicated in (G). Data in (CL) are expressed as mean ± s.d. (n = 4). P values in (CF and HL) were calculated by one-way ANOVA and Tukey’s test. *p < 0.05; **p < 0.01; ***p < 0.001.

References

    1. The Global Cancer Observatory. Pancreas, https://gco.iarc.fr/today/data/factsheets/cancers/13-Pancreas-fact-sheet... (2020).
    1. Siegel, R. L., Giaquinto, A. N. & Jemal, A. Cancer statistics, 2024. CA Cancer J. Clin.74, 12–49 (2024). - PubMed
    1. Rahib, L., Wehner, M. R., Matrisian, L. M. & Nead, K. T. Estimated projection of US cancer incidence and death to 2040. JAMA Netw. Open4, e214708 (2021). - PMC - PubMed
    1. Tamburrino, A., Piro, G., Carbone, C., Tortora, G. & Melisi, D. Mechanisms of resistance to chemotherapeutic and anti-angiogenic drugs as novel targets for pancreatic cancer therapy. Front. Pharm.4, 56 (2013). - PMC - PubMed
    1. Collisson, E. A. et al. Subtypes of pancreatic ductal adenocarcinoma and their differing responses to therapy. Nat. Med.17, 500–503 (2011). - PMC - PubMed

LinkOut - more resources