. 2024 Oct;634(8036):1196-1203.
doi: 10.1038/s41586-024-08053-0. Epub 2024 Oct 30.

Polyclonality overcomes fitness barriers in Apc-driven tumorigenesis

Affiliations

Polyclonality overcomes fitness barriers in Apc-driven tumorigenesis

Iannish D Sadien et al. Nature. 2024 Oct.

Abstract

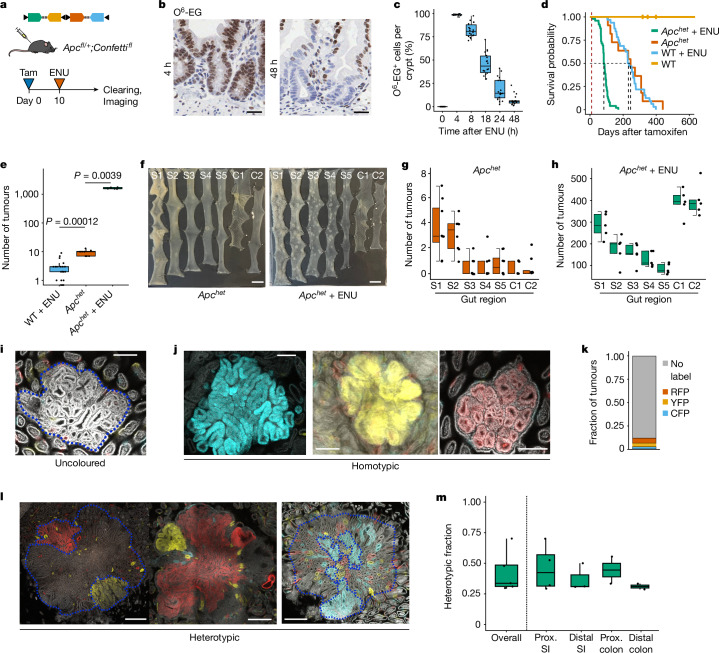
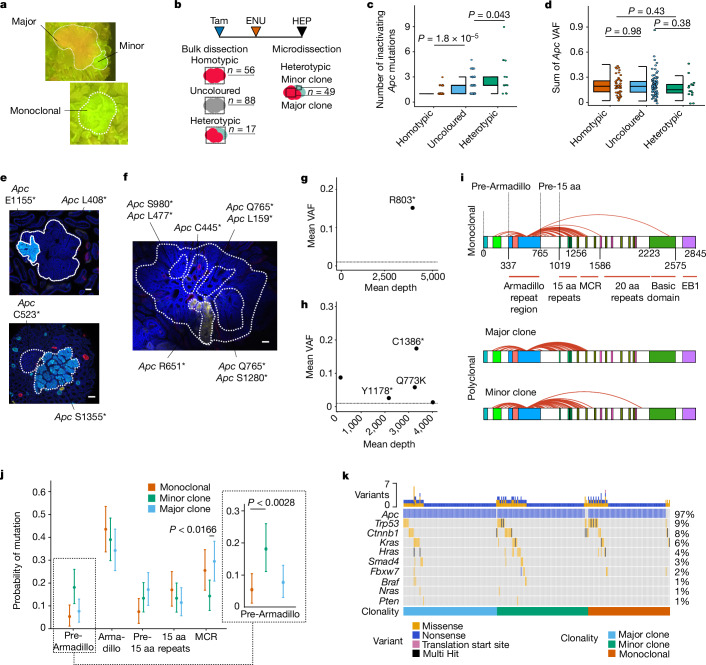
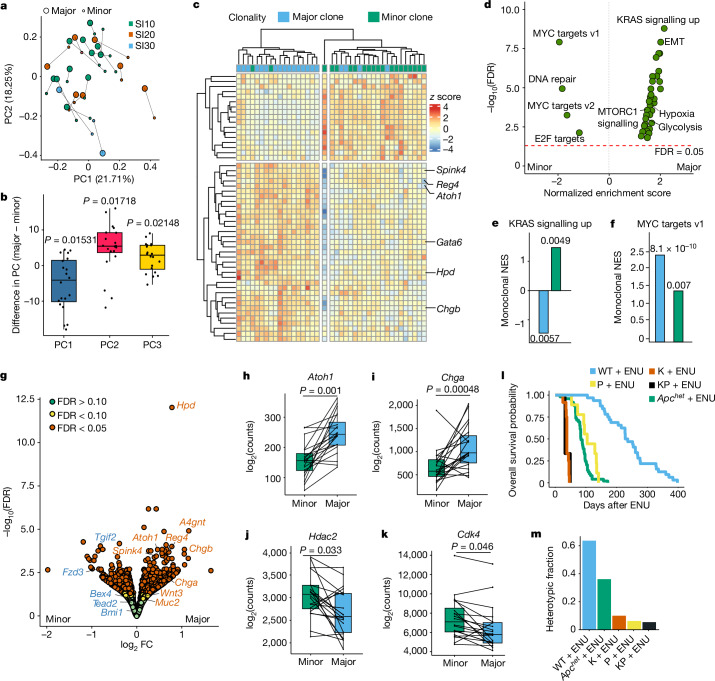
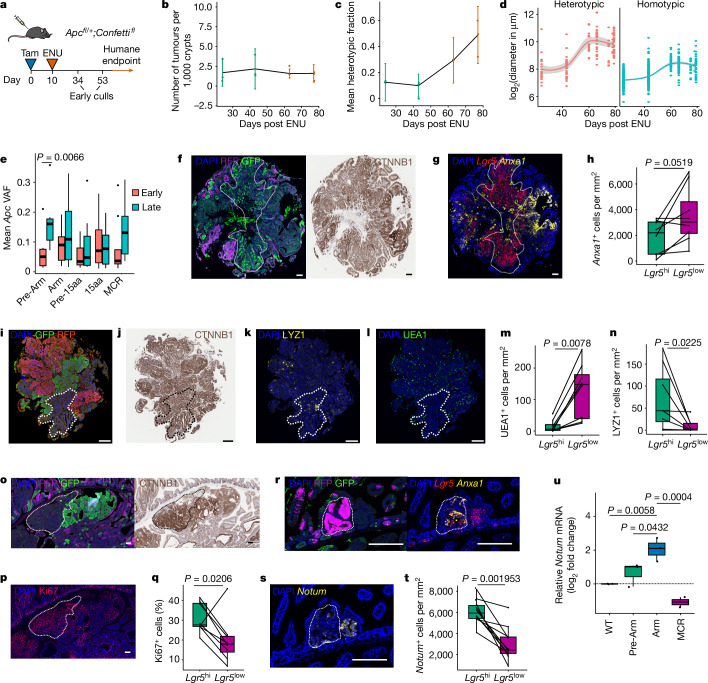
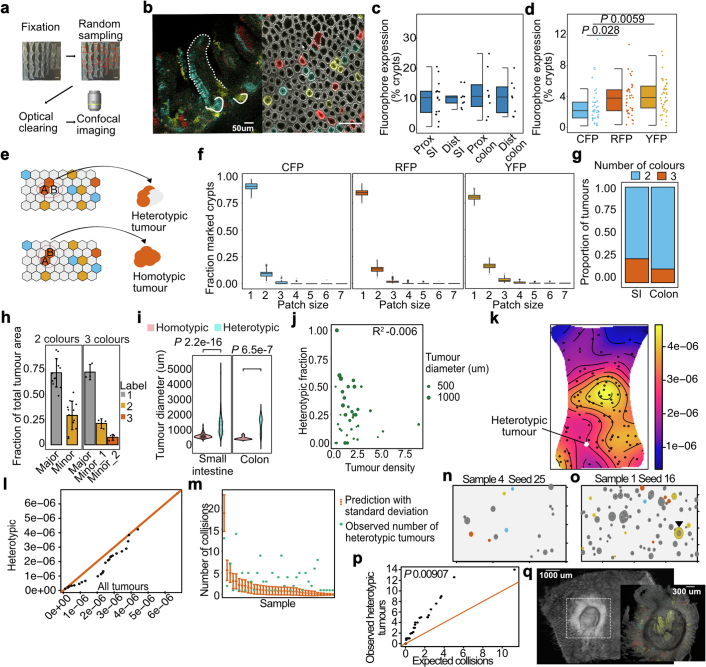
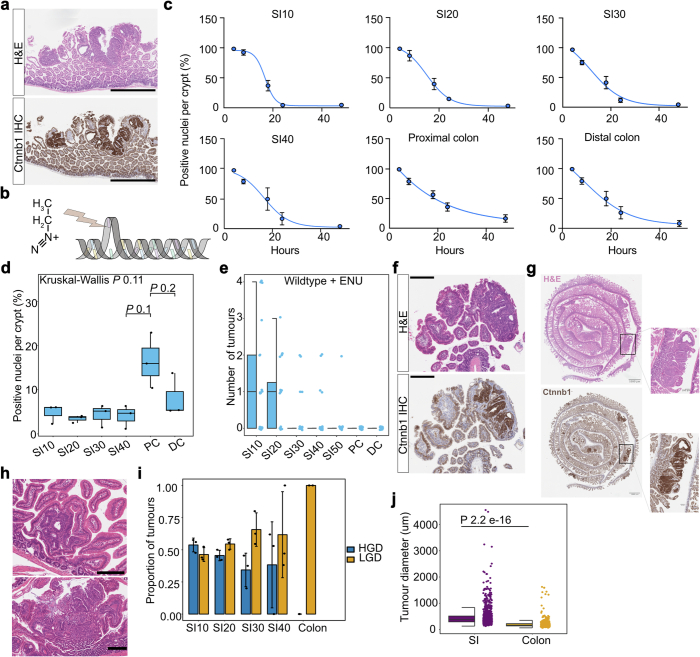
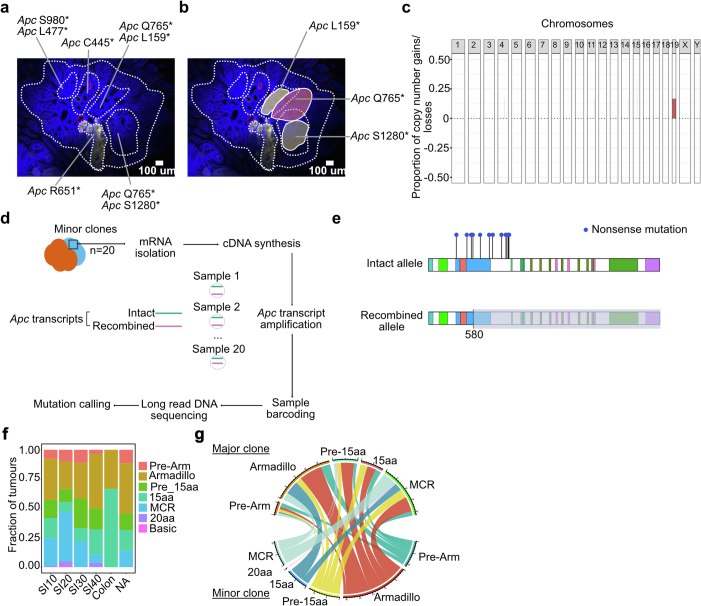
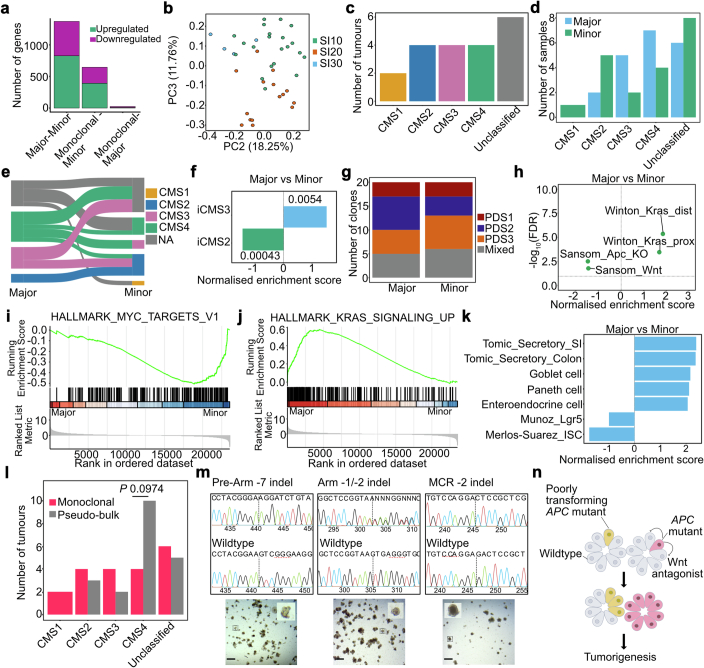
Loss-of-function mutations in the tumour suppressor APC are an initial step in intestinal tumorigenesis1,2. APC-mutant intestinal stem cells outcompete their wild-type neighbours through the secretion of Wnt antagonists, which accelerates the fixation and subsequent rapid clonal expansion of mutants3-5. Reports of polyclonal intestinal tumours in human patients and mouse models appear at odds with this process6,7. Here we combine multicolour lineage tracing with chemical mutagenesis in mice to show that a large proportion of intestinal tumours have a multiancestral origin. Polyclonal tumours retain a structure comprising subclones with distinct Apc mutations and transcriptional states, driven predominantly by differences in KRAS and MYC signalling. These pathway-level changes are accompanied by profound differences in cancer stem cell phenotypes. Of note, these findings are confirmed by introducing an oncogenic Kras mutation that results in predominantly monoclonal tumour formation. Further, polyclonal tumours have accelerated growth dynamics, suggesting a link between polyclonality and tumour progression. Together, these findings demonstrate the role of interclonal interactions in promoting tumorigenesis through non-cell autonomous pathways that are dependent on the differential activation of oncogenic pathways between clones.


Conflict of interest statement

The authors declare no competing interests.

Figures

Fig. 1
Fig. 1. Heterotypic expression of Confetti identifies polyclonal origins of Apc-deficient tumours.
a, Schematic of experimental approach. Tam, tamoxifen. b, Immunohistochemistry for O-6-ethyl-guanine (O6-EG) in small intestinal crypts after ENU treatment. Scale bars, 25 μm. c, Jitter plot quantifying O6-EG positivity with time following ENU injection. n = 3 mice per timepoint; 7 intestinal regions scored per mouse. d, Kaplan–Meier curves for Apchet + ENU, Apchet, wild-type (WT) + ENU and wild-type mice aged until the humane endpoint. Mantel–Cox P value < 0.0001. n = 49 mice for Apchet + ENU, 10 for Apchet, 32 for wild type + ENU and 5 for wild type. e, Number of intestinal tumours per mouse under indicated conditions. n = 5 mice for Apchet + ENU, 8 for Apchet, and 20 for wild type + ENU. Two-sided Wilcoxon rank-sum tests. f, Representative wholemounts for Apchet and Apchet + ENU. S1–S5, small intestine; C1, proximal colon; C2, distal colon. Scale bars, 10 mm. g,h, Regional differences in tumour burden. n = 8 mice for Apchet (g), 5 for Apchet + ENU (h). i,j, Representative confocal micrographs showing an uncoloured tumour (i) and three examples of homotypic tumours (j). Scale bars, 200 μm. k, Frequency of Confetti labels in homotypic tumours. Counts based on 1,352 intestinal tumours. n = 5 mice. l, Confocal micrographs showing three examples of heterotypic tumours. m, Mean heterotypic fraction and regional distribution. n = 5 mice. Prox., proximal; SI, small intestine. Scale bars, 500 μm. In all box plots, the centre line shows the median, the bottom hinge shows the 25% quantile, the top hinge shows the 75% quantile, the bottom whisker shows the smallest observation greater than or equal to bottom hinge minus 1.5 × interquartile range (IQR), and the top whisker shows the largest observation less than or equal to the top hinge plus 1.5 × IQR. Source Data
Fig. 2
Fig. 2. Polyclonal and monoclonal tumours are distinguished by Apc mutational profiling.
a, Fluorescence dissecting microscope view of a heterotypic tumour (top) and a homotypic tumour (bottom). b, Schematic of experimental approach. Tumours were either bulk- or micro-dissected before targeted amplicon sequencing. HEP, humane endpoint. c, Number of inactivating (nonsense-only) mutations in Apc for each bulk-sequenced tumour. Based on 56 homotypic, 88 uncoloured and 17 heterotypic tumours from 10 Apchet + ENU mice. Two-sided Wilcoxon rank-sum tests. d, Sum of the VAFs of the inactivating Apc mutations for each tumour in the indicated bulk-dissected groups. n = 148 tumours. Two-sided Wilcoxon rank-sum tests. e,f, Confocal images of micro-dissected heterotypic tumours overlaid with detected high-impact Apc variants (e) and a large micro-dissected heterotypic tumour (f). Scale bars, 100 μm. g,h, Representative clonality plots showing mean VAF versus mean sequencing depth for variants shown for a homotypic (g) and an uncoloured (h) tumour. Dotted line represents minimum VAF threshold for variant calls. i, Arch diagram overlaid on a schematic of the APC protein to compare high-impact Apc mutations in monoclonal and polyclonal tumours. Arches begins at codon 580, representing the Cre-mediated recombination event of the transgenic Apc allele. n = 94 monoclonal tumours, 105 major and 105 minor clones. EB1, EB1-binding region; MCR, mutation cluster region; aa, amino acid. j, Non-parametric bootstrap analysis showing the probability of mutation in each of the pre-defined Apc bins for monoclonal tumours, and major and minor clones. Data are mean ± 95% confidence interval. n = 94 samples per group. Inset, magnified view of the Pre-Armadillo bin, highlighting the significant difference between monoclonal tumours and minor clones. k, Oncoprint of mutational patterns among the indicated groups. Percentages on the right denote fraction of samples with detected mutations in particular gene. Source Data
Fig. 3
Fig. 3. Transcriptional profiling identifies clonal cooperation by reciprocity in RAS and MYC pathways.
a, PCA of comparison between major and minor clones, showing the first two principal components (PC1 and PC2). Major clones connect to corresponding minor clones. Colour represents location in the small intestine. b, Box plot of difference in principal component within major–minor pairs for each of PC1–PC3. Two-tailed one-sample Wilcoxon signed-rank test. c, Heat map with hierarchical clustering shows top 50 differentially expressed genes between the major and minor clones. d, Volcano plot showing normalized gene set enrichment scores for Hallmark Pathways in the comparison between major and minor clones. Dotted line denotes a false discovery rate (FDR) of 0.05. EMT, epithelial–mesenchymal transition. e,f, NES of Kras_Signaling_Up (e) and Myc_Targets_v1 (f) for Hallmark Pathways in monoclonal tumours relative to major clones and minor clones. n = 20 biological replicates (20 monoclonal tumours from 2 mice). Values represent FDR from gene set enrichment analysis. g, Volcano plot of differentially expressed genes between major and minor clones. Secretory genes are labelled in red and stem cell genes are labelled in blue. FC, fold change. hk, Transcript counts for Atoh1 (h), Chga (i), Hdac2 (j) and Cdk4 (k) in individual major and minor pairs. Paired two-tailed Wilcoxon tests. l, Kaplan–Meier survival curves for wild type + ENU, Trp53null (P) + ENU, KrasG12D/+ (K) + ENU, KrasG12D/+;Trp53null (KP) + ENU and Apchet + ENU. n = 32 mice for wild type + ENU, 9 mice for P + ENU, 12 mice for K + ENU, 5 mice for KP + ENU and 49 mice for Apchet + ENU. m, Heterotypic fraction across models described in l. Assessment based on 22 coloured tumours for wild type + ENU, 249 for Apchet + ENU, 90 for KrasG12D/+ + ENU, 144 for Trp53null + ENU and 185 for KrasG12D/+;Trp53null + ENU. n = 20 biological replicates per group in ak. Source Data
Fig. 4
Fig. 4. Growth dynamics and clonal phenotyping of heterotypic tumours.
a, Schematic of experimental approach. Mice were collected at early timepoints or aged until humane endpoint. b,c, Normalized number of tumours (b) and mean heterotypic fraction (c) after ENU. Early culls, green; humane endpoint, red. n = 3 mice, except at 63 days, where n = 2. Data are mean ± s.d. d, Growth curves for heterotypic and homotypic tumours. n = 3 mice at 24 and 43 days, 1 for other timepoints. Mixed-effects model for exponential growth phase, two-tailed t-test P < 0.0001. e, Apc VAFs for indicated domains. Tumours are classed as early (less than 80 days after ENU) and late (more than 80 days after ENU). n = 27 samples in the early group and 34 samples in the late group. Two-tailed t-test with Benjamini–Hochberg correction. f,g, Immunofluorescence staining for GFP and RFP, with β-catenin immunohistochemistry (f) or duplex RNAscope staining for Lgr5 and Anxa1 (g). h, Anxa1 positivity in Lgr5hi and Lgr5low clones within heterotypic tumours. il, Serial sections of heterotypic tumour. GFP and RFP immunofluorescence (i), β-catenin immunohistochemistry (j), lysozyme-1 (LYZ1) immunofluorescence (k) and UEA1 immunofluorescence (l). m,n, Quantification of UEA1 (m), LYZ1 (n) in Lgr5hi and Lgr5low clones within heterotypic tumours. o,p, Serial sections with immunofluorescence for GFP and RFP and immunohistochemistry for β-catenin (o) and immunofluorescence for Ki67 (p). q, Quantification of Ki67 positivity in Lgr5hi and Lgr5low clones within heterotypic tumours. r,s, Serial sections with immunofluorescence staining for GFP and RFP and duplex RNAscope staining for Lgr5 and Anxa1 (r) or fluorescent RNAscope staining for Notum (s). t, Notum positivity in Lgr5hi and Lgr5low clones within heterotypic tumours. n = 12 from 3 mice. u, Notum expression in Apc-mutant organoids. Three independent experiments per sample. Tukey’s multiple comparisons test. In h,m,n,q, n = 8 tumours from 3 mice. Paired two-tailed Wilcoxon test. Scale bars: 100 μm (f,g,il,o,p), 50 μm (r,s). Source Data
Extended Data Fig. 1
Extended Data Fig. 1. Confetti expression quantification and estimation of contribution of random collisions.
a, Schematic illustrating tissue preparation steps prior to confocal imaging. b, Confocal micrograph of Confetti-labelled crypts in sagittal (left) and cross (right) sections. Tissue was collected from an Apchet animal 10 days after tamoxifen induction. c, Box plot showing the frequency of Confetti fluorophore expression in different intestinal regions assessed. n = 41 intestinal segments from 7 mice. d, Box plot of frequency of individual Confetti fluorophores. Two-tailed t-test. e, Schematic illustrating the influence of patch size on the heterotypic fraction assessment. If an adenoma arises from two contiguous crypts with two different Confetti labels, the resulting tumour is identified as heterotypic. However, if it arises from a patch of similarly coloured crypts, it is identified as homotypic despite being polyclonal in origin. f, Box plot showing the simulation results for estimating patch sizes for individual fluorophores. 1000 simulations were performed for each fluorophore. g, Bar chart showing the number of Confetti colours in heterotypic tumours. h, Bar chart depicting the relative sizes of Confetti-labelled clones in heterotypic tumours. n = 13 tumours from 5 mice. i, Violin plot comparing the diameters of homotypic and heterotypic tumours in the small and large intestines. Based on 162 homotypic and 98 heterotypic tumours. Two-tailed t-test. j, Scatter plot of the heterotypic fraction against tumour density (number of tumours per 1000 crypts). Linear regression adjusted R2 −0.006. k, Representative heat map of the spatial tumour density for one intestinal segment. Tumours are marked by black dots, with the only heterotypic tumour in this segment labelled in white. l, Q-Q plot of heterotypic tumour spatial density against spatial density of all other tumours. Heterotypic tumours are not associated with a higher spatial density. m, Scatter plot showing the results of a Poisson model predicting the number of random tumour collisions for individual gut segments. The mean predicted number of collisions with the associated standard deviation is shown in red, with the green dot representing the observed number of heterotypic tumours for the segment. n = 37 samples from 10 mice. n,o, Examples of intestinal segments reconstructed following simulation of tumour initiation and growth. Random collision in o highlighted with black arrowhead. p, Q-Q plot of mean observed number of heterotypic tumours per imaged intestinal segment versus expected number of collisions in that segment based on simulation under conditions of random collision. Paired two-tailed t-test. q, Confocal micrograph of a segment of small intestine from a wildtype + ENU animal containing only one tumour. The inset shows that this tumour was heterotypic, consisting of at least two clones (uncoloured and yellow). Error bars denote s.d. (h, m). Details on the boxplots are provided in the Methods.
Extended Data Fig. 2
Extended Data Fig. 2. Characterisation of ethyl adduct clearance dynamics and ENU-mediated tumorigenesis.
a, H&E and IHC staining for β-catenin in a longitudinal section from a small intestinal tumour in the Apchet model in the absence of ENU. Scale bars 1000 μm. b, Schematic representation of ENU-mediated nucleotide alkylation. c, Decay curves for O-6-ethyl-guanine positivity following ENU administration. n = 3 animals per time point in each region. Error bars denote s.d. d, Box plot showing comparison of O-6-ethyl-guanine positivity at 48 h in the different intestinal regions. n = 25 half-crypts per region per animal. 3 animals used. Kruskal-Wallis test. e, Box plot showing the intestinal tumour burden by region in wildtype mice after ENU. n = 20 mice. f, H&E and β-catenin IHC in a small intestinal tumour in a wildtype + ENU mouse. Scale bars 300 μm. g, H&E- and β-catenin-stained swissroll sections from Apchet + ENU model. h, Representative H&E-stained sections showing low-grade (top) and high-grade dysplasia (bottom) in tumours in Apchet + ENU. i, Bar plot showing the distribution of tumours with low- and high-grade dysplasia across different regions in the Apchet + ENU model. n = 30 tumours across 3 mice. Error bars represent standard deviation around mean. j, Box plot showing distribution of tumour sizes between small intestine and colon. Based on 868 small intestinal and 585 colonic tumors in 5 mice. Two-tailed t-test. Scale bars: 25 μm (h), 300 um (f), 1000 um (a,g). Details on the boxplots are provided in the Methods.
Extended Data Fig. 3
Extended Data Fig. 3. Targeted amplicon sequencing of Apc.
a, Plot showing the overall sequencing coverage across all samples at various depths. n = 522 samples. b, Box plot showing the mean read depth between optically cleared and uncleared samples. n = 21 cleared tumours and 24 uncleared tumours. c, Schematic showing the pre-processing and mutation-calling pipeline. d, Schematic showing derivation of tumour spheroids used to confirm recombination of the transgenic Apc allele in both heterotypic and homotypic tumours. PCR for the floxed allele of Apc was performed on DNA derived from spheroids. Electrophoregram showing complete loss of the unrecombined band (209 bp) in monoclonal tumours and major-minor pairs. Positive controls shown on the right of the gel are from liver tissue of an Apchet mice (two bands) and Apcfl/fl animal without tamoxifen (one band). n = 6 monoclonal tumour spheroids and 10 major-minor pairs from 5 polyclonal tumours. e, Plot showing the number of amplicons covering each amino acid position in Apc. f, Schematic showing the influence of the clonal/subclonal structure on the resulting Apc VAF. Assuming a constant tumour fraction of 0.5, the sum of Apc VAFs is higher in situations of branching evolution (with more than one Apc mutation per tumour cell). g, h, Boxplot of Apc driver VAF (g) and Apc sequencing depth (h) for monoclonal tumours (one Apc mutation) and polyclonal tumours (two or more mutations). n = 154 monoclonal and 93 polyclonal tumours. Two-tailed Wilcoxon test in b, g and h. Details on the boxplots are provided in the Methods.
Extended Data Fig. 4
Extended Data Fig. 4. Explaining the multiple Apc hits.
a, Microdissection of heterotypic tumour with detected Apc nonsense mutations overlaid. b, Possible organisation of clones that would explain sequencing results obtained in a. c, Copy number analysis summary showing relative quiescence of copy number alterations in Apchet + ENU tumours. n = 6 tumours. d, Schematic showing experimental design for mutation phasing experiment. e, Lollipop plot showing Apc mutation location and allelotypes from microdissected minor clones. n = 11 minor clones with detected Apc mutations. f, Stacked bar chart showing the fraction of tumours across different intestinal regions with mutations in particular Apc domains. n = 59 tumours in SI10, 51 in SI20, 25 in SI30, 18 in SI40, 4 in colon, and 99 tumours with no recorded location information. g, Circos plot showing combinations of Apc domain mutations between the major and minor clone pairs within polyclonal tumours.
Extended Data Fig. 5
Extended Data Fig. 5. Clonal architecture influences transcriptional heterogeneity.
a, Bar chart comparing the number of differentially expressed genes between major and minor clones, monoclonal versus minor clones, and monoclonal versus major clones at an adjusted p-value < 0.05. b, Principal component (PC) analysis of major-minor clones showing relationship between PC2 and PC3. c,d, Bar chart of consensus molecular subtype (CMS) prediction for 20 monoclonal tumours (c) and, 20 major and minor clones (d) based on the MmCMS algorithm (option C). e, Sankey diagram showing pairing of major-minor clones according to their CMS status. f, Bar chart showing results of gene set enrichment analysis between major and minor clones using iCMS signatures. Values denote FDR from GSEA. g, Stacked bar chart showing results of pathway-derived subtyping (PDS) for major and minor clones. h, Volcano plot showing gene set enrichment scores for major-minor clone comparison using mouse-specific Wnt and Kras signalling signatures. i, Gene set enrichment scores for intestinal cell-type-specific signatures. j,k, Enrichment plots for Hallmark_Myc_Targets_v1 (j) and Hallmark_Kras_Signaling_Up (k) gene sets for major-minor clone comparison. l, Bar chart of CMS classification of 20 monoclonal tumours and 20 reconstructed polyclonal tumours (pseudo-bulk). Two-tailed z-test of equality of proportions. m, Sanger sequencing of clonal Pre-Armadillo (S96*), Armadillo (T619*) and MCR (F1378*) Apc knockouts with representative brightfield images showing the respective organoids. Scale bars: 50 μm. n, Schematic showing suggested mechanism through which different level of Wnt antagonism can contribute to polyclonal tumorigenesis. A poorly-transforming APC mutant intestinal stem cell (ISC) is unable to outcompete neighbouring wildtype ISCs due to inadequate Wnt antagonist secretion, unless in the presence of another APC mutant with supercompetitor behaviour.

References

    1. Fearon, E. R. & Vogelstein, B. A genetic model for colorectal tumorigenesis. Cell61, 759–767 (1990). - PubMed
    1. Barker, N. et al. Crypt stem cells as the cells-of-origin of intestinal cancer. Nature457, 608–611 (2009). - PubMed
    1. Flanagan, D. J. et al. NOTUM from Apc-mutant cells biases clonal competition to initiate cancer. Nature594, 430–435 (2021). - PMC - PubMed
    1. Van Neerven, S. M. et al. Apc-mutant cells act as supercompetitors in intestinal tumour initiation. Nature594, 436–441 (2021). - PubMed
    1. Yum, M. K. et al. Tracing oncogene-driven remodelling of the intestinal stem cell niche. Nature594, 442–447 (2021). - PMC - PubMed

MeSH terms

Substances