. 2024 Oct;634(8036):1178-1186.
doi: 10.1038/s41586-024-08087-4. Epub 2024 Oct 30.

Tumour evolution and microenvironment interactions in 2D and 3D space

Affiliations

Tumour evolution and microenvironment interactions in 2D and 3D space

Chia-Kuei Mo et al. Nature. 2024 Oct.

Abstract

To study the spatial interactions among cancer and non-cancer cells1, we here examined a cohort of 131 tumour sections from 78 cases across 6 cancer types by Visium spatial transcriptomics (ST). This was combined with 48 matched single-nucleus RNA sequencing samples and 22 matched co-detection by indexing (CODEX) samples. To describe tumour structures and habitats, we defined 'tumour microregions' as spatially distinct cancer cell clusters separated by stromal components. They varied in size and density among cancer types, with the largest microregions observed in metastatic samples. We further grouped microregions with shared genetic alterations into 'spatial subclones'. Thirty five tumour sections exhibited subclonal structures. Spatial subclones with distinct copy number variations and mutations displayed differential oncogenic activities. We identified increased metabolic activity at the centre and increased antigen presentation along the leading edges of microregions. We also observed variable T cell infiltrations within microregions and macrophages predominantly residing at tumour boundaries. We reconstructed 3D tumour structures by co-registering 48 serial ST sections from 16 samples, which provided insights into the spatial organization and heterogeneity of tumours. Additionally, using an unsupervised deep-learning algorithm and integrating ST and CODEX data, we identified both immune hot and cold neighbourhoods and enhanced immune exhaustion markers surrounding the 3D subclones. These findings contribute to the understanding of spatial tumour evolution through interactions with the local microenvironment in 2D and 3D space, providing valuable insights into tumour biology.


Conflict of interest statement

The authors declare no competing interests.

Figures

Fig. 1
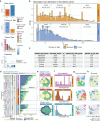
Fig. 1. Definition of tumour spatial microregions.
a, Sample, data type and workflow overview of the spatial subclone cohort of 131 Visium ST sections from 6 different cancer types with 22 and 48 respective matching CODEX and snRNA datasets. Data encompass 54 BRCA, 30 CRC, 23 PDAC, 12 RCC, 5 UCEC and 7 CHOL samples. Bottom, workflow for generating spatial tumour microregions, inferring spatial tumour subclones and conducting downstream analyses. Based on the distribution of tumour regions, we separated samples into spatially distinct and spatially diffuse cohorts. Analyses included tumour subclone evolution analysis, transcriptional similarity and layer-based TME interactions, tumour growth pattern construction, and multisection 3D neighbourhood reconstructions using custom code (Methods). b, Circular cohort overview plot at the tissue block level. The outcrop height of the outermost ring indicates the number of sections per tissue block. The top right insert shows a legend, with numbers in bubbles indicating counts of tissue blocks with a given number of serial sections. Successive rings indicate the cancer type annotated with section (tissue block) counts, tumour type, assay type and spatial cohort designation. c, Microregion distribution in the spatially distinct cohort at the section level coloured by cancer type (left), microregion size group (middle) and primary versus metastasis (right). Each circle indicates one microregion. The size of each circle represents the size of the microregion. d, Tumour versus stromal–immune spot fractions across cancer types for the entire cohort at the section level. Each point represents a sample, coloured by type: primary (n = 98 sections from 60 cases) or metastatic (n = 33 sections from 16 cases). The box plot’s centre line represents the median, with the lower and upper hinges indicating the first and third quartiles. Whiskers extend to the highest and lowest values within 1.5 times the interquartile range (IQR) from the hinges.
Fig. 2
Fig. 2. Genetic alteration reveals spatial clonal evolution.
a, Summary of workflow for identifying spatial subclones. b, Numbers of spatial clones detected in each section summarized by cancer type. Multiclonal sections (2 or 3 spatial subclones) are observed in BRCA, CRC, PDAC and RCC in this cohort (n = 125 sections from 74 cases with detected CNV). c, Spatial somatic mutation mapping per section detected in OCT ST data. WES-derived somatic mutations with significantly higher VAF in tumour regions than non-tumour regions (binomial test, FDR < 0.05) are shown (n = 60 OCT sections from 29 cases). The box plot’s centre line represents the median, with the lower and upper hinges indicating the first and third quartiles. Whiskers extend to the highest and lowest values within 1.5 times the IQR from the hinges. d,e, A colorectal cancer liver metastasis sample (HT260C1) with 12 tumour microregions demonstrates 2 tumour subclones, c1 and c2, separated spatially (d), with support from matching snRNA-seq data (e). f, Heatmap of estimated somatic CNVs per spot shows both shared and unique CNV events between the two spatial subclones. The B allele frequencies (BAFs) in each spatial subclone from the same genomic window are shown in the middle tracks and corresponding snRNA-inferred and WES-inferred CNV statuses using GATK4 (GA) and Hatchet2 (Hat) are shown in the bottom tracks. g, The predicted phylogenetic relationship of c1 and c2. h, The VAF for mutation LDHB c.921G>A is significantly higher in c2 than c1 (P = 6.58 × 10−6, two-sided proportion test). i, Subclonal mutation LDHB c.921G>A is uniquely detected in clone 2 in spatial transcriptomics, whereas LDHB expression is in both spatial subclones. j, Xenium in situ allele-specific probe density shows the WT allele of LDHB in both subclones and the mutant allele uniquely in the right subclone (c2). Scale bars, 2 mm. amp, amplification; del, deletion; LOH, loss of heterozygosity; NA, not applicable; UMAP, uniform manifold approximation and projection.
Fig. 3
Fig. 3. Immune and stromal infiltration inside spatial tumour microregions.
a, Analysis design focusing on the differential infiltration level between spatial subclones and the spatial location of such infiltration with respect to the tumour–TME border. b, Left, a primary BRCA sample HT397B1 shows higher macrophage and T cell levels in clone c3. Right, T cell markers (CD3 and CD8) and the non-T cell immune marker (HLA-DR) show higher intensity in the same regions from CODEX data. Scale bar, 1 mm. c, Fraction of macrophages, T cells and fibroblasts averaged across microregions in the following layers: T3 and above (T3+), T2, T1, E1, E2, and E3 and above (E3+), in 14 cases. d, Genes differentially enriched in the tumour boundary regions. Colour represents the log2(fold change) of gene expression between boundary regions and non-boundary regions, with non-differential comparisons in white (n = 25 spatially distinct cases). Each column represents a tumour block (multisection averaged) and tumour blocks from the same patient were grouped together (no gaps between columns). snRNA-seq-based cell-type specific expression is shown on the left, and the number of tumour blocks with significant enrichment is shown on the right (adjusted P < 0.05, Bonferroni correction). e, Boundary-enriched CCIs shared across samples (n = 25 spatially distinct cases) based on receiver (r)–sender (s) signals.
Fig. 4
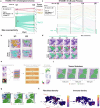
Fig. 4. 3D tumour volume reconstruction reveals diverse tumour growth patterns.
a, Tumour growth pattern diagram with two distinct tumour 3D volumes from four ST sections. The number of tumour volumes, connectivity, maximum connectivity and the number of loops are annotated to illustrate the concept of these geometric quantities. b, Number of tumour volumes (components) for each sample piece. c, Distribution of maximum connectivity of sample pieces. Each dot represents one tumour volume (n = 15 sections from 14 cases). The box plot’s centre line represents the median, with the lower and upper hinges indicating the first and third quartiles. Whiskers extend to the highest and lowest values within 1.5 times the IQR from the hinges. d, Sankey plot showing tumour microregion connections across sections, with 3D tumour volumes for tissue block HT268B1-Th1H3 (BRCA metastasis). The maximum connectivity of volume 2 (Vol. 2) is highlighted in red. Numbers next to each microregion indicate its connectivity. e, Microregion and 3D tumour volume spatial distributions on the ST sections for HT268B1-Th1H3.
Fig. 5
Fig. 5. Tumour–TME interactions in microregion boundary regions demonstrate heterogeneity.
a, For HT268B1, a BRCA metastasis sample, 3D neighbourhood volumes were generated with 4 Visium ST sections spanning 300 µm. Neighbourhoods 4 and 6 (NBHD 4 and NBHD 6, respectively), with the highest contact fraction with the subclone boundary, are displayed in 3D and as a 2D plane overlaid with subclone annotations. Scale bar, 1,000 µm. b, TME neighbourhoods displayed by contact fraction with the subclone boundary. c, DEGs were categorized into three groups: unique to neighbourhood 4, unique to neighbourhood 6, and shared. Spatial expressions of selected genes from each group are shown (bottom), with genes mentioned in the main text highlighted in bold. d, 3D reconstruction of tumour regions, where tumour surface mesh is coloured by the transcript density of TYMP1 and IGLC2 within a 50-µm radius of a given location. e, For HT397B1, a primary BRCA sample, integrated 3D neighbourhood volumes were generated with 6 H&E, 2 Visium ST and 4 CODEX sections spanning 155 µm. TME neighbourhoods described in f are shown as a 3D volume. f, Visualization of two ROIs in HT397B1, specifically the more immune-cold ROI 1 and immune-hot ROI 2. 2D slices of the 3D volume with quartile-highlighted neighbourhoods associated with each ROI are shown. Visium ST slides (U1 and U8) are shown as RCTD-imputed cell-type fractions. For CODEX slides (U2, U6, U9 and U12), DAPI, pan-cytokeratin (PanCK), SMA, HLA-DR, CD45 and CD8 are displayed. Scale bar, 500 µm. g, TME neighbourhoods are displayed as a fraction of contact with the border of each of the three subclones. Additionally, cell type fraction of CD8+ and CD8 T cells and fibroblasts are shown. Cell-type fractions were calculated from CODEX sections. The top and bottom quartiles of neighbourhoods with respect to contact fraction with subclone 3 are emphasized as dashed boxes. h, 3D epithelial (PanCK, red), immune (CD45, green) and stromal (SMA, white) surface volumes generated from CODEX sections. Scale bar, 500 µm.
Extended Data Fig. 1
Extended Data Fig. 1. Data Overview in Spatial Tumor Cohorts.
a, Overview of the data availability of the spatial tumor cohort with assay types, cancer types, and study cohort. b, 48 snRNA-seq from matching tumor blocks across 7 tissue types (left). Cell type distribution from multi-sample tissue types (right). c, 22 Co-detection by indexing (CODEX) multiplexed immunofluorescence imaging from matching tumor sections.
Extended Data Fig. 2
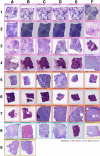
Extended Data Fig. 2. Histology of the Spatially Distinct Cohort.
Histology of the spatially distinct cohort colored by cancer type. Light pink BRCA (n = 23), light purple CHOL (n = 1), orange CRC (n slice = 18), light blue PDAC (n = 5), and light brown RCC (n = 3).
Extended Data Fig. 3
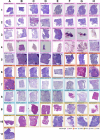
Extended Data Fig. 3. Histology of the Spatially Diffuse Cohort.
Histology of the spatially diffuse cohort colored by cancer types. Light pink BRCA (n = 31), light purple CHOL (n = 6), orange CRC (n = 12), light blue PDAC (n = 18), light brown RCC (n = 9), and pale orange UCEC (n = 5).
Extended Data Fig. 4
Extended Data Fig. 4. Microregion Distribution and Characteristics across Cohorts.
a, Sample count distribution for each cohort, primary vs. metastasis, cancer type, and count of section per sample. b, microregion size distribution between primary and metastasis samples (primary n = 98 sections from 60 cases; metastasis n = 33 sections from 16 cases). c, table with the count of microregions per size. d, Estimated microregion density per tissue block. The number of microregions, sections, and primary vs metastasis status, cancer of each block is indicated on the left. e, Example microregion sizes, f, size distribution histograms, and g, microregion and h, size groups visualized on Visium ST for HT268B1-Th1K3U1 (BRCA), HT260C1-Th1K1U1 (CRC), and HT270P1-H2U1 (PDAC).
Extended Data Fig. 5
Extended Data Fig. 5. Genomic Profiling of Spatial Subclones.
a, Spatial subclone genome-wide CNV profile similarity compared with matching WES-inferred CNV. b, Distribution of variants mapped to ST transcripts out of all somatic mutations detected from matching WES. Ref: reference allele; Var: variant allele. c, Somatic mutations mapped to HT260C1 are shared and unique to two spatial subclones. For each WES-derived mutation, VAFs between tumor and non-tumor regions (binomial test, left) and VAFs between two spatial subclones (proportion test, right) were compared. Mutations with FDR<0.05 (Benjamini & Hochberg correction) were annotated with * and ** for VAF and VAF differences, respectively. d, A breast cancer liver metastasis sample (HT268B1) showing 2 spatial subclones across 5 sections. e, In the heatmap (top), estimated somatic copy number variations (CNV) per spot show both shared and unique CNV events between the two spatial subclones. The b-allele frequencies (BAF) in each spatial subclone from the same genomic window are shown in the middle tracks, while the snRNA- and WES-inferred CNV status of the same genomic window is shown in the bottom tracks. f, The predicted phylogenetic relationship of the 2 tumor spatial subclones. g, UMAP of matching snRNA showing cell types and two tumor subclones. h, Somatic mutations mapped to HT268B1 are shared and unique to two spatial subclones. VAF calculations and their statistical analyses are the same as in panel c. i-j, Subclonal mutation EEF1A1.1324G>C is uniquely detected in Clone2 in spatial transcriptomics, while EEF1A1 expression is in both spatial subclones (p < 2.22 × 10−16, two-sided proportion test).
Extended Data Fig. 6
Extended Data Fig. 6. Spatial Expression Pattern of Tumor Microregions Driven by Genetic Alteration and Tumor Depth.
a, Tumor heterogeneity evaluated by 1- ROGUE scoring. Higher scores indicate higher heterogeneities. Each point represents one section and is colored by its respective cohort designation and number of subclones (n = 131 sections from 78 cases). The box plot’s center line represents the median, with the lower and upper hinges indicating the first and third quartiles. Whiskers extend to the highest and lowest values within 1.5 times the interquartile range (IQR) from the hinges. b, (Top panel) Distribution of pairwise Pearson correlations between pairs of microregions within the same section. Distribution is split by those from the same tumor subclone (green) and those from different subclones (orange). The number in the boxes and the solid line indicate the mean of each distribution. (Bottom panel) Number of tumor subclones, microregions, and sections per tissue block. c. Pairwise Pearson correlation of microregions based on the top 500 most variable genes in section U1 of HT260C1-Th1H3. The red box highlights the pairwise Pearson correlations of microregions within Clone 1. d, Pathway enrichment scores for Clone 1 (c1), and Clone 2 (c2), and TME, where bubble size represents corrected p-value (two-sided Wilcoxon rank-sum test FDR adjusted). e, Partial correlation coefficient rho (with tumor purity as a covariate) and -log10(p-value) between expression level and layer for all genes in the same section. Positive correlation indicates higher expression in the tumor center and negative correlation indicates higher expression in the tumor periphery. Genes are categorized using matching snRNA-seq as follows: purple for tumor-specific, orange for tumor-enriched, green for stromal-enriched, and light purple for not DEG. f, Center- and periphery-enriched genes with their correlation lines and spatial expression patterns (Pearson correlation). g, Top shared center- and periphery-enriched genes across cancer types (FDR<0.05 and rho>0.1 or rho<−0.1) (partial correlation with Benjamini-Hochberg procedure).
Extended Data Fig. 7
Extended Data Fig. 7. Transcriptional Variability and Pathway Enrichment in Tumor Subclones.
a, Pairwise Pearson correlation of the top 500 most variable genes in all 5 sections of Block HT268B1-Th1H3. Microregions with less than 10 spots were filtered out for this analysis. b, GSEA hallmark pathway enrichment analysis of tumor subclones compared to TME in the first section (U1) of HT268B1-Th1H3 (Two-sided Wilcoxon rank-sum test FDR adjusted). Average gene expression of upregulated genes in subclones from GSEA analysis and example spatial expression in c, d, Unfolded protein response, and e, f, MYC target v1 gene set in the first section (U1). g, h, G2M checkpoint, and i, j, MYC target v1 gene set. (i) Genes involved in DNA replication (light blue), cell cycle progression (light green), and translation initiation (light red) are highlighted. Average gene expression of upregulated genes in subclones from GSEA analysis and example spatial expression in c, e, g, i, (top panels) Module score, or average expression level of the program, calculated with Seurat AddModuleScore function (Method) using genes listed in each heatmap. The box plot’s center line represents the median, with the lower and upper hinges indicating the first and third quartiles. Whiskers extend to the highest and lowest values within 1.5 times the interquartile range (IQR) from the hinges.
Extended Data Fig. 8
Extended Data Fig. 8. Layer Depth and Gene Expression in Tumor Microregions.
a, Schema of tumor depth designation for tumor microregions quantified in the number of layers. Starting from the tumor/TME border, proximal layers of tumor spots are iteratively defined as T1, T2, T3, etc, and distal TME spots are similarly defined as E1, E2, E3, etc. b, Relationship between the depth (measured in a total number of layers) and size (measured in the number of spots) of each microregion. The dashed reference line represents the projected depth-size relationship of perfect circular regions. c, A primary breast cancer sample with two tumor microregions eligible for the layer correlation analysis. Spots excluded from the analysis due to their proximity to the physical edge of the tissue are labeled in gray. d, Partial correlation coefficient rho (with tumor purity as covariate) and -log10(p-value) between expression levels and layers for all genes. Positive correlation indicates higher expression in the tumor center and negative correlation indicates higher expression in the tumor periphery. e, Top center- and periphery-enriched genes with their correlation lines and spatial expression patterns (Pearson correlation). The box plot’s center line represents the median, with the lower and upper hinges indicating the first and third quartiles. Whiskers extend to the highest and lowest values within 1.5 times the interquartile range (IQR) from the hinges. Using Spatial Expression Deconvolution method to infer cell-type-specific expression yielded nearly identical results (Supplementary Fig. 9 and Methods).
Extended Data Fig. 9
Extended Data Fig. 9. Spatial Subclone Infiltration and Cell Composition Across Tumor Layers.
a, FDR statistics of comparing infiltration level by cell type between any two pairs of spatial subclones on the same sample. All significant FDR (<0.05) of the cell type from each sample was shown here indicating differential infiltration is observed (n = 16 spatially distinct cases with available matching deconvolution). b, Cell type composition of 6 regions defined by the following layers, T3 and above (T3+), T2, T1, E1, E2, and E3 and above (E3+), in 16 cases. c, Fraction of macrophage, T cell, fibroblast, and tumor in CODEX across 6 regions defined by the following layers, T3 and above, T2, T1, E1, E2, and E3 and above. Each data point represents one sample and data points from the same sample are connected. d, Spatial expression of boundary-enriched genes POSTN and IFI30. e, Example cell-cell interactions in MK pathway (MDK) in two tumor sections, with the arrow direction indicating signal direction and the arrow length indicating signal strength.
Extended Data Fig. 10
Extended Data Fig. 10. Spatial Mapping and 3D Reconstruction of Tumor Microregions.
a, Analogous Sankey plot and b, tumor volume spatial distributions on the ST sections for tissue block HT226C1-Th1. c, Analogous Sankey plot and. d, Histology, spatial tumor microregion, and distribution of tumor volume Vol.14 in HT206B1-S1. e, Overview of the spatial neighborhood identification workflow. Briefly, serial sections are registered and then used to train a vision transformer (ViT) autoencoder that produces image patch embeddings that are assigned to neighborhoods and assembled into 3-dimensional volumes. f, Visium ST for HT268B1 overlaid with copy number subclone annotations with distance in microns shown between sections. g, Spatial expression of additional DEGs corresponding to TME neighborhoods 4 (TYMP), 6 (CCL9), and shared (HLA-DRA) genes. h, 3D reconstruction of tumor regions for HT397B1. The tumor surface mesh is colored by the density of fibroblasts and immune cells within a 50-micron radius of a given location.

References

    1. Fu, T. et al. Spatial architecture of the immune microenvironment orchestrates tumor immunity and therapeutic response. J. Hematol. Oncol.14, 98 (2021). - PMC - PubMed
    1. Schmitt, M. W., Loeb, L. A. & Salk, J. J. The influence of subclonal resistance mutations on targeted cancer therapy. Nat. Rev. Clin. Oncol.13, 335–347 (2016). - PMC - PubMed
    1. Roper, N. et al. Clonal evolution and heterogeneity of osimertinib acquired resistance mechanisms in EGFR mutant lung cancer. Cell Rep. Med.1, 100007 (2020). - PMC - PubMed
    1. Trédan, O., Galmarini, C. M., Patel, K. & Tannock, I. F. Drug resistance and the solid tumor microenvironment. J. Natl Cancer Inst.99, 1441–1454 (2007). - PubMed
    1. Qu, Y. et al. Tumor microenvironment-driven non-cell-autonomous resistance to antineoplastic treatment. Mol. Cancer18, 69 (2019). - PMC - PubMed

MeSH terms

LinkOut - more resources