. 2024 Nov;635(8037):168-177.
doi: 10.1038/s41586-024-08100-w. Epub 2024 Oct 30.

Myocardial infarction augments sleep to limit cardiac inflammation and damage

Affiliations

Myocardial infarction augments sleep to limit cardiac inflammation and damage

Pacific Huynh et al. Nature. 2024 Nov.

Abstract

Sleep is integral to cardiovascular health1,2. Yet, the circuits that connect cardiovascular pathology and sleep are incompletely understood. It remains unclear whether cardiac injury influences sleep and whether sleep-mediated neural outputs contribute to heart healing and inflammation. Here we report that in humans and mice, monocytes are actively recruited to the brain after myocardial infarction (MI) to augment sleep, which suppresses sympathetic outflow to the heart, limiting inflammation and promoting healing. After MI, microglia rapidly recruit circulating monocytes to the brain's thalamic lateral posterior nucleus (LPN) via the choroid plexus, where they are reprogrammed to generate tumour necrosis factor (TNF). In the thalamic LPN, monocytic TNF engages Tnfrsf1a-expressing glutamatergic neurons to increase slow wave sleep pressure and abundance. Disrupting sleep after MI worsens cardiac function, decreases heart rate variability and causes spontaneous ventricular tachycardia. After MI, disrupting or curtailing sleep by manipulating glutamatergic TNF signalling in the thalamic LPN increases cardiac sympathetic input which signals through the β2-adrenergic receptor of macrophages to promote a chemotactic signature that increases monocyte influx. Poor sleep in the weeks following acute coronary syndrome increases susceptibility to secondary cardiovascular events and reduces the heart's functional recovery. In parallel, insufficient sleep in humans reprogrammes β2-adrenergic receptor-expressing monocytes towards a chemotactic phenotype, enhancing their migratory capacity. Collectively, our data uncover cardiogenic regulation of sleep after heart injury, which restricts cardiac sympathetic input, limiting inflammation and damage.


Conflict of interest statement

Competing interests

C.S.M. is a consultant for Granite Bio. J.F.d.S. and B.P.K. are inventors on patents or patent applications filed by Mass General Brigham (MGB) that describe genome engineering technologies. B.P.K. is a consultant for EcoR1 capital and Novartis Venture Fund, and is on the scientific advisory board of Acrigen Biosciences, Life Edit Therapeutics and Prime Medicine. B.P.K. has a financial interest in Prime Medicine, a company that is developing therapeutic CRISPR–Cas technologies for gene editing. The interests of B.P.K. were reviewed and are managed by Massachusetts General Hospital (MGH) and MGB in accordance with their conflict-of-interest policies. The other authors declare no competing interests.

Figures

Extended Data Fig. 1 |
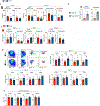
Extended Data Fig. 1 |. Sleep parameters in mice with cardiovascular diseases.
a, Quantification of sleep in WT mice that consumed a chow diet and atherosclerotic Apoe/ mice what consumed a HFD for 16 weeks. n = 8 WT mice; n = 5 Apoe/ HFD mice. b, Quantification of SWS in sham controls and TAC mice 7 days after surgery. n = 4 sham; n = 3 TAC. c, Quantification of REM sleep in MI and sham mice up to 21 days after infarct. n = 5 mice per group. d, Hypnogram of sleep and wake states in sham and MI mice. e, Quantification of locomotor activity up to 21 days after infarct (p < 0.0001, F = 64.71). n = 4 mice per group. f, Quantification of body temperature up to 21 days after infarct (p < 0.0001, F = 19.68). n = 4 mice per group. g, SWS analysis in naïve and sham mice. n = 5 sham mice; n = 4 naive mice. Data are mean ± s.e.m. Statistical analysis was done using two-way analysis of variance. Experiments were conducted in female mice. *p < 0.05, **p < 0.01, ***p < 0.001.
Extended Data Fig. 2 |
Extended Data Fig. 2 |. Analysis of microglia after myocardial infarction.
a, UMAP of cells identified in scRNAseq of mouse brain. n = 5 pooled mice per group. b, UMAP of microglia subclusters and their frequency in day 3 sham and MI mice. n = 5 pooled mice per group. c, Expression of chemokines and activation markers in non-microglial macrophages. n = 5 pooled mice per group. d, Analysis of microglia activation markers in naive mice injected with sham or day 1 MI plasma and sacrificed 4 h later. n = 4 sham plasma; n = 5 MI plasma. e, Measurement of IL-3, IL-6, and IL-1β in plasma one day after sham or MI. n = 3–8 f, Analysis of microglia and quantification of brain monocytes 1 day after stereotactic injection of IL-3, IL-6, IL-1β or PBS into the thalamus of naive mice. n = 5. g, Microglial responses to IL-3, IL-6, and IL-1β in an ex-vivo culture assay. n = 3. Data are mean ± s.e.m. Statistical analysis was done using one-way analysis of variance and two-tailed unpaired t-tests. Experiments were conducted in female mice. *p < 0.05, **p < 0.01, ***p < 0.001.
Extended Data Fig. 3 |
Extended Data Fig. 3 |. Brain immune parameters after myocardial infarction.
a, Flow cytometry quantification of brain macrophages, microglia, T cells and neutrophils in sham and MI mice 1, 3, and 7 days after infarct. Each data point represents an individual mouse. b, Histograms of tdTomato (TdT) positivity in blood monocytes and brain microglia in Ms4a3CreRosaTomato mice. c, Analysis of GFP+ cells in the heart, brain, lung, bone marrow, and liver 1 day after sham or infarct and adoptive transfer. n = 5 per group. d, Quantification of CCL2 protein in plasma and brain, and Ccl2 mRNA transcript in blood monocytes and brain tissue. n = 12 sham and n = 14 MI plasma; n = 4 per group for monocyte transcript; n = 5 sham and n = 4 MI brain CCL2 protein; n = 15 per group for brain transcript. e, Representative immunofluorescent images and quantification of CCR2+ monocytes in the cortex and hypothalamus. n = 7 per group. f, Representative image of secondary antibody only control on human liver sections. g, Analysis of FITC-dextran signal in the brain after peripheral delivery one day after MI or sham operation. scRNAseq analysis of brain endothelial and epithelial cells 3 days after sham or MI. n = 5 sham and n = 5 MI for FITC dextran; n = 5 pooled mice per group for scRNAseq. h, Microglial analysis in CCL2RFP mice one day after sham or MI. n = 4 mice per group. i, Representative images and quantification of thalamic microglia morphology by skeletal analysis. n = 3, each dot represents one cell. j, Analysis of blood monocyte and brain microglia CD123 (IL-3Ra), brain monocytes, and microglia CCL2 in Il3ra fl/fl and Cx3cr1CreERT2 Il3ra fl/fl mice injected with tamoxifen over 5 consecutive days and subjected to MI 3 weeks later. n = 4 per group except brain monocytes n = 7 Il3ra fl/fl and n = 8 Cx3cr1CreERT2Il3ra fl/fl mice. Data are mean ± s.e.m. Statistical analysis was done using two-tailed unpaired t-tests. Experiments were conducted in female mice. *p < 0.05, **p < 0.01, ***p < 0.001.
Extended Data Fig. 4 |
Extended Data Fig. 4 |. Analysis of brain monocytes, sleep regulation, and Tnfrsf1a targeting vector design.
a, Enumeration of blood Ly6Chi monocytes in MI and MI + CCR2 antagonist mice one day after injury. CCR2 antagonist was delivered to the brain via the cisterna magna. n = 5 mice per group. b, Quantification of brain Ly6Chi monocytes 1 day after MI and SWS analysis in WT sham, WT MI, and Ccr2/ MI mice. n = 4 for immune cell quantification; for sleep analysis n = 4 WT MI; n = 5 WT sham, n = 4 Ccr2/ MI. c, WT MI mice were injected with an anti-TCRβ antibody in the cisterna magna immediately after MI. Monocytes and SWS were quantified one day later. n = 4 control and n = 5 anti-TCRβ. d, Naive mice were injected with PBS or 30,000 monocytes sorted from the blood of a GFP mouse. Flow cytometry analysis of the transferred monocytes in the brain 2 h later. n = 5 mice per group. e, UMAP of brain monocytes and analysis of their frequencies in sham and MI mice. n = 5 pooled mice per group. f, Flow cytometry analysis of brain monocyte TNF. g, qPCR analysis of blood monocyte Tnf mRNA 1 day after sham or MI, n = 4 mice per group. scRNAseq analysis of blood monocytes 3 days after MI or sham. n = 5 pooled mice per group. h, Quantification of SWS in WT sham, WT MI, and Tnf / MI mice. n = 3 WT sham; n = 5 WT MI; n = 4 Tnf / MI. i, Schematic of the AAV genome encoding Cre expressed from the CaMKII promoter, along with an SpCas9 gRNA targeted to Tnfrsf1a and expressed from the human U6 promoter. j, Schematic for in vivo tissue specific knockdown or Tnfrsf1a, where AAV viral vectors encoding pCaMKII-Cre and the Tnfrsf1a-targeted SpCas9 gRNA are delivered via bilateral stereotactic injection into the thalamic LPN. Neuron-specific Cre recombination activates SpCas9 nuclease expression, leading to complexation of the nuclease with the Tnfrsf1a gRNA to target and knockout the Tnfrsf1a gene. k, Schematic of brain regions analysed by qPCR. Whole brain tissue was used. Expression of Tnfrsf1a in whole thalamic and cortex tissue. n = 5 WT + AAV2 MI mice; n = 4 Stop fl/fl-Cas9GFP + AAV2 MI mice. l, Enumeration of Ly6Chi monocytes in the brain of WT + AAV2 MI mice and Stop fl/fl- Cas9GFP + AAV2 MI mice 3 days after infarct. n = 3 WT + AAV2 MI mice; n = 4 Stop fl/fl-Cas9GFP + AAV2 MI mice. Data are mean ± s.e.m. Statistical analysis was done using two-way analysis of variance and two-tailed unpaired t-tests. Experiments were conducted in female mice. *p < 0.05, **p < 0.01, ***p < 0.001.
Extended Data Fig. 5 |
Extended Data Fig. 5 |. Extended analysis of sleep and cardiac function in MI and MI + SF mice.
a, Analysis of wake bouts (transitions from a sleep state to a wake state) in MI and MI + SF mice. n = 4 MI mice; n = 3 MI + SF mice. b, Evaluation of stroke volume (SV) and cardiac output (CO) by echocardiography in MI and MI + SF mice on days 3, 7, and 21 after infarct. n = 8 mice on day 3; n = 9 MI mice on day 7; n = 10 MI + SF mice on day 7; n = 8 MI mice on day 21; n = 10 MI + SF mice on day 21. c, Analysis of EF in sham mice, and mice that received a ‘medium’ or ‘large’ MI and exposed to SF or habitual sleep. Analysis was completed 3 days after sham or MI. n = 5 sham; n = 8 ‘medium’ MI ± SF; n = 5 ‘large’ MI ± SF. d, mRNA expression of Col3a1 and Col4a1 in infarcts 7 days after MI. n = 13 MI and n = 14 MI + SF. Data are mean ± s.e.m. Statistical analysis was done using one-way analysis of variance and two-tailed unpaired t-tests. Experiments were conducted in female mice. *p < 0.05, **p < 0.01, ***p < 0.001.
Extended Data Fig. 6 |
Extended Data Fig. 6 |. Inflammation and haematopoiesis in MI and MI + SF mice.
a, Flow cytometry enumeration of cardiac cells in MI and MI + SF mice. n = 7 MI; n = 8 MI + SF. b, Enumeration of monocytes and neutrophils in the infarcts of mice 3 days after receiving a ‘large’ MI and sleeping habitually or exposed to SF. n = 5 mice per group. c, Flow cytometry enumeration of blood leukocytes in MI and MI + SF mice. n = 11 MI on day 3; n = 12 MI + SF on day 3; n = 7 MI on day 7; n = 8 MI + SF on day 7; n = 7 MI day 21 monocytes; n = 9 MI + SF day 21 monocytes; n = 11 MI day 21 neutrophils; n = 12 MI + SF day 21 neutrophils. d, Flow cytometry gating and enumeration of progenitor cells in the BM of MI and MI + SF mice. Each data point represents an individual mouse. e, Analysis of BrdU incorporation into BM progenitor cells of MI and MI + SF mice 3 days after infarct. n = 5 per group. Data are mean ± s.e.m. Statistical analysis was done using two-tailed unpaired t-tests. Experiments were conducted in female mice. *p < 0.05, **p < 0.01, ***p < 0.001.
Extended Data Fig. 7 |
Extended Data Fig. 7 |. Assessment of cardiac and blood leukocytes and plasma corticosterone.
a, UMAP of heart leukocytes. n = 5 pooled mice per group. b, Subclustering of cardiac macrophages and cluster frequencies in MI and MI + SF mice. n = 5 pooled mice per group. c, UMAP depicting resident and recruited heart macrophages and defining genes. n = 5 pooled mice per group. d, DEGs in recruited macrophages. n = 5 pooled mice per group. e, UMAP of blood leukocytes and monocytes along with monocyte DEGs and top pathways of genes enriched in MI + SF versus MI mice. n = 5 pooled mice per group. f, Plasma corticosterone levels. Each data point represents an individual mouse. g, Leukocyte enumeration in the infarct. n = 9 MI + SF; n = 8 MI + SF + ADRβ2 blocker. h, Analysis of ejection fraction (EF) and infarct leukocyte abundance in WT mice transplanted with WT BM or Adrb2/ BM and exposed to MI and SF. Analysis was performed 3 days after infarct. n = 5 WTbmWT; n = 4 WTbmAdrb2/. Data are mean ± s.e.m. Statistical analysis was done using two-tailed unpaired t-tests. Experiments were conducted in female mice. *p < 0.05, **p < 0.01, ***p < 0.001.
Extended Data Fig. 8 |
Extended Data Fig. 8 |. Extended analysis of human sleep restriction study and schematic of hypothesis.
a, Actigraphy measured nightly total sleep time of study participants during the habitual sleep (HS) and sleep restriction (SR) phases of the randomized crossover trial. n = 4 participants per condition. b, UMAP of scRNAseq data of PBMCs. n = 4 participants per condition. c, Pathway analysis of cluster defining genes among monocyte clusters and the top 10 cluster defining genes in cluster 2. n = 4 participants per condition. d, UMAP of chemotactic genes enriched in monocyte cluster 3. n = 4 participants per condition. e, Schematic of hypothesis. (1) Myocardial infarction activates microglia via IL-1β and (2) enhances their production of myeloid chemoattractants including CCL2 and CCL5. (3) Circulating monocytes are actively recruited to the MI brain where they release TNF which signals to glutamatergic neurons in the thalamic LPN to (4) augment sleep. (5) Enhanced sleep after MI suppresses sympathetic input to the heart which limits signalling through ADRB2 and the generation of the myeloid chemoattractants CCL3 and CCL4 to (6) suppress monocyte recruitment to the infarcted heart thus limiting inflammation and promoting healing. Data are mean ± s.e.m. Statistical analysis was done using one-way analysis of variance and two-tailed paired t-tests. *p < 0.05, **p < 0.01, ***p < 0.001.
Fig. 1 |
Fig. 1 |. MI augments sleep.
a, Schematic of experimental design. Female C57BL/6 mice were implanted with telemetric devices that transmit EEG and EMG signals. At least one week later, mice were subjected to sham or MI surgery and EEG and EMG signals were recorded and sleep was analysed. b, Daily SWS abundance over 24-h periods after MI or sham operation. n = 7 days 0, 1 and 3; n = 6 day 7; n = 4 sham day 21; n = 5 MI day 21. c, Quantification of SWS (P < 0.0001, F = 22.16), SWS bout length (P < 0.0001, F = 12.79), awake time (P < 0.0001, F = 30.9), REM sleep (P < 0.0001, F = 15.44) and sleep–wake transition (P < 0.0001, F = 11.5) over 24-h periods after MI or sham operation. n = 7 sham day 3; n = 6 day 7; n = 4 day 21. d, Left, spectrogram, EMG signal and hypnogram for sham and MI mice over 1 h, 1 day after treatment (Act., active). Right, quantification of SWS delta power over 24-h periods and depictions of voltage (V2) at each frequency in sham and MI mice (P = 00041, F = 4.512). n = 7 sham day 3; n = 6 day 7; n = 4 day 21. Data are mean ± s.e.m.; two-way ANOVA. Experiments were conducted in female mice. *P < 0.05, **P < 0.01, ***P < 0.001.
Fig. 2 |
Fig. 2 |. Monocytes are recruited to the brain after MI to augment sleep.
a, Uniform manifold approximation and projection (UMAP) of microglia gene expression data on day 3 (left) and heat map of gene expression (right). n = 5 pooled mice. Max, maximum; min, minimum. b, UMAP (left) and quantification of activation and chemotaxis features (Trem2, Apoe, Itgax, Il3ra, Spp1, Ccl2, Ccl5, Ccl8, Ccl3, Ccl4, Cxcl2, Cxcl12 and Cxcr4; right) in microglia. n = 5 pooled mice. c, Gating strategy (left) and quantification of brain parenchymal Ly6Chi monocytes (right). A CD45 antibody was injected intravenously 5 min before euthanasia. n = 14 sham day 1; n = 15 MI day 1; n = 10 sham day 3; n = 9 MI day 3; n = 5 day 7. d, Brains of Ms4a3creRosaTomato mice were assessed one day after MI or sham. n = 5. e, Images of cleared brain one day after sham or MI probed for CCR2. n = 3, representative of one experiment. Scale bar, 2,000 μm. f, Image reconstruction focusing on the thalamus and third ventricle. n = 3, representative of one experiment. Scale bar, 100 μm. g, Left, CCR2+ monocytes in the brain one day after sham or MI. Right, quantification of monocytes per region of interest (ROI) in the ChP, thalamus and third ventricle. n = 7. Scale bar, 100 μm. h, Left, confocal imaging of the ChP with reconstruction of CCR2+ monocytes and the vasculature. Right, overlapped volume ratio analysis (0, no overlap of monocyte and vasculature; 1, complete overlap). Monocyte distance from vessel. Each data point represents one monocyte. n = 3. i, Imaging and CD68 and CCR2 quantification in the ChP and subthalamic nucleus of humans. n = 6 control subject; n = 4 patients with STEMI or NSTEMI. Scale bars, 100 μm. j, Quantification of brain Ly6Chi monocytes one day after MI (left) and sleep analysis after mice received an MI and were injected with vehicle or CCR2 antagonist in their CSF (right). n = 5. k, PBS or sorted monocytes were injected into the CSF and SWS was subsequently quantified (P = 0.0002, F = 27.21). n = 3 PBS; n = 5 sham; n = 4 MI. AUC, area under the curve. Data are mean ± s.e.m.; two-way ANOVA and two-tailed unpaired t-tests. Experiments were conducted in female mice except in d, which used an equal distribution of both sexes across groups.
Fig. 3 |
Fig. 3 |. Monocytic TNF engages Tnfrsf1a-expressing glutamatergic neurons in the thalamic LPN to augment sleep after MI.
a, UMAP plot of brain monocyte gene expression data three days after sham or MI. n = 5 pooled mice. b, Brain monocyte ranked log2-transformed fold change (FC) in gene expression (left) and UMAP plots of Tnf features (Tnfs10, Tnfaip6, Tnf, Tnfrsf17, Tnfrsf22 and Tnfsf9; right). n = 5 pooled mice. c, log2 expression of Tnf in brain monocytes. n = 5 pooled mice. d, UMAP of blood and brain monocytes, Tnf features and Tnf feature score. n = 5 pooled mice. e, SWS abundance in MI mice injected with anti-TNF into their CSF. n = 4. f, Blood monocytes from wild-type or Tnf −/− mice after MI were injected into the CSF of EEG and EMG-implanted wild-type mice and SWS was quantified. n = 4. g, Images of thalamic LPN sections probed for NeuN, TNFR1 and DAPI. h, UMAP of γ-aminobutyric acid-expressing (GABAergic) and glutamatergic neurons from sham and MI mice (left) and frequency of cells that express Tnfrsf1a (right). n = 5 pooled mice. i, UMAP of GABAergic and glutamatergic neurons (left) and expression and quantification of TNFRSF1A (right) in the grey matter of healthy humans. n = 6 individuals. j, SWS abundance in wild-type sham, wild-type (WT) MI and Tnfrsf1a−/− MI mice. n = 5. k, Schematic of strategy to knock out Tnfrsf1a in the mouse LPN. l, Top left, representative image showing induction of GFP in the LPN of AAV2-injected Stopfl/fl-Cas9GFP mice. Right, TNFR and NeuN immunofluorescence and quantification (bottom left) in the thalamic LPN. n = 5 wild-type and n = 4 Stopfl/fl-Cas9GFP mice. m, SWS in wild-type and Stopfl/fl-Cas9GFP mice injected with the AAV2 construct in the LPN after MI. n = 4 wild-type and n = 4 Stopfl/fl-Cas9GFP mice. Data are mean ± s.e.m.; two-way ANOVA and two-tailed unpaired t-tests. Experiments were conducted in female mice.
Fig. 4 |
Fig. 4 |. Sleep disruption worsens cardiac function and outcome after MI.
a, Experimental design. b, Survival of male mice. n = 12. c, Plasma troponin (left) and proBNP (right). Troponin: n = 11 MI day 3; n = 7 MI + SF day 3; n = 9 MI day 7; n = 5 MI + SF day 7; n = 10 MI day 21; n = 9 MI + SF day 21. ProBNP: n = 13 MI; n = 14 MI + SF. d, cMRI images at end-diastolic and end-systolic, 3 days after MI. e, Ejection fraction by echocardiography. n = 8 day 3; n = 9 MI day 7; n = 10 MI + SF day 7; n = 10 MI day 21; n = 15 MI + SF day 21. f, Total power, LF, HF and LF/HF ratio. Repeated measures 1 and 2 days after MI. n = 4 MI; n = 3 MI + SF. g, ECG traces two days after MI (left) and incidence (middle) and burden (right) of ventricular tachycardia (VT). n = 5 for incidence; n = 4 for burden. h, Collagen 3 (Col3) immunofluorescence (left) and quantification (right) in heart 21 days after MI. n = 6 MI; n = 4 MI + SF. Scale bar, 600 μm. i, Collagen 4 (Col4) immunofluorescence (left) and quantification (right) in the left ventricle wall 21 days after MI. n = 8 MI; n = 6 MI + SF. Scale bar, 100 μm. j, Schematic of study on effect of sleep quality in patients with ACS using B-PSQI during the four weeks after ACS. Patients were divided into good (B-PSQI < 5) or poor (B-PSQI ≥ 5) sleepers and followed for two years. k, MACE+ incidence during the two-year follow-up period. n = 51 good sleepers; n = 27 poor sleepers. l, Kaplan– Meier curve of MACE+-free survival and number at risk over two years following ACS. n = 51 good sleepers; n = 27 poor sleepers. m, Left ventricle ejection fraction (LV-EF) at baseline (within 7 days of ACS) and at a follow-up visit (149 ± 52 days after ACS). n = 14 good sleepers; n = 8 poor sleepers. Data are mean ± s.e.m.; Kapplan–Meier analysis and two-tailed unpaired t-tests. All mouse experiments, except in b, were conducted with female mice.
Fig. 5 |
Fig. 5 |. Sleep limits cardiac sympathetic input to curtail macrophage chemotactic programming and recruitment after MI.
a, Gating strategy (left) and cell counts (right) in infarcts after MI. n = 11 MI day 3; n = 12 MI + SF day 3; n = 8 MI day 7; n = 9 MI + SF day 7. b, UMAP analysis of resident and recruited macrophages in infarcts three days after MI. n = 5 pooled mice. c, Pathway analysis of top 50 differentially expressed genes from recruited macrophages in infarcts. n = 5 pooled mice. d, UMAP (left) and quantification (right) of Ccl3, Ccl4, Cxcl2 and Ccl2 expression in recruited macrophages. n = 5 pooled mice. e, CCL3 and CCL4 in infarcted homogenates. n = 10 MI; n = 12 MI + SF. f, Left, adoptive transfer of GFP+ bone marrow cells (BMCs) immediately after MI followed by randomization to MI or MI + SF groups. Right, quantification of GFP+ monocytes in the infarct 3 days after MI. n = 4. g, Images and quantification of DβH in the infarct 3 days after MI. n = 4 MI; n = 4 MI + SF. Scale bar, 50 μm. h, UMAP (left) and quantification (right) of Adrb1, Adrb2 and Adrb3 expression. n = 5 pooled mice. i, Ejection fraction (EF) and quantification of Ly6Chi monocytes in infarct three days after MI. Ejection fraction: n = 6 MI + SF, n = 7 MI + SF + ADRB2 blocker; monocytes: n = 9 MI + SF, n = 8 MI + SF + ADRB2 blocker. j, Schematic of the sleep restriction study depicting participants during habitual sleep (HS) and sleep restriction (SR) phases. k, UMAP of monocyte subclusters of groups shown in j. n = 4 participants per condition. l, Pathway analysis (left) in monocyte cluster 3 and quantification of indicated genes (right). m, Frequency of monocyte clusters. n, ADRB1, ADRB2 and ADRB3 expression in monocyte cluster 3. o, Transwell migration assay and quantification of migrated CD14+CD16 monocytes. n = 9 HS; n = 10 SR. p, Immunofluorescence (left) and quantification (right) of cardiac DβH in wild-type and Stop fl/fl-Cas9GFP mice injected with the Tnfrsf1a gRNA AAV2 construct in the thalamic LPN. Analysis was done three days after MI. n = 4 wild-type and n = 5 Stop fl/fl-Cas9GFP mice. Scale bar, 50 μm. q, Analysis of infarct Ly6Chi monocytes and macrophages three days after MI. n = 8. Data are mean ± s.e.m.; two-tailed unpaired and paired t-tests. Experiments were conducted with female mice.

Comment in

References

    1. St-Onge M-P et al. Sleep duration and quality: impact on lifestyle behaviors and cardiometabolic health: a scientific statement from the American Heart Association. Circulation 134, e367–e386 (2016). - PMC - PubMed
    1. McAlpine CS et al. Sleep modulates haematopoiesis and protects against atherosclerosis. Nature 566, 383–387 (2019). - PMC - PubMed
    1. Ziegler KA et al. Immune-mediated denervation of the pineal gland underlies sleep disturbance in cardiac disease. Science 381, 285–290 (2023). - PubMed
    1. Laugsand LE, Vatten LJ, Platou C & Janszky I Insomnia and the risk of acute myocardial infarction: a population study. Circulation 124, 2073–2081 (2011). - PubMed
    1. Daghlas I et al. Sleep duration and myocardial infarction. J. Am. Coll. Cardiol. 74, 1304–1314 (2019). - PMC - PubMed

MeSH terms

Substances