. 2024 Nov;635(8040):926-934.
doi: 10.1038/s41586-024-08128-y. Epub 2024 Oct 30.

Clonal dynamics after allogeneic haematopoietic cell transplantation

Affiliations

Clonal dynamics after allogeneic haematopoietic cell transplantation

Michael Spencer Chapman et al. Nature. 2024 Nov.

Abstract

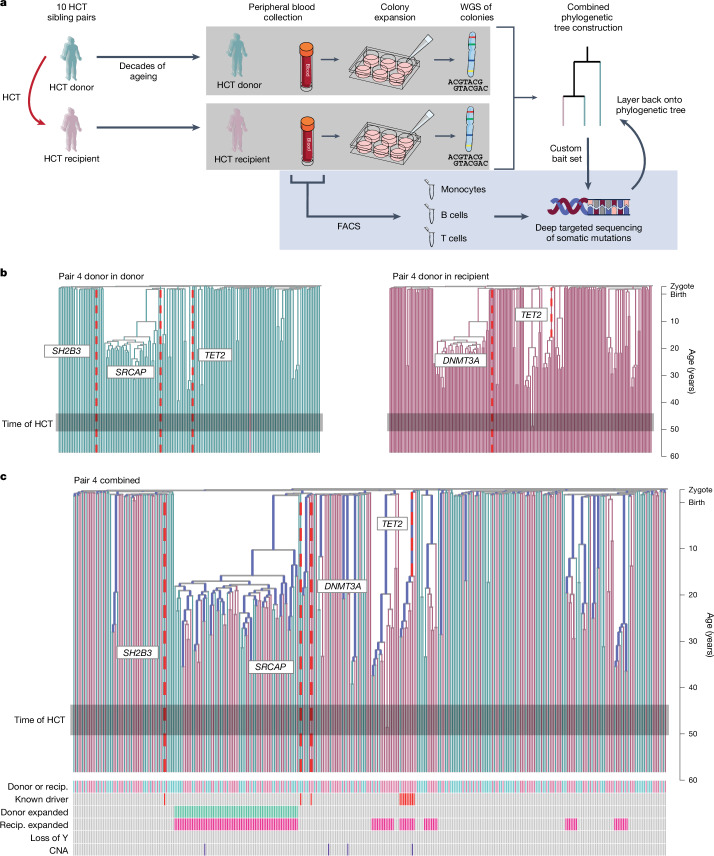
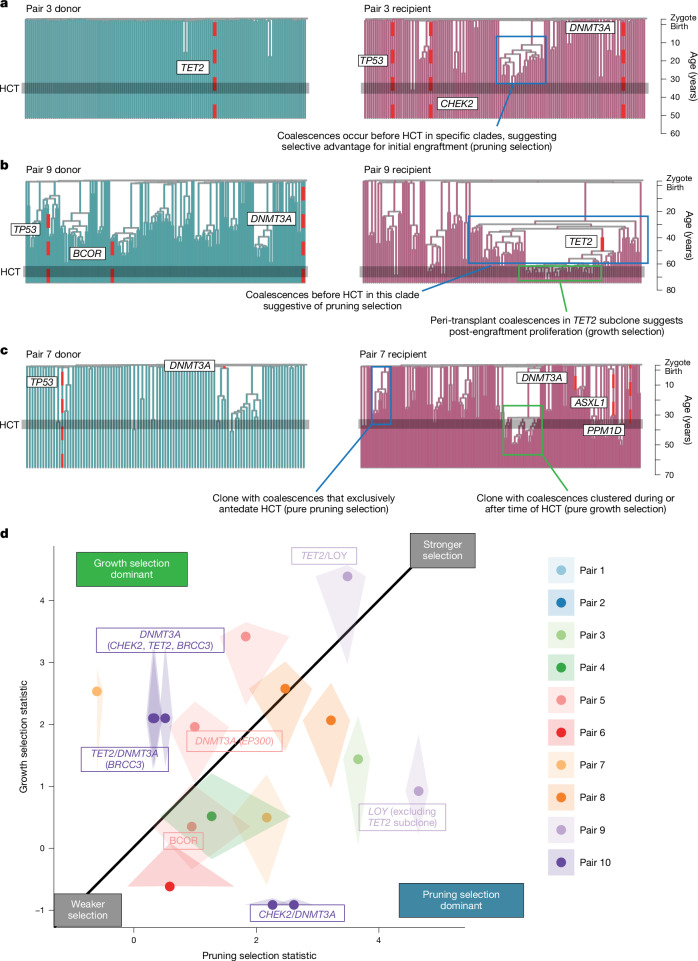
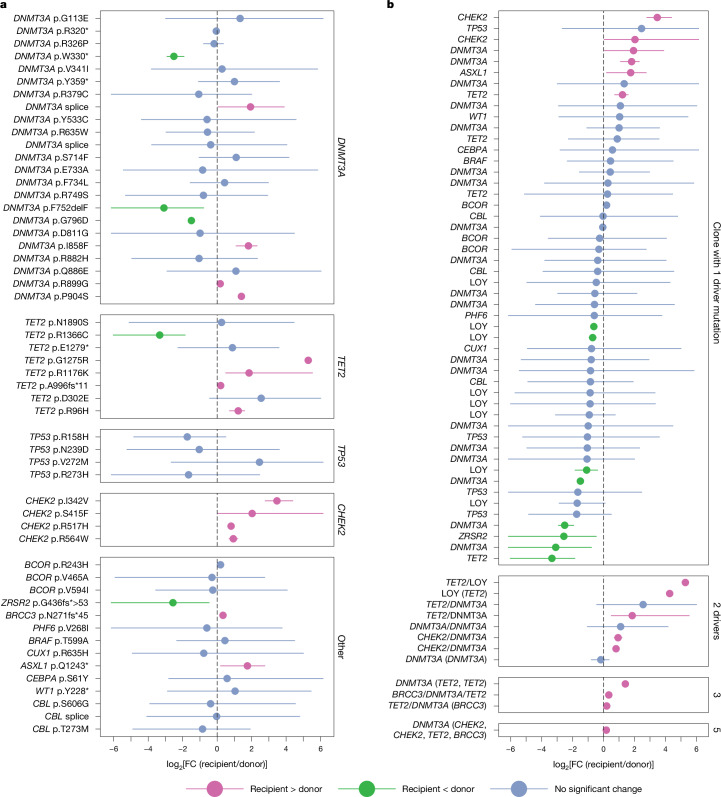
Allogeneic haematopoietic cell transplantation (HCT) replaces the stem cells responsible for blood production with those from a donor1,2. Here, to quantify dynamics of long-term stem cell engraftment, we sequenced genomes from 2,824 single-cell-derived haematopoietic colonies of ten donor-recipient pairs taken 9-31 years after HLA-matched sibling HCT3. With younger donors (18-47 years at transplant), 5,000-30,000 stem cells had engrafted and were still contributing to haematopoiesis at the time of sampling; estimates were tenfold lower with older donors (50-66 years). Engrafted cells made multilineage contributions to myeloid, B lymphoid and T lymphoid populations, although individual clones often showed biases towards one or other mature cell type. Recipients had lower clonal diversity than matched donors, equivalent to around 10-15 years of additional ageing, arising from up to 25-fold greater expansion of stem cell clones. A transplant-related population bottleneck could not explain these differences; instead, phylogenetic trees evinced two distinct modes of HCT-specific selection. In pruning selection, cell divisions underpinning recipient-enriched clonal expansions had occurred in the donor, preceding transplant-their selective advantage derived from preferential mobilization, collection, survival ex vivo or initial homing. In growth selection, cell divisions underpinning clonal expansion occurred in the recipient's marrow after engraftment, most pronounced in clones with multiple driver mutations. Uprooting stem cells from their native environment and transplanting them to foreign soil exaggerates selective pressures, distorting and accelerating the loss of clonal diversity compared to the unperturbed haematopoiesis of donors.


Conflict of interest statement

Competing interests: P.J.C. is a co-founder, stock holder and consultant for Quotient Therapeutics.

Figures

Fig. 1
Fig. 1. Experimental design and phylogeny building.
a, The study outline. Blood was sampled from ten sibling pairs who had been the donor and recipient of HCT years previously (range, 9–31 years). CD34+ cells were used to seed colonies in culture medium. Single colonies were analysed using WGS (298–430 per pair), and somatic mutations were used to reconstruct phylogenies. Mature cell subsets were sorted using fluorescence-activated cell sorting (FACS) and underwent custom targeted sequencing for the mutations found in WGS. b, Illustrative separate donor-in-donor/donor-in-recipient phylogenies built from samples from each individual from a pair. Branches with putative driver mutations (red dashed lines) are labelled with the variant. Time of HCT is indicated by the grey box. Branch lengths are scaled to chronological time. c, As in b, but combined into a single phylogeny. Branches were found in donor colonies only (cyan), recipient colonies only (pink) or both (black). The heat map shows additional colony-level information. Recip., recipient.
Fig. 2
Fig. 2. The numbers of long-term engrafting haematopoietic stem cells.
a, The posterior distributions for the number of long-term engrafting HS cells for each HCT, as estimated by approximate Bayesian computation (Methods). b, The relationship between the number of engrafting HS cells and the infused CD34+ cell dose per kg of recipient body weight. The points show the median posterior value, and error bars show the 95% posterior intervals, calculated from the 1% of n = 100,000 simulations of which the summary statistics best matched the observed data. CD34+ cell dose was not available for pairs 3, 6, 7 or 8. c, As in b, but illustrating the relationship between the numbers of engrafting HS cells and the age of the donor at the time of HCT. GCSF, granulocyte colony-stimulating factor; PB, peripheral blood.
Fig. 3
Fig. 3. Loss of clonal diversity in recipients of HCT.
a, The number and size of clades with a clonal fraction ≥2% of haematopoiesis. Plots are divided by pair, and by recipient (R) or donor (D). Clones are defined as a lineage originating from 100 mutations of molecular time (corresponding to the first few years after birth). Bars are coloured by whether the clone has a known driver (orange) or not (green). b, The fold change in phylogenetic diversity in recipients compared with their donors as measured by the mean pairwise distance (left) or mean nearest taxon distance (right). The line colour illustrates whether the recipient diversity is decreased (cyan) or increased (red). c, The posterior estimates of the phylogenetic age of recipients (orange) and donors (green) as estimated by ABC, compared with the true donor age at the time of sampling. The solid lines indicate the relationship between phylogenetic age and true age, split by donors (green) and recipients (orange), as estimated by linear mixed-effects regression. d, The size of clonal expansions in each mature cell compartment, as found in targeted sequencing. Includes clones contributing ≥1% clonal fraction in at least one compartment. Bar colours are arbitrary, but are consistent within pairs to enable comparisons between cell types and donors/recipients. Pairs 1 and 2 have no clones of ≥1% and are therefore not shown. e, The change in Shannon diversity index (SDI) (recipient SDI minus donor SDI) in each mature cell compartment. f, The relationship between SDI and donor age, divided by donors (green) and recipients (orange), and split by mature cell type. The solid lines indicate the line derived from the maximum likelihood of the linear relationship split by donor (green) and recipient (orange). The grey shaded areas show the 95% confidence interval of this relationship. The points show the individual estimates of SDI for the n = 10 donors and n = 10 recipients. Gran, granulocytes; mono, monocytes.
Fig. 4
Fig. 4. HCT-specific selection contributes to decreased recipient diversity.
a, Recipient and donor phylogenies for pair 3, for which there is a large clonal expansion within the recipient that is not evident in the donor. The increased coalescences are from before the time of HCT, consistent with an initial engraftment advantage for this clone (pruning selection). b, Recipient and donor phylogenies for pair 9, for which there is a large clonal expansion within the recipient that is not expanded in the donor. The clone component with loss of Y, but no mutation in TET2, has increased coalescences from before the time of HCT, consistent with an engraftment advantage. The component with both loss of Y and a TET2 mutation has both increased coalescences before and at the time of HCT, consistent with an engraftment and post-engraftment proliferation advantage (pruning and growth selection). c, Recipient and donor phylogenies for pair 7, for which there are large clonal expansions within the recipient that are not evident in the donor that show either pure pruning selection or pure growth selection. d, The pruning and growth selection statistics for each clone that has preferentially expanded in the recipient, illustrating the differences between clones. Shaded areas are estimates of the 95% confidence intervals of these values estimated by node bootstrapping. Clones with driver mutations are labelled with the mutated gene.
Fig. 5
Fig. 5. Clones with driver mutations can have differing dynamics in donors and recipients.
a, The log2-transformed fold change in putative driver variant allele fractions (VAFs) in recipients compared with donors. The circles denote point estimates, and are coloured by whether fractions are lower (orange) or higher (green) in recipients, or show no significant difference (blue). The error bars show the 95% confidence interval of the log2-transformed fold change. Variants are grouped by the affected gene. b, The fold change in putative driver variant VAFs as in a, but now including loss of Y events, and showing the clonal hierarchy. Clones are grouped by the total number of driver variants within the clone. Where mutations occur on the background of another driver mutation, genes are shown in the format GENE1/GENE2, indicating that all cells in the clone have driver mutations in both genes. Where the mutant clone contains a major subclone with an additional driver mutation, these are shown in the format GENE1 (GENE2), indicating that some, but not all cells in the clone have driver mutations in both genes. LOY, loss of the Y chromosome.
Extended Data Fig. 1
Extended Data Fig. 1. Separate donor-in-donor and donor-in-recipient phylogenies.
Phylogenies of HSPCs collected from donors (cyan, left side) and recipient (pink, right side). Phylogenies have been made ultrametric and scaled to real time (Methods). Grey shaded boxes indicate the approximate time of HCT. Branches with driver mutations are highlighted (red dashed lines).
Extended Data Fig. 2
Extended Data Fig. 2. Combined donor-in-donor and donor-in-recipient phylogenies.
Phylogenies have been made ultrametric and scaled to real time (Methods). Grey shaded boxes indicate the approximate time of HCT. Branches with driver mutations are shown (red dashed lines) labelled with the mutant gene. Branches were found in donor HSPCs only (cyan), recipient HSPCs only (pink) or both (black). Heatmaps show additional colony-level information. HCT, haematopoietic cell transplantation; LOY, loss of Y chromosome; CNA, Copy number alteration; Recip, Recipient, Zyg., Zygote.
Extended Data Fig. 3
Extended Data Fig. 3. Mutational signatures.
a, 96-profile mutational signatures of mutational processes active in HSCs/HSPCs, as extracted using a hierarchical dirichlet process (Methods). Interpretation of each signature, by comparison with COSMIC signatures, is shown to the right of each profile. b, Stacked barplot showing the absolute contribution of each signature to each sample. Each column is a single sample, with samples grouped by pair. Tiles below the columns indicate whether the sample is from the donor (green) or recipient (orange). Three outlier samples in the Pair 10 recipient had extremely high burdens and these have been attenuated to aid visualization. c, Box-and-whisker plot showing the per sample burden of N3 mutations (platinum-associated signature), divided by pair and donor/recipient origin. Lines show the median values, boxes show the interquartile range, and whiskers the range for the n = 10 independent donor-recipient pairs. d, Bar plot showing the percentage of HSPCs from each donor (green) and recipient (orange) that are “positive” for the SBS2 signature (APOBEC-associated, ≥10 mutations). e, Jittered dot plot showing the absolute burden of SBS2 mutations in positive samples. Points are coloured by pair, and are either triangles (recipient origin) or circles (donor origin). HSPC, haematopoietic stem or progenitor cell; SBS, single base substitution.
Extended Data Fig. 4
Extended Data Fig. 4. Properties of APOBEC mutations.
a, Estimated timings of branches containing >10 APOBEC mutations. Using the estimated clock-like mutation rate for HSPCs, branch start- and end-points in molecular time were converted to estimated chronological age and plotted as a vertical bar. Estimated timing of transplant for each recipient is plotted as a horizontal dashed line. All bars end above this age-of-transplant line, and many begin above it, suggesting that APOBEC mutations occur at the time of or subsequent to the transplant. b, P values of a generalized linear mixed effects model to identify factors predicting presence of APOBEC mutations in a given colony, showing that the only significant variable was the enrichment of the signature in recipient versus donor colonies. c, Genomic features significantly associated with distribution of APOBEC mutations in recipient colonies. Associations between different genomic properties (rows) and all mutations (left column), APOBEC mutations (middle column) and APOBEC mutations normalized by the density of non-APOBEC mutations (right column). Each density curve represents the quantile distribution of the genomic property values at observed positions of mutations compared to random genome positions. Shown are the genomic properties that are statistically significant using generalized additive models after multiple hypothesis test correction (q < 0.1).
Extended Data Fig. 5
Extended Data Fig. 5. Mutation burdens and driver mutations.
a, Dot plot showing the corrected single nucleotide variant mutation burden of HSPCs from donors against donor age. Solid black line shows the results of a linear regression of this relationship, with the grey shaded area the 95% confidence interval. b, Dot plot showing the number of additional mutations in recipient colonies, after bioinformatically removing burdens associated with the APOBEC (N4) and platinum chemotherapy (N3) signatures that are sporadic. Where there are multiple HSPCs from a single expansion, only one colony per individual is used for this inference, as the burdens are not independent. Circles denote the point estimate and error bars indicate the 95% confidence intervals calculated from n = 2,824 independent colonies. c, Stacked bar plot showing the total numbers of independent driver mutations detected per gene, coloured by mutation consequence. d, Heatmap showing the number of independent driver mutations per gene in each pair. The far right column shows the total number of drivers in each individual across genes. e, Bar plot showing the possible molecular times of acquisition of each driver mutation. Bars are grouped and coloured by gene. SNV, single nucleotide variant; HCT, haematopoietic cell transplantation.
Extended Data Fig. 6
Extended Data Fig. 6. Bayesian inference for the number of engrafting haematopoietic stem cells during HCT.
Overview of the modelling and inference approaches used to estimate the numbers of long-term engrafting HSCs for each transplant pair. The modelling approach is described in detail in the Methods section.
Extended Data Fig. 7
Extended Data Fig. 7. Comparisons of expansion clonal fractions across cell types and individuals.
a, Clonal fractions inferred from the phylogeny compared to targeted sequencing of monocytes. Plot shows only clones that are at least 5% clonal fraction in either donor or recipient. The x-axis shows clonal fractions inferred from the proportion of colonies from that individual coming from that clone, with circles denoting the point estimate and error bars giving the 95% confidence interval (exact binomial test). The y-axis shows clonal fractions inferred from the deep targeted sequencing of monocyte fractions. Confidence intervals for the targeted sequencing data are generally narrow and therefore not shown. b,c, Bar plots showing the log2 fold change of expanded clone sizes within monocytes (b) or B-cells (c) comparing recipients to their donors. Bars are coloured red if the clone is larger in the recipient, or blue if larger in the donor.
Extended Data Fig. 8
Extended Data Fig. 8. Lower output of detected clones in the lymphoid compartments.
a,b, Dot plot showing the clonal contribution of different clones to the myeloid compartment as compared to the B-lymphoid compartment (a) or T-lymphoid compartment (b) at the time of sampling, split by donor and recipient. c, Line plot showing the sum of T-cell clonal fractions across the branches of the phylogenetic tree at different points in molecular time. The earliest time point shows the sum of clonal contributions of the first two blastomeres of the embryo. Solid line shows the median posterior values, shaded areas show the 95% posterior intervals. d, Heatmap showing the soft cosine similarities of early embryonic mutations across mature cell types in the 10 donor-recipient pairs.
Extended Data Fig. 9
Extended Data Fig. 9. Simulations incorporating HCT-specific selection are necessary to recapitulate real HCT phylogenies.
a, Dot plot showing selected summary statistics for the samples from the posterior distribution (grey) compared to the data (red), when using a simulation framework that does not incorporate engraftment-specific selection. These summary statistics reflect the degree to which recipient phylogenies have increased pre-HCT coalescences (recipient:donor ratio of pre- HCT time point coalescences, y-axis), while maintaining overall diversity (number of singletons, x-axis). b, As in a, but now using a simulation framework that allows for engraftment-specific selection (Pruning selection). c, As in a, but with different summary statistics, now reflecting the degree to which peri-HCT coalescences are concentrated in a single clade (maximum number of peri-HCT coalescences in single clade, y-axis), while maintaining overall diversity (number of singletons, x-axis). d, Quantile-quantile (QQ) plots showing distributions of posterior p values for the three ABC models, calculated using Bayesian posterior p value checks with the rejection sampling method. In each panel, the posterior p values are ranked (x axis; quantile) and the posterior p value is shown (y axis), coloured by donor-recipient pair. The blue lines represent x = y and the grey lines represent y = 0.05. Left panel, model of age-related selection combined with a bottleneck for transplant into recipient; middle panel, model of age-related selection, bottleneck plus pruning selection; right panel, model of age-related selection, bottleneck plus growth selection.
Extended Data Fig. 10
Extended Data Fig. 10. Minimum VAF in either donor or recipient myeloid cells.
a, Combined phylogeny for Pair_9, with mutations coloured by the lower value of the estimated posterior median VAF in granulocytes from either the donor or the recipient. This means any coloured branch is detectable in both donor and recipient, including several of the clonal expansions. Trees have been made ultrametric and scaled to chronological age. Shaded grey box indicates approximate time of HCT. b, As in a, but for Pair_7. c, As in a, but for Pair_5. d, Estimated dN/dS ratios combined across pairs, split by mutations found in donors or recipients and mutation type, corrected for expected freuqncy based on background mutation rates, sequence context and chromatin state. A dN/dS ratio of >1.0 implies more positive than negative selection; a ratio <1.0 implies more negative than positive selection. Circles denote point estimates and bars denote 95% confidence intervals estimated across mutations called from n = 10 donor-recipient pairs.
Extended Data Fig. 11
Extended Data Fig. 11. Relative clonal fraction of driver events in different mature cell compartments.
a, Dot plot showing the log2 fold change of putative driver event VAFs in recipients compared to donors in monocytes (left panel), B-cells (middle panel) and T-cells (right panel). Points are coloured by whether fractions are lower (orange) or higher (green) in recipients, or show no significant difference (blue). Circles show the point estimate and error bars show the 95% confidence interval of the log2 fold change. Variants are grouped by the affected gene or chromosome. Where mutations occur on the background of another driver mutation, genes are shown in the format GENE1/ GENE2, indicating that all cells in the clone have driver mutations in both genes. Where the mutant clone contains a major subclone with an additional driver mutation, these are shown in the format GENE1 (GENE2), indicating that some, but not all cells in the clone have driver mutations in both genes. LOY, loss of the Y chromosome.

References

    1. Sevilla, J., Fernández-Plaza, S., Diaz, M. A. & Madero, L. Hematopoietic transplantation for bone marrow failure syndromes and thalassemia. Bone Marrow Transplant35, S17–S21 (2005). - PubMed
    1. Dickinson, A. M. et al. Graft-versus-leukemia effect following hematopoietic stem cell transplantation for leukemia. Front. Immunol.8, 496 (2017). - PMC - PubMed
    1. Boettcher, S. et al. Clonal hematopoiesis in donors and long-term survivors of related allogeneic hematopoietic stem cell transplantation. Blood135, 1548–1559 (2020). - PubMed
    1. Atsuta, Y. et al. Late mortality and causes of death among long-term survivors after allogeneic stem cell transplantation. Biol. Blood Marrow Transplant22, 1702–1709 (2016). - PubMed
    1. Wingard, J. R. et al. Long-term survival and late deaths after allogeneic hematopoietic cell transplantation. J. Clin. Oncol.29, 2230–2239 (2011). - PMC - PubMed

MeSH terms