. 2024 Dec;636(8041):206-214.
doi: 10.1038/s41586-024-08131-3. Epub 2024 Oct 30.

Rhythmic IL-17 production by γδ T cells maintains adipose de novo lipogenesis

Affiliations

Rhythmic IL-17 production by γδ T cells maintains adipose de novo lipogenesis

Aaron Douglas et al. Nature. 2024 Dec.

Abstract

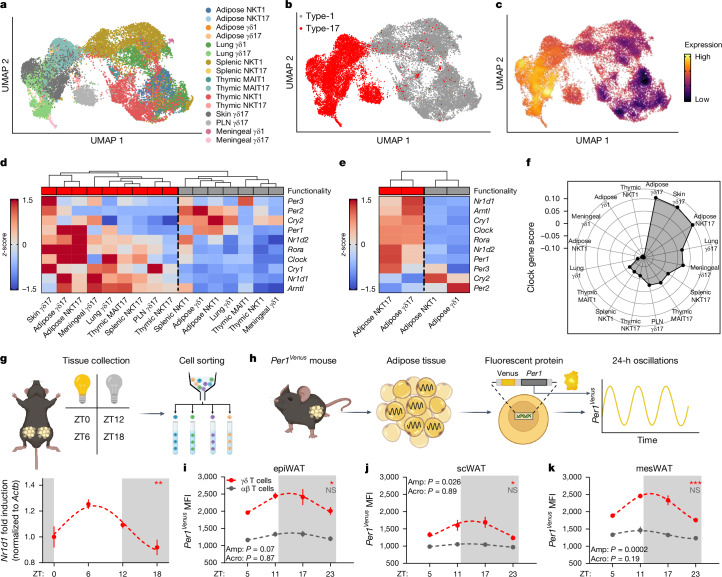
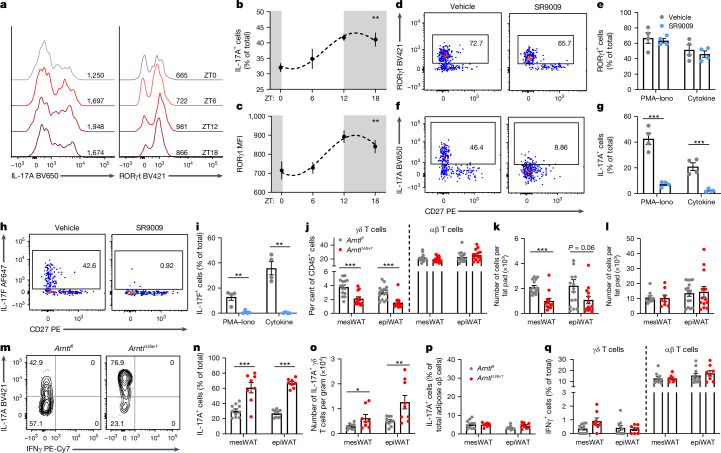
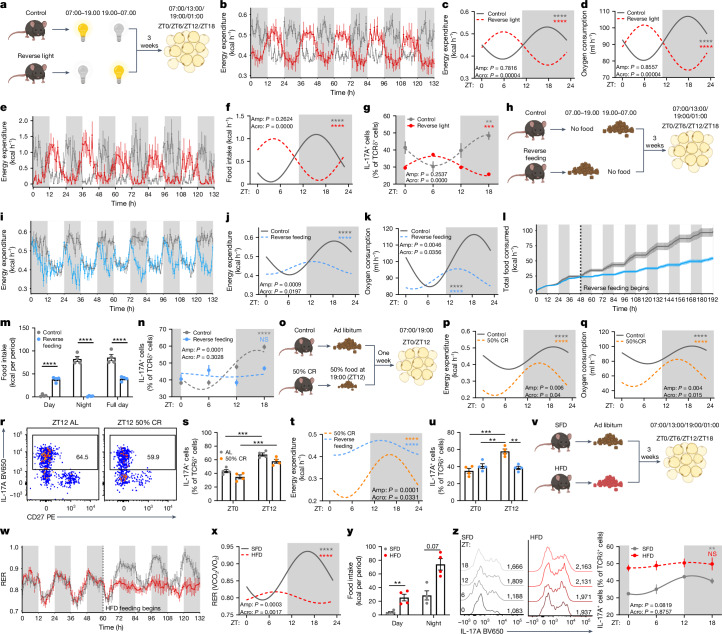
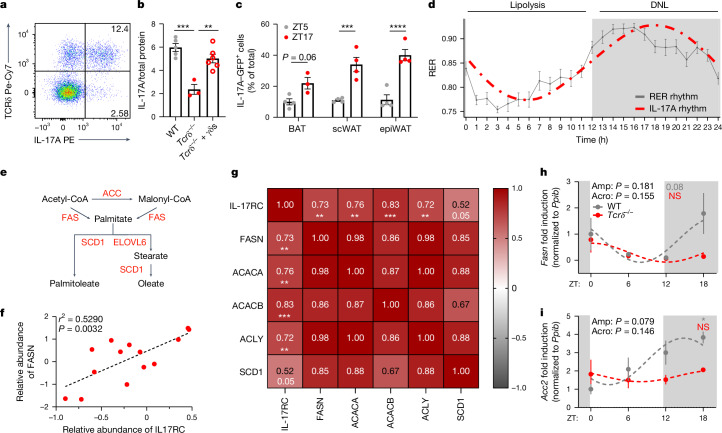
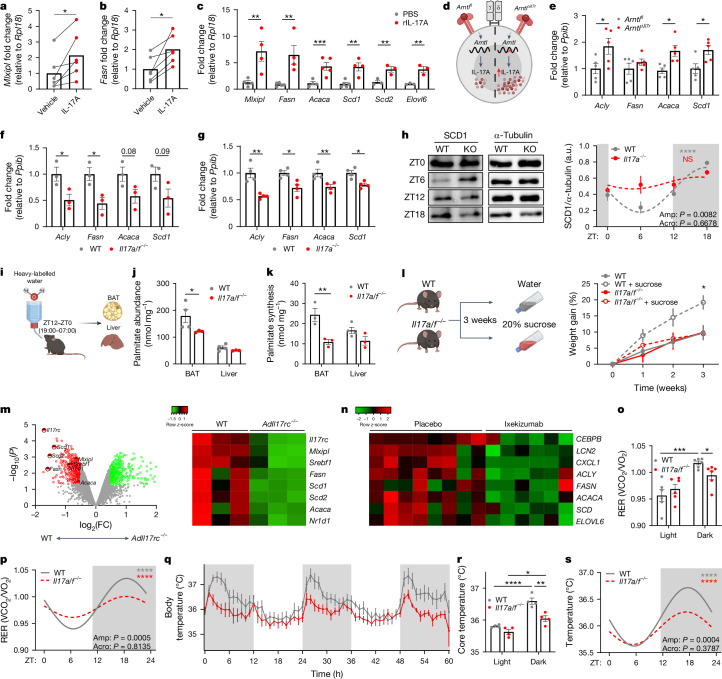
The circadian rhythm of the immune system helps to protect against pathogens1-3; however, the role of circadian rhythms in immune homeostasis is less well understood. Innate T cells are tissue-resident lymphocytes with key roles in tissue homeostasis4-7. Here we use single-cell RNA sequencing, a molecular-clock reporter and genetic manipulations to show that innate IL-17-producing T cells-including γδ T cells, invariant natural killer T cells and mucosal-associated invariant T cells-are enriched for molecular-clock genes compared with their IFNγ-producing counterparts. We reveal that IL-17-producing γδ (γδ17) T cells, in particular, rely on the molecular clock to maintain adipose tissue homeostasis, and exhibit a robust circadian rhythm for RORγt and IL-17A across adipose depots, which peaks at night. In mice, loss of the molecular clock in the CD45 compartment (Bmal1∆Vav1) affects the production of IL-17 by adipose γδ17 T cells, but not cytokine production by αβ or IFNγ-producing γδ (γδIFNγ) T cells. Circadian IL-17 is essential for de novo lipogenesis in adipose tissue, and mice with an adipocyte-specific deficiency in IL-17 receptor C (IL-17RC) have defects in de novo lipogenesis. Whole-body metabolic analysis in vivo shows that Il17a-/-Il17f-/- mice (which lack expression of IL-17A and IL-17F) have defects in their circadian rhythm for de novo lipogenesis, which results in disruptions to their whole-body metabolic rhythm and core-body-temperature rhythm. This study identifies a crucial role for IL-17 in whole-body metabolic homeostasis and shows that de novo lipogenesis is a major target of IL-17.


Conflict of interest statement

Competing interests: The authors declare no competing interests.

Figures

Fig. 1
Fig. 1. Innate IL-17+ T cells are enriched for molecular-clock genes.
a, UMAP of mouse innate T cells across several organs, reanalysed from GSE142845, GSE141895, E-MTAB-7704, E-MTAB-8732, GSE123400 and GSE147262 (all publicly available scRNA-seq datasets). PLN, peripheral lymph node. b, UMAP of mouse innate T cells subclustered on the basis of functionality (type 1 (TH1-like) or type 17 (TH17-like)). c, Density plot of the cumulative expression of all molecular-clock genes across innate T cell subsets, designated the molecular-clock score. d, Heat map of the averaged gene expression of molecular-clock genes with hierarchal clustering of data from a. e, Heat map of the averaged gene expression of molecular-clock genes from adipose tissue innate lymphocytes with hierarchal clustering of data generated in this laboratory. f, Spider plot showing that adipose γδ17 T cells have the highest cumulative expression of molecular-clock genes. g, Top, diagram of the isolation and PCR analysis of adipose γδ T cells. Bottom, relative expression of Rev-erba (also known as Nr1d1) in epiWAT γδ T cells across 24 h. h, Diagram of Per1Venus oscillations in cells isolated from adipose tissue. ik, Circadian time plots of Per1Venus expression by αβ (grey) and γδ (red) T cells across 24 h in epiWAT (i), scWAT (j) and mesWAT (k). MFI, mean fluorescence intensity. g,ik, White and grey panels represent light and dark periods, respectively. ik, Data are representative of two independent experiments. g,ik, Data are mean ± s.e.m., n = 4–5 mice per group. g,ik, Significance was calculated using cosinor analysis, with cosine fitted curves; amplitude (amp) and acrophase (acro) were extracted from the cosinor model. NS, not significant, *P < 0.05, **P < 0.01, ***P < 0.001. Source Data
Fig. 2
Fig. 2. IL-17A expression by adipose γδ T cells is regulated by the molecular clock.
a, IL-17A and RORγt histograms from adipose (epiWAT) γδ T cells across 24 h. b, Percentage of IL-17A+ cells. c, RORγt MFI. d, RORγt flow plots from adipose (epiWAT) γδ T cells stimulated with PMA–ionomycin and 40 µM SR9009. e, Percentage of RORγt+ cells. f, IL-17A flow plots from adipose (epiWAT) γδ T cells stimulated with PMA–ionomycin and 40 µM SR9009. g, Percentage of IL-17A+ cells. h, IL-17F flow plots from adipose (epiWAT) γδ T cells stimulated with IL-1β, IL-23 and 40 µM SR9009. i, Percentage of IL-17F+ cells. j, Percentage of γδ T cells and αβ T cells among total lymphocytes in Arntlfl (grey) and ArntlVav1 (red) mice. k,l, Absolute cell numbers of γδ (k) and αβ (l) T cells in adipose tissue of Arntlfl (grey) and ArntlVav1 (red) mice. m, IL-17A flow plots from Arntlfl and ArntlVav1 adipose γδ T cells. n, Percentage of IL-17A+ cells. o, IL-17A+ γδ T cell numbers per gram of adipose tissue in Arntlfl (grey) and ArntlVav1 (red) mice. p, IL-17A+ cells as a percentage of the total adipose αβ T cells. q, IFNγ expression by adipose αβ and γδ T cells from Arntlfl (grey) and ArntlVav1 (red) mice. b,c, White and grey panels represent light and dark periods, respectively. Data are representative of three (ac,jq) or two (di) independent experiments. b,c,e,g,il,nq, Data are mean ± s.e.m., n = 4–15 mice per group. b,c, Significance was calculated using cosinor analysis, with cosine fitted curves, e,g,il,nq, Two-tailed unpaired student’s t-test. *P < 0.05, **P < 0.01, ***P < 0.001. Source Data
Fig. 3
Fig. 3. Light entrains whole-body metabolism and IL-17A production by adipose γδ T cells.
a, Reverse-light-cycle experimental set-up. b, Energy expenditure of regular (grey) and inverted-light-cycle (red) mice after three weeks. c,d, Circadian plots of energy expenditure (c) and oxygen consumption (d). e, Food consumption of regular (grey) and inverted-light-cycle (red) mice after three weeks. f, Circadian plot of food consumption. g, Percentage of IL-17A+ cells among adipose γδ T cells of normal (grey) and reverse-light-cycle (red) mice over 24 h. h, Reverse-feeding experimental set-up. i, Energy expenditure of regular (grey) and reverse-fed (blue) mice after three weeks. j,k, Circadian plots of energy expenditure (j) and oxygen consumption (k). l, Cumulative food consumption of regular (grey) and reverse-fed (blue) mice after three weeks. m, Averaged food consumption. n, Percentage of IL-17A+ cells among adipose γδ T cells of regular (grey) and reverse-fed (blue) mice over 24 h. o, Experimental set-up for 50% CR feeding. p,q, Energy expenditure (p) and oxygen consumption (q) of ad-libitum-fed (grey) and 50%-CR-fed (orange) mice over 24 h. r, IL-17A flow plots of adipose γδ T cells from mice fed ad libitum (AL) and mice fed a 50% CR diet. s, Percentage of IL-17A+ cells. t, Energy expenditure from 50%-CR-fed (orange) and reverse-fed (blue) mice over 24 h. u, Percentage of IL-17A+ cells among adipose γδ T cells. v, HFD experimental set-up. w, RER SFD-fed (grey) and HFD-fed (red) mice after three weeks. x, Circadian plot of RER. y, Bar plot of food intake. z, Left, IL-17A histograms of adipose γδ T cells from SFD-fed and HFD-fed mice. Right, percentage of IL-17A+ cells. White and grey panels represent light and dark periods, respectively. au, Data are representative of three independent experiments; wz, two independent experiments. c,d,f,j,k,p,q,t,x, Data are mean; b,e,g,i,ln,s,u,w,y,z, Data are mean ± s.e.m.; n = 4–6 mice per group. bg,il,n,p,q,t,x,z, Significance was calculated using cosinor analysis, with cosine fitted curves; amplitude (amp) and acrophase (acro) were extracted from the cosinor model. m, Two-group analysis with ANCOVA. s,u, Two-way ANOVA. y, Two-tailed unpaired student’s t-test. NS, not significant, **P < 0.01, ***P < 0.001, ****P < 0.0001. Source Data
Fig. 4
Fig. 4. γδ T cells are the main source of adipose tissue IL-17A, and maintain adipose tissue DNL.
a, Representative flow plot showing that γδ T cells are the main producer of IL-17A in adipose tissue. b, Adipose IL-17A protein levels by enzyme-linked immunosorbent assay (ELISA) from wild-type (WT) mice (grey), Tcrδ−/− mice (red) and Tcrδ−/− mice reconstituted with wild-type γδ T cells (γδs; open circles). c, Diurnal expression of IL-17A–GFP by γδ17 T cells across the adipose tissue depots BAT, scWAT and epiWAT. d, Diagrammatic representation of circadian whole-body metabolism by RER, showing the most active metabolic processes during the day and night, with the IL-17A circadian rhythm overlaid. e, Representation of the DNL pathway. f, Correlation analysis of BAT IL-17RC protein levels with FASN abundance from OPABAT. g, Correlation heat map of IL-17RC protein levels with DNL protein abundance from OPABAT. h,i, Circadian time plots showing the relative expression of the DNL genes Fasn (h) and Acc2 (i) from BAT of wild-type (grey) and Tcrδ−/− (red) mice. d,h,i, White and grey panels represent light and dark periods, respectively. ad,h,i, Data are representative of two independent experiments. bd,h,i, Data are mean ± s.e.m., n = 4–12 mice per group. Significance was calculated using a one-way ANOVA (b), two-tailed unpaired student’s t-test (c), simple linear regression (f,g) or cosinor analysis, with cosine fitted curves (h,i); amplitude (amp) and acrophase (acro) were extracted from the cosinor model. NS, not significant, *P < 0.05, **P < 0.01, ***P < 0.001, ****P < 0.0001. Source Data
Fig. 5
Fig. 5. IL-17A signalling is necessary for adipocyte DNL, and for whole-body metabolism.
a,b, Expression of Mlxipl (a) and Fasn (b) in brown adipocytes treated with IL-17A (2 µg). c, BAT DNL gene expression from PBS- or IL-17A-treated mice. d, Diagram showing the increased expression of IL-17A in ArntlIl7r mice. e, Acly, Fasn, Acaca and Scd1 gene expression from wild-type or ArntlIl7r BAT. f,g, Acly, Fasn, Acaca and Scd1 gene expression from wild-type or Il17a/f−/− BAT (f), and from wild-type or Il17a−/− BAT (g). h, Left, western blots for the circadian expression of SCD1 from wild-type (grey) and Il17a−/− (knockout; KO) BAT. Right, circadian plot. a.u., arbitrary units. i, Heavy-labelled-water protocol for palmitate labelling. j,k, Palmitate abundance (j) and palmitate synthesis (k) in wild-type (grey) and Il17a/f−/− (red) BAT and liver. l, Left, experimental set-up for high-sucrose feeding. Right, weight gain after three weeks. m, Left, volcano plot of DNL-associated gene expression in BAT from wild-type and AdIl17rc−/− mice, from GSE144255. log2(FC), log2-transformed fold change. Right, differential expression heat map of DNL-associated genes. n, DNL-associated genes from skin biopsies of patients with psoriasis who were treated with placebo or ixekizumab (150 mg). o, RER averaged by light or dark cycle. p, Circadian rhythmicity analysis. q, Wild-type (grey) and Il17a/f−/− body temperature. r, Core-temperature data averaged by light or dark cycle. s, Circadian rhythmicity analysis. White and grey panels represent light and dark periods, respectively. Data are representative of one independent experiment (hk), two independent experiments (ag,l) or four independent experiments, with two experiments pooled (os). c,e-h,j-i,o,q,r Data are mean ± s.e.m., n = 3–6 mice per group. Significance was calculated using two-tailed paired student’s t-test (a,b), two-tailed unpaired student’s t-test (c,eg), two-way ANOVA (l), repeated measures ANOVA, (j,k,o,r) or cosinor analysis, with cosine fitted curves (h,p,s); amplitude (amp) and acrophase (acro) were extracted from the cosinor model. NS, not significant, *P < 0.05, **P < 0.01, ***P < 0.001 ****P < 0.0001. Source Data
Extended Data Fig. 1
Extended Data Fig. 1. Innate IL-17+ T cells are enriched for molecular-clock genes within tissues.
a, Density plot expression of individual molecular-clock genes across innate T cell subsets. b, Violin plot showing expression of the molecular-clock score of type-17 versus type-1 innate lymphocytes, further divided by tissue-resident or lymphoid. c, Violin plot showing expression of the molecular-clock score of adipose innate lymphocytes. d, Violin plot showing expression of the molecular-clock score of thymic innate lymphocytes (left), heat map of averaged gene expression of molecular-clock genes with hierarchal clustering of data generated from GSE141895 and E-MTAB-7704 (right). e, Violin plot showing expression of the molecular-clock score of lung innate lymphocytes (left), heat map of averaged gene expression of molecular-clock genes with hierarchal clustering of data generated from E-MTAB-8732 (right). f, Violin plot showing expression of the molecular-clock score of meningeal innate lymphocytes (left), heat map of averaged gene expression of molecular-clock genes with hierarchal clustering of data generated from GSE147262 (right). g, Violin plot showing expression of the molecular-clock score of splenic innate lymphocytes (left), heat map of averaged gene expression of molecular-clock genes with hierarchal clustering of data generated from GSE142845 (right). h, Representative gating strategy for adipose tissue T cells.
Extended Data Fig. 2
Extended Data Fig. 2. Lymph-node γδ T cells express IL-17A and IFNγ rhythmically.
a, Diagrammatic representation of experimental set-up. b, Representative flow plots of IL-17A expression at nadir (ZT5), and peak (ZT15). c, IL-17A expression by lymph node (LN) γδ T cells stimulated ex vivo for 3 h with PMA/Ionomycin, d, displaying diurnal rhythm. e, Circadian fluctuation of IL-17A production by LN γδ T cells over 24 h. f, Representative flow plots of IFNγ expression at peak (ZT6), and nadir (ZT18). g,h, IFNγ expression by LN γδ T cells stimulated ex vivo for 3 h with PMA/Ionomycin, displaying diurnal rhythm (h). i, Circadian fluctuation of IFNγ production by LN γδ T cells over 24 h. j, Representative flow plots of NFIL3 expression at nadir (ZT12), and peak (ZT0). k, NFIL3 expression by LN γδ T cells stimulated ex vivo for 3 h with PMA/Ionomycin. l, Circadian fluctuation of NFIL3 expression (blue), overlaid with IL-17A production (red), by LN γδ T cells over 24 h. Data are representative of two independent experiments. White and grey panels represent light and dark periods respectively. c-e,g-i,k,l, Data shown as mean ± SEM, n = 4 mice per group. c,d,g,h,k, Significance was calculated using two-tailed unpaired students t-test, e,i,l, Cosinor analysis, with cosine fitted curves, l, amplitude (Amp) and acrophase (Acro) were extracted from the cosinor model. NS = Non-Significant, * p < 0.05, ** p < 0.01. Source Data
Extended Data Fig. 3
Extended Data Fig. 3. SR9009 dose-dependently decreases IL-17A and IL-17F expression by lymph-node γδ T cells.
a, Circadian time plot of percentage CD27- and CD27+ γδ T cell subsets in adipose tissue, with b, subset cell numbers of 24 h. c, Lymph-node lymphocyte viability with increasing concentration of SR9009. d, Percentage of lymph-node γδ T cell of total lymphocytes with increasing concentrations of SR9009. e, Representative flow plots of RORγt expression by lymph-node γδ T cell with increasing concentration of SR9009, with f, percentage and g, MFI of RORγt expressed by lymph-node γδ T cells. h, Representative flow plots of IL-17A expression by lymph-node γδ T cell with increasing concentration of SR9009, with i, percentage and j, MFI of IL-17A expressed by lymph-node γδ T cells. k, Percentage and l, MFI of IL-17AF expressed by lymph-node γδ T cells with increasing concentration of SR9009. m, Percentage of IL-17A expressed by lymph-node γδ T cells with increasing concentration of vehicle. n, γδ T cell and o, αβ T cell percentage of total lymphocytes in Arntlfl (grey) and ArntlVav1 (red) mice. p, IL-7R histogram of adipose T cells. q, γδ T cell percentage of total lymphocytes in Arntlfl (grey) and ArntlIl7r (red) mice. r, Percentage IL-17A of adipose γδ T cells from Arntlfl (grey) and ArntlVav1 (red) mice. a,b, White and grey panels represent light and dark periods respectively. a,b,nr, Data shown as mean ± SEM, n = 4–8 mice per group. c,d,f,g,i-o, Data shown as mean ± SEM, cm, n = 9 technical replicates from 3 mice per group. a,b, Significance was calculated using cosinor analysis, with cosine fitted curves, amplitude (Amp) and acrophase (Acro) were extracted from the cosinor model, c,d,f,g,i-m,p, One-way ANOVA, s,t, Two-tailed unpaired students t-test. NS = Non-Significant, * p < 0.05, ** p < 0.01, *** p < 0.001, **** p < 0.0001. Source Data
Extended Data Fig. 4
Extended Data Fig. 4. Whole-body metabolic rate is entrained by light and disrupted by irregular feeding.
a, Time plot of metabolic rate parameter (oxygen consumption) of mice on a regular light cycle (grey; lights on 7am – 7pm), versus mice on an inverted light cycle (red; lights on 7pm – 7am) after 3 weeks on these light cycles. b, Time plot of metabolic rate parameter (oxygen consumption) of mice on a regular feeding cycle (grey; feeding 7pm – 7am), versus mice on a reverse feeding cycle (blue; feeding 7am – 7pm) after 3 weeks on these feeding regimens. c, Time plot of metabolic rate parameter (oxygen consumption) of mice on an ad libitum (grey), versus mice on a 50% CR feeding regimen (orange) after 1 week on these feeding regimens. d, Time plot of energy expenditure of mice on an ad libitum (grey), versus mice on a 50% CR feeding regimen (orange) after 1 week on these feeding regimens. e, Per cent feeding during day or night of SFD and HFD-fed mice. f, Representative histograms (left), of adipose γδ T cells from SFD (grey) or HFD (red) fed mice with circadian time plots of RORγt MFI (right). g, Diagrammatic representation of experimental set-up for long-term HFD feeding regimen experiments. h, Time plot of weight gain over a 16-week HFD feeding regime. White and grey panels represent light and dark periods respectively. Data are representative of ad three independent experiments, or e,f, two independent experiments. ah, data shown as mean ± SEM, n = 4–9 mice per group. f, Significance was calculated using cosinor analysis, with cosine fitted curves, amplitude (Amp) and acrophase (Acro) were extracted from the cosinor model, e, Two-tailed unpaired students t-test, h, two-way repeated measures ANOVA followed by Bonferroni’s multiple comparisons test. NS, Non-Significant, ** p < 0.01, *** p < 0.001. Source Data
Extended Data Fig. 5
Extended Data Fig. 5. A three-week HFD feeding regime increases the onset and severity of EAE.
a, EAE scores of SFD-fed (grey), and b, HFD-fed (red) mice. c, Disease progression measured by rate of change (disease onset to disease peak) between feeding regimes. d, Time to clinical end-point post EAE induction between feeding regimes. Data are representative of two independent experiments. ad, data shown as mean ± SEM, n = 6 mice per group. Significance was calculated using b, two-way repeated measures ANOVA followed by Bonferroni’s multiple comparisons test, c, Two-tailed unpaired students t-test, d, Simple survival analysis with Gehan-Breslow-Wilcoxon test. * p < 0.05, ** p < 0.01. Source Data
Extended Data Fig. 6
Extended Data Fig. 6. γδ T cells are the main source of adipose tissue IL-17A, and maintain adipose tissue DNL.
a, Pie chart depicting adipose lymphocytes contributing to total IL-17A expression, γδ T cells (red), non-T lymphocytes (dark grey) and TH17 cells (light grey). b, Correlation analysis of BAT IL-17RC protein levels with ACLY abundance from OPABAT. c, Circadian time plots showing relative expression of the DNL gene Scd1 from BAT of wild-type (grey) and Tcrδ−/− (red) mice. c, White and grey panels represent light and dark periods respectively. c, Data are representative of two independent experiments. c, data shown as mean ± SEM, n = 4–14 mice per group. b, Significance was calculated using a simple linear regression, c, cosinor analysis, with cosine fitted curves, amplitude (Amp) and acrophase (Acro) were extracted from the cosinor model. ** p < 0.01. Source Data
Extended Data Fig. 7
Extended Data Fig. 7. BAT DNL proteins do not correlate with the expression of other cytokine receptors.
a, Correlation heat map of IL-17RC protein levels with adipocyte lipolysis-associated protein abundance from OPABAT. b, Correlation heat map of IL-10RB protein levels with DNL protein abundance from OPABAT. c, Correlation heat map of IL-1R1 protein levels with DNL protein abundance from OPABAT. d, Correlation heat map of IL-6ST protein levels with DNL protein abundance from OPABAT. e, Correlation heat map of IL-17RE protein levels with DNL protein abundance from OPABAT. f, Correlation heat map of IL-4R protein levels with DNL protein abundance from OPABAT. af, Significance was calculated using simple linear regression. * p < 0.05, ** p < 0.01. Source Data
Extended Data Fig. 8
Extended Data Fig. 8. IL-17A regulates DNL and lipolysis gene expression.
a, Relative expression of DNL genes Mlxipl, Fasn, Acaca, Scd1 and Elovl6 in the BAT of Arntlfl mice compared to BAT of ArntlIl7r mice at ZT6. b, Relative expression of DNL genes Mlxipl, Fasn, Acaca, Scd1 and Elovl6 in the BAT of wild-type mice compared to BAT of Il17a/f−/− mice at ZT6. c, Relative expression of lipolysis/thermogenesis genes Ucp1, Cidea, Ppargc1a, Atgl and Hsl in the BAT of wild-type mice compared to BAT of Il17a/f−/− mice at ZT6. d, Relative expression of lipolysis/thermogenesis genes Ucp1, Cidea, Ppargc1a, Atgl and Hsl in the BAT of Arntlfl mice compared to BAT of ArntlIl7r mice at ZT18. eh, Relative expression of Mlxipl (e), Acly (f), Fasn (g) and Scd1 (h) after administration of IL-17A (1 µg) and IL-17F (1 µg) to wild-type and Il17a/f−/− mice compared to PBS administered controls. i, Expression of ACACA and SCD from skip biopsies of patients with psoriasis who were treated with placebo and brodalumab. ai, Data shown as mean ± SEM, n = 2–5 mice per group, or n = 27–33 patients per group i. ad,i, Significance was calculated using Two-tailed unpaired student’s t-test. * p < 0.05, ** p < 0.01, *** p < 0.001. Source Data

References

    1. Scheiermann, C., Gibbs, J., Ince, L. & Loudon, A. Clocking in to immunity. Nat. Rev. Immunol.18, 423–437 (2018). - PubMed
    1. Man, K., Loudon, A. & Chawla, A. Immunity around the clock. Science354, 999–1003 (2016). - PMC - PubMed
    1. Ince, L. M. et al. Influence of circadian clocks on adaptive immunity and vaccination responses. Nat. Commun.14, 476 (2023). - PMC - PubMed
    1. Trim, W. V. & Lynch, L. Immune and non-immune functions of adipose tissue leukocytes. Nat. Rev. Immunol.22, 371–386 (2022). - PubMed
    1. Kane, H. & Lynch, L. Innate immune control of adipose tissue homeostasis. Trends Immunol.40, 857–872 (2019). - PubMed

MeSH terms

LinkOut - more resources