. 2024 Dec;636(8041):241-250.
doi: 10.1038/s41586-024-08137-x. Epub 2024 Oct 30.

RAS-mutant leukaemia stem cells drive clinical resistance to venetoclax

Affiliations

RAS-mutant leukaemia stem cells drive clinical resistance to venetoclax

Junya Sango et al. Nature. 2024 Dec.

Abstract

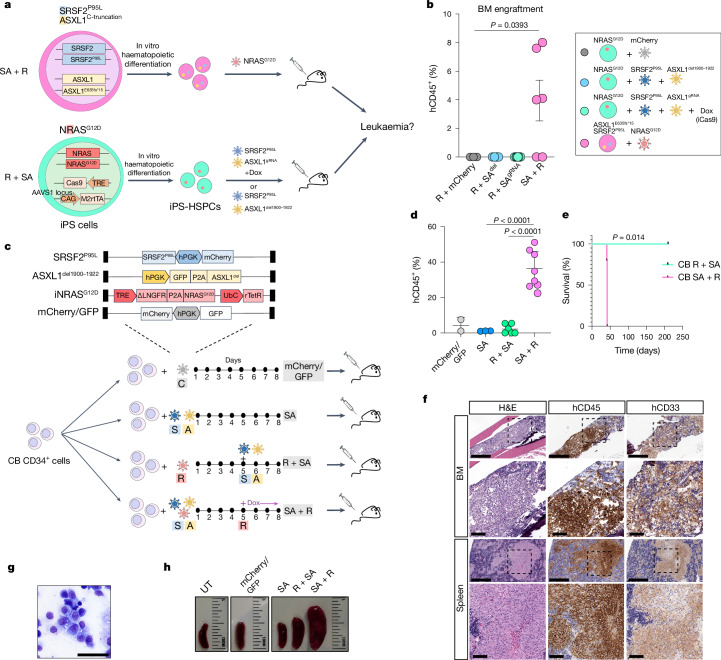
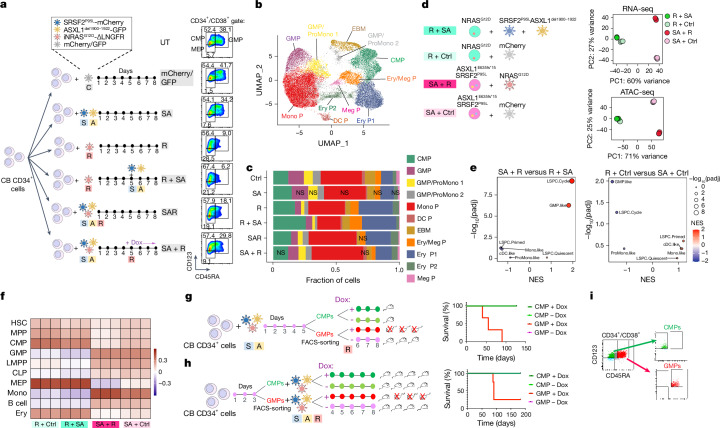
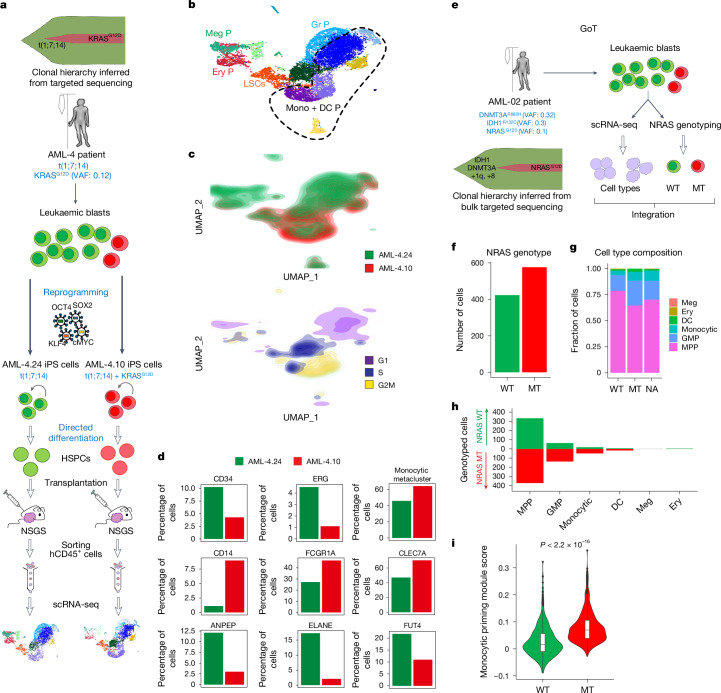
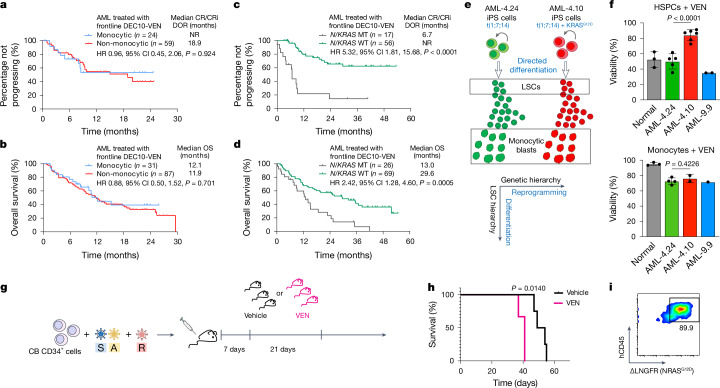
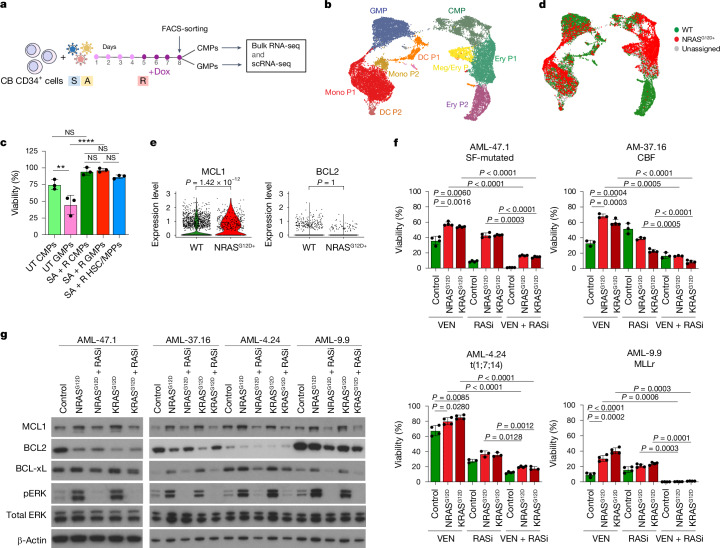
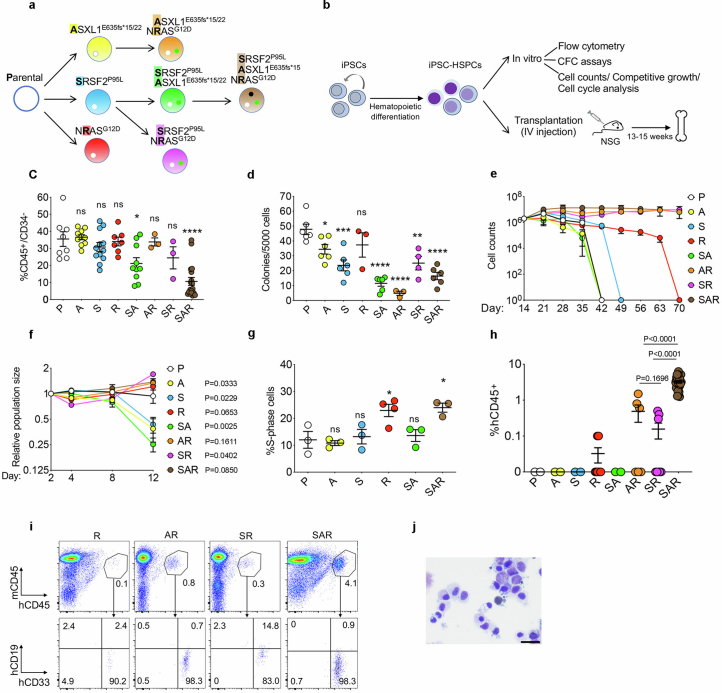
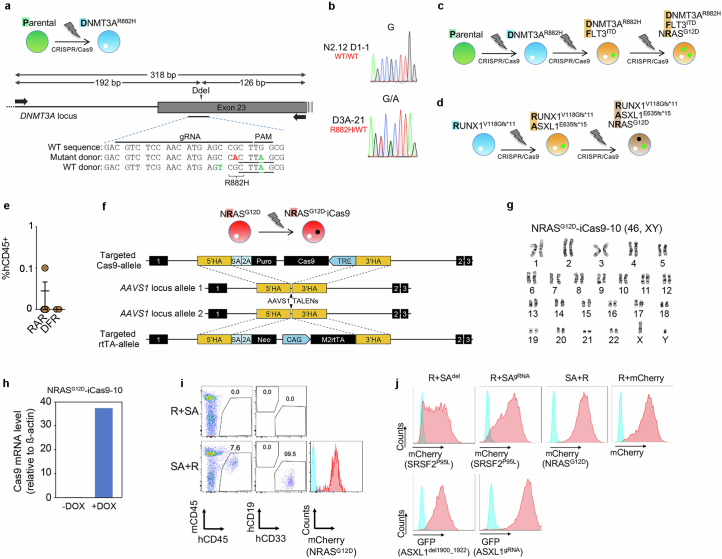
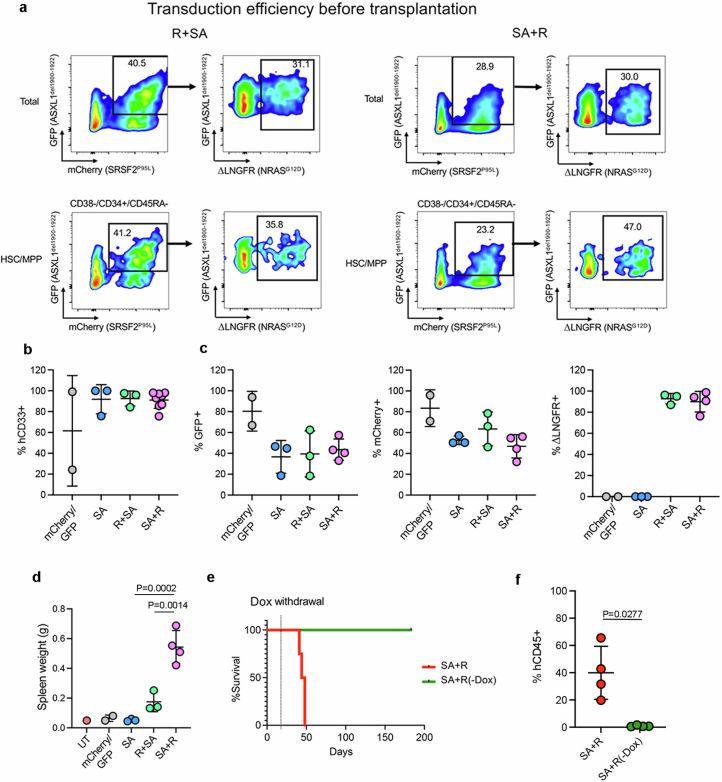
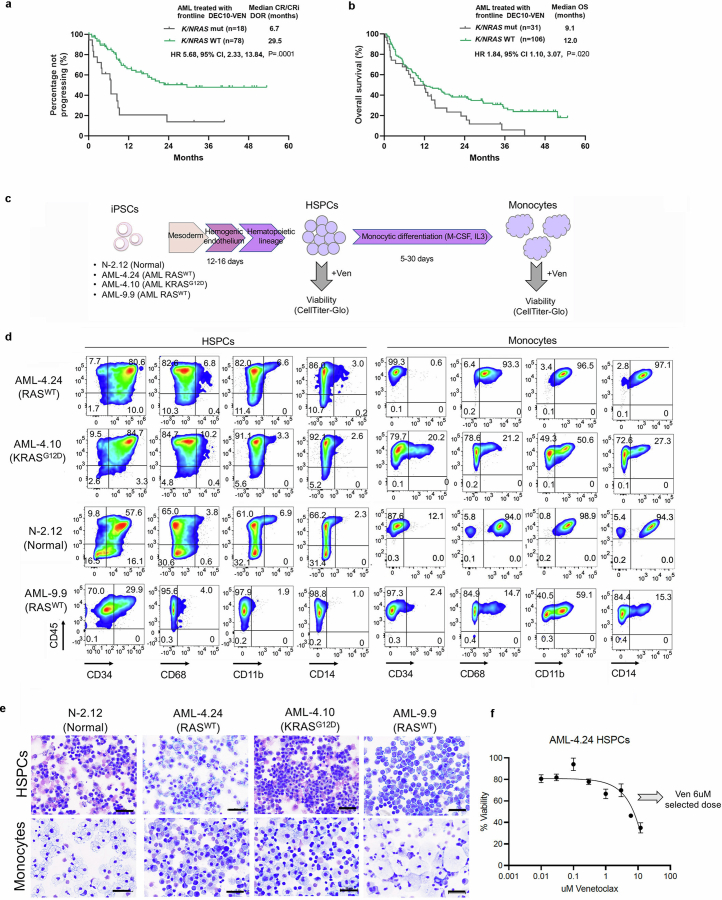
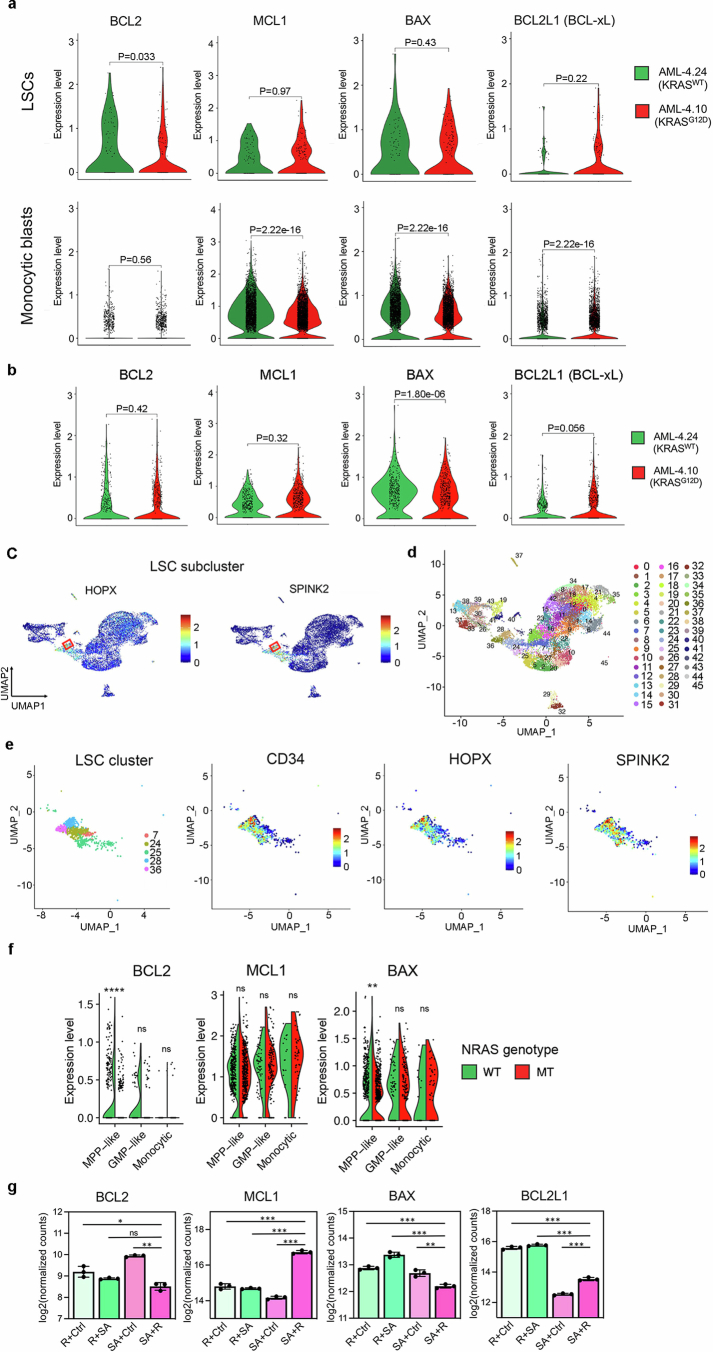
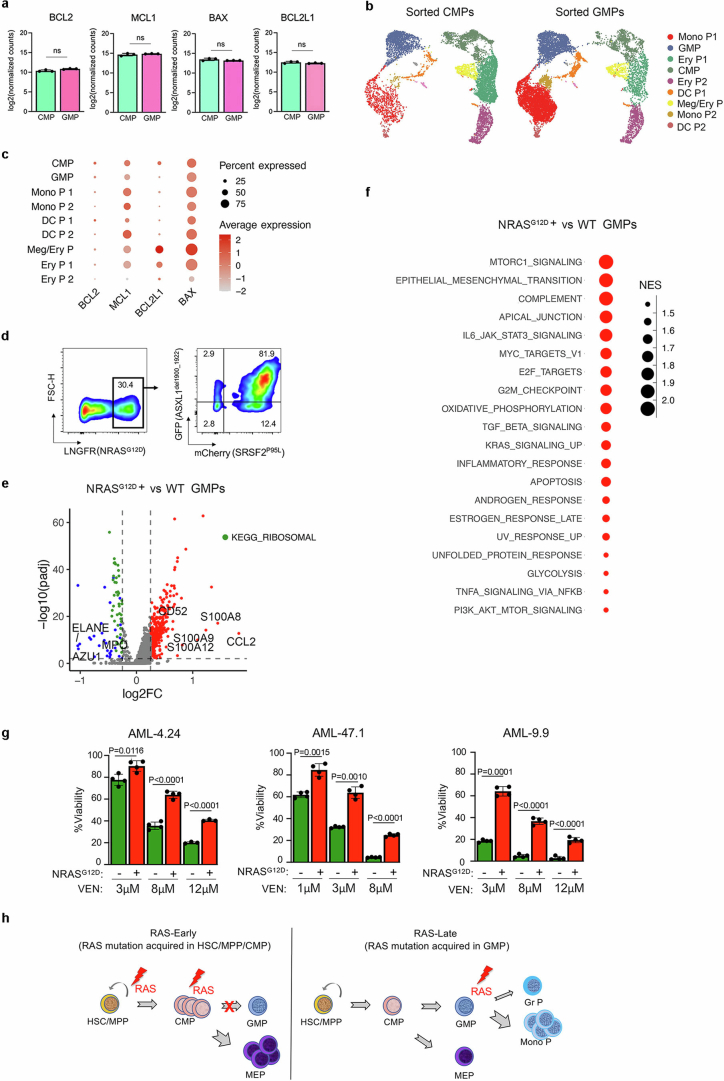
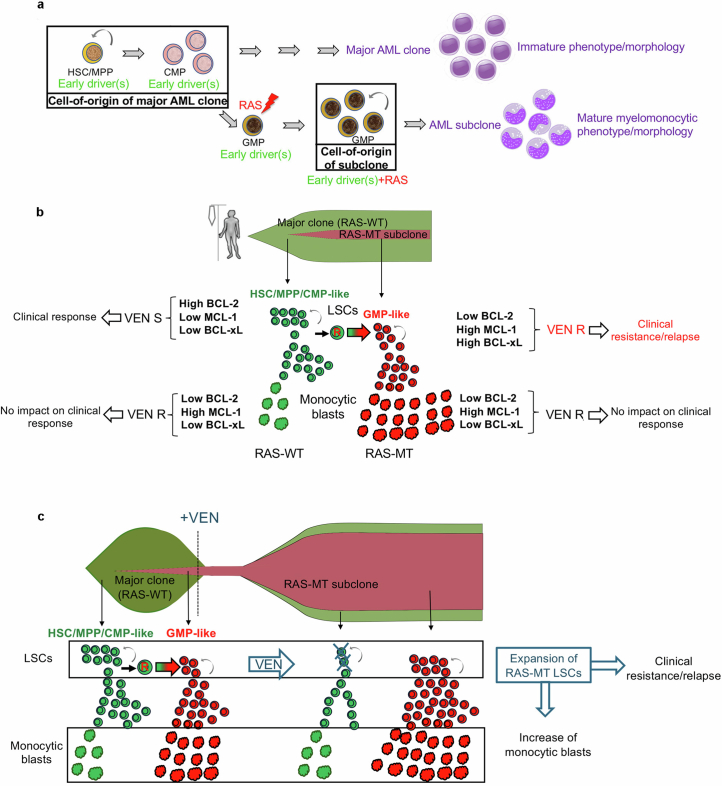
Cancer driver mutations often show distinct temporal acquisition patterns, but the biological basis for this, if any, remains unknown. RAS mutations occur invariably late in the course of acute myeloid leukaemia, upon progression or relapsed/refractory disease1-6. Here, by using human leukaemogenesis models, we first show that RAS mutations are obligatory late events that need to succeed earlier cooperating mutations. We provide the mechanistic explanation for this in a requirement for mutant RAS to specifically transform committed progenitors of the myelomonocytic lineage (granulocyte-monocyte progenitors) harbouring previously acquired driver mutations, showing that advanced leukaemic clones can originate from a different cell type in the haematopoietic hierarchy than ancestral clones. Furthermore, we demonstrate that RAS-mutant leukaemia stem cells (LSCs) give rise to monocytic disease, as observed frequently in patients with poor responses to treatment with the BCL2 inhibitor venetoclax. We show that this is because RAS-mutant LSCs, in contrast to RAS-wild-type LSCs, have altered BCL2 family gene expression and are resistant to venetoclax, driving clinical resistance and relapse with monocytic features. Our findings demonstrate that a specific genetic driver shapes the non-genetic cellular hierarchy of acute myeloid leukaemia by imposing a specific LSC target cell restriction and critically affects therapeutic outcomes in patients.


Conflict of interest statement

Competing interests: M.K. receives research support from Klondike, AbbVie and Janssen, and consulting fees from AbbVie, Syndax, Novartis, Servier, AbbVie, Menarini-Stemline Therapeutics, Adaptive, Dark Blue Therapeutics, MEI Pharma, Legend Biotech, Sanofi Aventis, Auxenion GmbH, Vincerx, Curis, Intellisphere and Janssen. D.A.L. is an advisory board member of Mission Bio, Veracyte, Pangea and Alethiomics and has received research support from Ultima Genomics unrelated to this work. A.M. receives research support from Chimeric Therapeutics, Lin Biosciences, Hibercell Inc., Qurient and Molecular Templates, Inc. C.D.D. has received consulting fees from Abbvie, AstraZeneca, Astellas, GenMab, Notable Labs, Rigel and Servier. E.P. is cofounder of, and holds a fiduciary role in Isabl Inc. P.L. has received grants to his Institution from Amgen, Mirati, Revolution Medicines, Boehringer Ingelheim and Virtec Pharmaceuticals. P.L. is an advisory board member of Frontier Medicines, Ikena, Biotheryx and PAQ-Tx (consulting fees and equity in each) and has received consulting fees or honoraria from Black Diamond Therapeutics, AmMax, OrbiMed, PAQ-Tx, Repare Therapeutics, Boehringer Ingelheim and Revolution Medicines. EPP has received consulting fees or honoraria from Janssen, Daiichi Sankyo and Cellarity, unrelated to the current study. The other authors declare no competing interests.

Figures

Fig. 1
Fig. 1. RASmut are obligatory late events in AML and need to be acquired after specific cooperating mutations.
a, iPS cells with heterozygous SRSF2 and ASXL1 (top) or NRAS (bottom) mutations were differentiated into HSPCs and transduced with lentiviral vectors encoding NRASG12D (top) or SRSF2P95L and either a truncated dominant-negative ASXL1 transgene (ASXL1del1900–1922) or a gRNA targeting exon 12 of ASXL1 (bottom) and transplanted intravenously into NSGS mice. b, Human engraftment in the bone marrow of mice 13–15 weeks post-transplantation. Each data point represents one mouse: n = 3 (R + mCherry), 4 (R + SAdel), 8 (R + SAgRNA) and 6 (SA + R) from two experiments. Mean and s.e.m. are shown. P values were calculated with a two-tailed unpaired t-test. c, CB CD34+ cells were transduced with the lentiviral vectors shown at the indicated time intervals of in vitro culture, with Dox added to the culture at the indicated time point to induce NRASG12D expression. The cells were prestimulated for 4 days before and were injected into NSGS mice 7 days after the first transduction. d, Human engraftment in the bone marrow of NSGS mice transplanted with CB CD34+ cells shown in c. P values were calculated with one-way ANOVA; n = 2 (mCherry/GFP), 3 (SA), 6 (R + SA) and 8 (SA + R) mice. Mean and s.d. are shown. e, Survival of mice from c; n = 5 (SA + R) and 3 (R + SA) mice. f, Bone marrow and spleen images from a mouse transplanted with CB SA + R cells representative of at least three experiments. Left, haematoxylin and eosin (H&E) staining. Middle and right, immunohistochemistry for hCD45 (pan-haematopoietic) and hCD33 (myeloid) markers. g, Wright–Giemsa-stained human cells retrieved from the bone marrow of a mouse transplanted with SA + R CB cells. Image representative of at least three independent experiments. h, Representative images of spleens from mice transplanted as shown in c. BM, bone marrow; UT, untransplanted. Scale bars, 500 μm (f, lower magnification panels), 100 μm (f, higher magnification panels), 50 μm (g). Source data
Fig. 2
Fig. 2. RAS-MT AML LSCs originate from GMPs harbouring pre-existing mutations.
a, Experimental scheme. CB CD34+ cells were transduced with lentiviral vectors as indicated and analysed by flow cytometry (right panels) on the day of transplantation, that is, 7 days after the first transduction (day 8). b, Uniform manifold approximation and projection (UMAP) representation of integrated single-cell transcriptome data from the six groups of cells shown in a, on day 8. c, Stacked barplots showing fraction of cells in each cluster. With the exception of clusters marked as not significant (NS), all other cluster sizes were significantly different from the respective cluster size in the Ctrl (mCherry/GFP) group (logistic regression). d, iPS-HSPCs with NRAS (R) or SRSF2 and ASXL1 mutations (SA) were transduced with lentiviral vectors as indicated. Right panels, principal component analysis of RNA-seq and ATAC-seq data from sorted CD34+CD45+ cells; n = 3 independent experiments for all groups. e, Normalized enrichment scores (NES) and adjusted P values derived from gene set enrichment analysis (GSEA) for gene sets corresponding to the human AML developmental hierarchy from ref. using gene lists ranked by the −log10(Padjusted (padj)) × log2FC from the indicated differential expression comparisons. f, Heatmap showing Pearson correlation values for the ATAC-seq peak normalized read counts in the iPS-HSPC dataset from d and overlapping peaks in primary normal haematopoietic cell subpopulations from ref. . g, Experimental scheme (left) and survival (right) of animals transplanted with CMPs and GMPs transduced with SA and sorted prior to induction of R with Dox. n = 1 for each CMP group (±Dox); n = 3 for each GMP group (±Dox). h, Experimental scheme (left) and survival (right) of mice transplanted with CMPs and GMPs sorted prior to SAR transduction. n = 4 for all groups. i, FACS-sorted CMPs and GMPs from g. CLP, common lymphoid progenitor; DC P, dendritic cell progenitor; EBM, eosinophil/basophil/mast cell; Ery/Meg P, erythrocyte/megakaryocyte progenitor; Ery P, erythrocyte progenitor; LMPP, lymphoid-primed MPP; Meg P, megakaryocyte progenitor; Mono, monocyte; Mono P, monocyte progenitor; ProMono, promonocyte. Source data
Fig. 3
Fig. 3. RAS-MT AML LSCs produce leukaemic cells with monocytic features.
a, Two iPS cell lines derived from a patient with AML with a clonal t(1;7;14) translocation and a subclonal KRASG12D mutation, one capturing the RASWT major clone (AML-4.24) and one the KRASG12D subclone (AML-4.10) of the patient AML were differentiated to HSPCs, transplanted into NSGS mice, allowed to generate lethal leukaemias, collected, sorted and subjected to scRNA-seq analysis. b, UMAP representation of single-cell transcriptome data. The dashed line delineates the monocytic metacluster. c, Cell density across the UMAP coordinates from b. Cells coloured by sample (top panel) or phase of the cell cycle (bottom panel). d, Percentage of cells expressing the indicated genes (normalized counts > 0.5) or contained in the monocytic metacluster (shown in b). e, Schematic of the GoT experiment. f, Number of cells that could be genotyped as NRAS-WT (423 cells) or MT (576 cells) by GoT. g,h, Fraction (g) and absolute number (h) of cells belonging to each cell type assigned from transcriptome data in the NRAS-WT and NRAS-MT cells (NA, not assigned to a NRAS genotype). Cells belonging to the NRAS-MT clone contain a higher fraction of monocytic cells (Fisher’s exact test P value = 0.00028, odds ratio = 3.255) and lower fraction of immature HSC/MPP-like cells (Fisher’s exact test P value = 3.044 × 10−11, odds ratio = 0.3345) than NRAS-WT cells. i, Expression of a monocytic priming gene module (IRF7/IRF8) from ref. in NRAS-WT and MT cells. The whiskers denote the 1.5× interquartile range (IQR). The lower and upper hinges of the boxes represent the first and third quartiles, respectively. The middle line represents the median. Points represent values outside the 1.5× IQR. The P value was calculated with a two-sided Wilcoxon test.
Fig. 4
Fig. 4. RASMT LSCs drive clinical resistance to VEN.
ad, Outcome data from 118 older or unfit patients with newly diagnosed AML treated in a prospective trial with 10-day DEC and VEN (DEC10-VEN). DOR (a) and OS (b) in patients with monocytic versus non-monocytic AML. DOR (c) and OS (d) in patients with AML with TP53-WT with versus without N/KRAS mutations. log-rank test, two-tailed unadjusted P values. e, Two iPS cell lines derived from a patient with AML, one capturing the RAS-WT major clone (AML-4.24) and one the KRASG12D subclone (AML-4.10), were differentiated in vitro to LSCs and to monocytic blasts. f, HSPCs and monocytes derived from normal iPS cells and from the indicated AML-iPS cell lines were treated with VEN and viability was measured by CellTiter-Glo. Viability compared with dimethylsulfoxide (DMSO)-treated is shown. HSPCs, n = 3 normal, 5 AML-4.24, 7 AML-4.10 and 2 AML-9.9; monocytes, n = 3 normal, 4 AML-4.24, 2 AML-4.10 and 1 AML-9.9 independent experiments; mean and s.d. are shown. P values were calculated with a two-tailed unpaired t-test. g, CB CD34+ cells transduced with SA + R, as shown in Fig. 2a were transplanted into NSGS mice. The mice were treated with VEN (100 mg kg−1 day−1 by oral gavage) or vehicle, starting 1 week post-transplant, daily, for 3 weeks. h, Survival of mice from the experiment shown in g; n = 3 (VEN) and 4 (Vehicle). P value was calculated with a log-rank (Mantel–Cox) test. i, NRASG12D expression in hCD45+ cells from the bone marrow of a moribund mouse treated with VEN. CI, confidence interval; CR, complete remission; CRi, CR with incomplete haematologic recovery; HR, hazard ratio; NR, not reached. Source data
Fig. 5
Fig. 5. Resistance of RAS-MT GMP-like LSCs to VEN is due to the RASmut and not to the GMP state.
a, Experimental design. b, UMAP representation of integrated single-cell transcriptome data from FACS-sorted SA + R CMPs and GMPs. c, Viability of FACS-sorted CMPs, GMPs and HSC/MPPs, untransduced (UT) or transduced with SA + R, treated with VEN. **P < 0.01, ****P < 0.0001, NS (one-way ANOVA). Mean and s.d. from n = 3 independent experiments are shown. d, Cells expressing ΔLNGFR-NRASG12D (NRASG12D+, red) or none of the transgenes (WT, green) projected in the UMAP from b. e, Expression of MCL1 and BCL2 in NRASG12D+ versus WT cells belonging to the GMP cluster. P values were calculated with a two-sided Wilcoxon test. f, Viability of CD34+ LSCs from the indicated patient-derived AML-iPS cell lines with or without (Control) ectopic lentiviral expression of NRASG12D or KRASG12D, as indicated, treated with VEN and/or RASi. Viability compared with DMSO-treated group is shown. Mean and s.d. from n = 3 or 4 independent experiments is shown. P values were calculated with a two-tailed unpaired t-test. g, Detection of the indicated proteins by western blotting in CD34+ LSCs from the indicated patient-derived AML-iPS cell lines with or without (Control) ectopic lentiviral expression of NRASG12D or KRASG12D, with or without treatment with RASi. Samples were derived from the same experiment and processed in parallel. β-Actin controls were run on different gels as sample processing controls. For source data, see Supplementary Fig. 4. CBF, core binding factor; SF-mutated, splicing factor-mutated; MLLr, MLL-rearranged.
Extended Data Fig. 1
Extended Data Fig. 1. Characterization of in vitro and in vivo leukemic properties of edited iPS-HSPCs with single, double and triple mutations.
a, Isogenic single, double and triple-mutant iPS cell lines generated through sequential CRISPRCas9-mediated gene editing of a normal iPS cell line (Parental). b, Overview of in vitro and in vivo phenotypic assessment of iPS-HSPCs. c, Fraction of CD34/CD45+ cells, i.e. hematopoietic cells that have lost CD34 expression upon maturation, on day 14 of hematopoietic differentiation. Mean and SEM from n = 8(P), 10(A, SA), 12(S), 7(R), 3(AR, SR), and 19(SAR) independent differentiation experiments with 2 (A, S, SA, AR, SR, SAR) or 3(R) iPS cell lines per genotype are shown. *P < 0.05, ****P < 0.001, ns: not significant (two-tailed unpaired t test). d, Number of methylcellulose colonies obtained from iPS-HSPCs on day 14 of hematopoietic differentiation. Mean and SEM from n = 6(P, A, S, SA, SAR), 3 (R, AR) and 4(SR) independent differentiation experiments with 2 iPS cell lines per genotype are shown. *P < 0.05, **P < 0.01, ***P < 0.001, ****P < 0.0001, ns: not significant (two-tailed unpaired t test). e, Cell counts of iPS-HSPCs in liquid hematopoietic differentiation culture. Mean and SEM of n = 2(P, R, AR, SR), 4(A, SAR), 6(S) and 11(SA) independent differentiation experiments with 1 (P, R, SAR) or 2 (A, S, AR, SR, SA) iPS cell lines per genotype are shown. f, Competitive growth assay. The cells were mixed 1:1 at the onset of hematopoietic differentiation with an isogenic normal iPS cell line stably expressing GFP. The relative population size was estimated as the percentage of GFP- cells (calculated by flow cytometry) at each time point relative to the population size on day 2. Mean and SEM from n = 3(P), 4(A), 6(S, R), 5(SA), 2(AR,SR) and 8(SAR) independent differentiation experiments with 2 (P, A, R, SA, AR, SR, SAR) or 3 (S) iPS cell lines per genotype are shown. P values were calculated with a two-tailed unpaired t test. g, Cell cycle analyses of iPS-HSPCs. Mean and SEM from 3 (P, A, S, SA, SAR) and 4 (R) independent differentiation experiments with one line per genotype are shown. *P < 0.05 (R vs P: P = 0.0336; SAR vs P: P = 0.0279), ns: not significant (two-tailed unpaired t test). h, Human engraftment in the BM of NSG mice 13-15 weeks after transplantation with HSPCs derived from the indicated gene-edited mutant iPS cell lines (1 or 2 lines per genotype). Error bars show mean and SEM of values from individual mice. n = 2 (P); 2(A); 2(S); 8(R); 2(SA); 6(AR); 8(SR); 27(SAR). P values were calculated with a two-tailed unpaired t test. i, Representative flow cytometry for evaluation of human engraftment in mouse BM. j, Wright-Giemsa-stained BM cells retrieved from a mouse transplanted with SAR iPS-HSPCs. Scale bar, 25 μm. P: Parental; A: ASXL1-mutant; S: SRSF2-mutant; R: NRAS-mutant; SA: SRSF2-ASXL1 double mutant; AR: ASXL1-NRAS- double mutant; SR: SRSF2-NRAS double mutant; SAR: SRSF2-ASXL1-NRAS triple mutant. Source data
Extended Data Fig. 2
Extended Data Fig. 2. Generation and characterization of additional edited iPS cell lines.
a, Gene editing strategy to generate a heterozygous DNMT3AR882H mutation in the same normal parental iPS cell line used to generate the lines shown in Extended Data Fig. 1, through homology-directed repair with simultaneous delivery of one mutant and one WT donor templates. Schematic representation of the DNMT3A locus with the position of the gRNA target sequence and the PCR primers used for RFLP analysis shown. Silent mutations introduced in the donor to create the DdeI restriction site (underlined) and inactivate the PAM motif are indicated in green font. The G→A mutation giving rise to the R882H amino acid substitution is shown in red font. b, Sanger sequencing confirming the G→A heterozygous point mutation giving rise to the R882H amino acid substitution in one edited DNMT3AR882H iPS cell line selected after screening. c,d, Schematic of gene editing steps to generate the iPS cell lines with single, double and triple driver mutations starting from the parental WT (c) or an iPS cell line derived from a RUNX1- familial platelet disorder (FPD) patient harboring a germline RUNX1V118Gfs*11 mutation (d). e, Human engraftment in the BM of NSG mice 13-15 weeks after transplantation with gene-edited iPS-HSPCs. Mean and SEM is shown. RAR: RUNX1-ASXL1-NRAS triple mutant (n = 5 mice); DFR: DNMT3A-FLT3-NRAS triple mutant (n = 2 mice). f, Gene targeting strategy used to introduce a tetracycline response element (TRE)-driven Cas9 and the reverse tetracycline transactivator (rtTA), respectively, into the two alleles of the AAVS1 locus using TALEN-mediating targeting. g, Karyotype of iPS cell line NRASG12D-iCas9-10 confirming a normal diploid karyotype. h, Confirmation of induction of iCas9 expression by DOX in the NRASG12D-iCas9-10 iPS cells by qRT-PCR. i, Representative flow cytometric evaluation of engraftment in mice transplanted with the iPS-HSPCs shown in Fig. 1a,b. j, Representative flow cytometric evaluation of transduction efficiency of iPS-HSPCs with the lentiviral constructs shown in Fig. 1a, co-expressing the indicated fluorescent protein genes. Source data
Extended Data Fig. 3
Extended Data Fig. 3. Leukemogenesis in CB CD34+ cells.
a, Transduction efficiency of CB CD34 + R + SA and SA + R cells prior to transplantation (day 8 depicted in Fig. 1c). b, Percentage of CD33+ myeloid cells (of hCD45+ cells) in the BM of mice transplanted with CB CD34+ cells shown in Fig. 1c. Mean and SD of values from individual mice is shown. n = 2 (mCherry/GFP), 3 (SA), 3 (R + SA) and 8 (SA + R) mice. c, Percentage of hCD45+ cells from transplanted mice expressing each lentiviral transgene (based on expression of the linked fluorescent protein). Mean and SD of values from individual mice is shown. n = 2 (mCherry/GFP), 3 (SA), 3 (R + SA) and 4 (SA + R) mice. d, Spleen weight of transplanted mice. n = 2 (mCherry/GFP), 3 (SA), 3 (R + SA) and 4 (SA + R) mice. UT: untransplanted. Mean and SD are shown. P values were calculated with one way ANOVA. e,f, Survival (e) and BM engraftment (f) of mice injected with SA + R CB CD34+ cells under continuous Dox administration or following Dox withdrawal 14 days after transplantation. Mean and SD of values from 4 individual mice per group are shown. P value was calculated with a two-tailed unpaired t test. Source data
Extended Data Fig. 4
Extended Data Fig. 4. Genomic analyses of iPS-HSPCs.
a,b, Differentially expressed genes (a) and differentially accessible peaks (b) between the indicated iPS-HSPC groups. c, Significantly enriched (GSEA) AML gene sets. NES: Normalized enrichment score. d, Cumulative enrichment scores for a GMP-like signature derived from human primary AML. e, Cell-type-specific regulatory elements from Corces et al. HSC: hematopoietic stem cell; MPP: multi-potent progenitor; CMP: common myeloid progenitor; GMP: granulocyte-monocyte progenitor; LMPP: lymphoid-primed multipotent progenitor; CLP: common lymphoid progenitor; MEP: megakaryocyte-erythrocyte progenitor; Mono: monocyte; Ery: erythroid cell; NK: natural killer. f, Accessibility (Reads Per Kilobase per Million mapped ATAC reads) of the regulatory elements specific to the indicated cell types (CMP/MEP, GMP, GMP/Mono and Mono) from e. The X axis shows distance from the transcriptional start site.
Extended Data Fig. 5
Extended Data Fig. 5. Leukemogenesis from CB GMPs.
a, Transduction efficiency of SA + R CB CMPs and GMPs from two independent experiments. b, Sorted SA + R CB CMPs and GMPs were injected into NSGS mice. A mouse that received SA + R GMPs succumbed to a lethal disease 11 weeks after transplantation, while a mouse transplanted with SA + R CMPs showed no signs of illness. c, Engraftment in mice transplanted with SA + R CMPs or GMPs 11 weeks after transplantation. d,e, Sorted CMPs (upper panels) and GMPs (lower panels) from the experiments depicted in Fig. 2g (d) and Fig. 2h (e), cultured with Dox and assayed on the day of transplantation (day 8). f, Wright-Giemsa-stained human cells with blast morphology retrieved from the BM of a mouse transplanted with SA + R GMPs. Image representative of 3 independent experiments. Scale bar, 50 μm. g, BM engraftment in a secondary recipient mouse upon serial transplantation of SA + R GMPs from the experiment shown in Fig. 2g. h, Wright-Giemsa-stained cells from the BM of a secondary recipient mouse transplanted with SA + R GMPs. The larger cells are human blasts. The smaller cells with segmented nuclei correspond to murine neutrophils. Scale bar, 50 μm. i,j, Engraftment in the BM of mice transplanted with SA + R from Fig. 2g (i) or SAR from Fig. 2h (j) CMPs or GMPs at the endpoint of the experiment. n = 1 mouse for each SA + R CMP group; 3 mice for each SA + R GMP group; 4 mice for each SAR CMP group; 3 for GMP+Dox and 2 for GMP-Dox. Mean and SD are shown. k, Percentage of CD33+ myeloid cells (of hCD45+ cells) in the BM of mice (n = 3) transplanted with SA + R GMPs from Fig. 2g. Mean and SD are shown. l, Flow cytometry analysis of a representative mouse transplanted with sorted SA + R or SAR GMPs from the experiments schematically depicted in Fig. 2g,h, respectively, showing that the leukemic cells co-express all 3 mutant transgenes. Source data
Extended Data Fig. 6
Extended Data Fig. 6. Genomics analyses of genetically engineered iPS- and CB- HSPCs.
a, Transgene expression in sorted GMPs and HSC/MPPs transduced with SA + R. b, Assessment of ERK activation (phospho-ERK, pERK) by Western blotting in total CB CD34+ cells or FACS-sorted CMPs, GMPs and HSC/MPPs transduced with the indicated lentiviral vectors or untransduced (UT). Shown is one representative experiment out of 2. Samples were derived from the same experiment and processed in parallel. β-actin controls were run on different gels as sample processing controls. For source data, see Supplementary Fig. 4. c, Hierarchical clustering of expression values of differentially expressed genes (DEGs) from the SA + R vs SA+Ctrl and SA + R vs R + SA comparisons. Genes belonging to clusters 8 and 10 were designated as “RAS-late genes”. d, Hierarchical clustering of accessibility scores of differentially accessible peaks (DAPs) from the SA + R vs SA+Ctrl and SA + R vs R + SA comparisons. The peaks of cluster 4 were designated as “RAS-late peaks”. e, Top statistically significant transcription factor (TF) motifs (identified using the Homer motif discovery package) enriched in the “RAS-late” peaks from d, grouped by TF families. f, Selected top enriched (over-representation analysis) HALLMARK pathways in the “RAS-late genes” from c. Count: number of “RAS-late genes” in the gene set. Adjusted p values were derived from GSEA. g, Selected enriched (FDR < 0.1) HALLMARK pathways in SA + R vs Ctrl cells of the GMP cluster from Fig. 2b. NES: normalized enrichment score. h, Expression of the genes belonging to the “KRAS signaling up” HALLMARK gene set. Cluster 4 contains 65 genes that are upregulated specifically in the SA + R group. i, Aggregate accessibility of the 65 genes related to RAS signaling that are specifically upregulated in SA + R iPS-HSPCs (cluster 4 genes from h). *P < 0.05, **P < 0.01, ***P < 0.001, ns: not significant (two-tailed unpaired t-test). The top and bottom lines of the whiskers denote the highest and lowest values, respectively. The box spans the interquartile range (25th-75th percentile) and the line represents the median. j, Accessibility (Reads Per Kilobase per Million mapped ATAC reads, RPKM) within 1 kb on either side of the transcription start site (TTS) of the 65 genes related to RAS signaling that are specifically upregulated in SA + R iPS-HSPCs (cluster 4 genes from h), showing higher accessibility in SA + R and SA+Ctrl cells, compared to the R + SA and R+Ctrl groups. The X axis shows distance from the TTS. One representative replicate per condition is shown.
Extended Data Fig. 7
Extended Data Fig. 7. RAS mutations drive monocytic differentiation.
a, UMAP of integrated single-cell transcriptome data from Fig. 3a,b, at resolution 0.4. b, Expression of selected marker genes in each annotated cluster from the GoT data. c, Fraction of CD14+ monocytic blasts in AML patients with mutations in RAS pathway genes (NRAS, KRAS or PTPN11) or without any RAS pathway mutation (RAS WT). “Any RAS MT” denotes cases with mutations in either of the 3 genes NRAS, KRAS or PTPN11. The whiskers denote the 1.5* IQR (interquartile range). The lower and upper hinges of the boxes represent the first and third quartiles, respectively. The middle line represents the median. Points represent values outside of the 1.5* IQR. The P value was calculated with a two-sided Wilcoxon test. d, FAB subtype of AML patients with mutations (MT) in RAS pathway genes (NRAS, KRAS or PTPN11) or without any RAS pathway mutation (RAS WT). “Any RAS MT” denotes cases with mutations in either of the 3 genes NRAS, KRAS or PTPN11. Two-tailed Fisher test, ns: not significant. e, Flow cytometry for myelomonocytic markers CD68 and CD11b in CD34+ cells from 4 patient-derived AML-iPS cell lines with or without (Control) lentiviral expression of NRASG12D or KRASG12D. MLLr: MLL-rearranged; SF: splicing factor; CBF: core binding factor. f, Fraction of CD14+ monocytic blasts in AML patients with or without mutations (MT) in SRSF2 and ASXL1 genes. SA denotes cases with double SRSF2 and ASXL1 mutations; S/A WT denotes cases without SRSF2 or ASXL1 mutations. The whiskers denote the 1.5* IQR (interquartile range). The lower and upper hinges of the boxes represent the first and third quartiles, respectively. The middle line represents the median. Points represent values outside of the 1.5* IQR. ns: not significant (two-sided Wilcoxon test). g, FAB subtype of AML patients with or without mutations (MT) in SRSF2 and ASXL1 genes. SA denotes cases with double SRSF2 and ASXL1 mutations; S/A WT denotes cases without SRSF2 or ASXL1 mutations. Two-tailed Fisher test, ns: not significant. h, Proportion of cases with or without NRAS or KRAS mutations (RASMT and RAS–WT, respectively) with or without combined SRSF2 and ASXL1 mutations (SA and not SA, respectively) among 399 CMML patients from the MDS International Working Group cohort (Bernard et al. 2022). (P value: one tail Fisher test). i,j, Experimental scheme. Schematic of lentiviral vectors used (i). Vectors N, K and F are DOX-inducible. k, Myelomonocytic markers CD11b and CD14 in GMPs with various transgene combinations, shown in i,j, cultured for 5 days after sorting. N: NRASG12D, K: KRASG12D, F: FLT3-ITD, IDH: IDH1R132H, S: SRSF2P95L; A: ASXL1Del. l, Heatmap showing differential expression of the indicated granulocytic (MPO, AZU1, ELANE) and monocytic (CD14, CD52, S100A6, S100A8, S100A9, CCL2, CCL3, CCL4) lineage genes in the GMP cluster, in the indicated comparisons, from the single-cell transcriptome data from Fig. 2a,b. *P < 0.05, ***P < 0.001 (two-sided Wilcoxon test).
Extended Data Fig. 8
Extended Data Fig. 8. Differentiation of normal and AML- iPS cells into HSPCs and monocytes.
a,b, Duration of response (DOR) (a) and overall survival (OS) (b) in AML patients with N/KRAS mutations vs without N/KRAS mutations. Log-rank test, two-tailed unadjusted P values. CR: complete remission; CRi: CR with incomplete hematologic recovery; HR: hazard ratio; CI: confidence interval. c, Schematic of protocol for in vitro directed differentiation of human iPS cells into HSPCs and monocytes. d, Representative flow cytometry assessment of HSPC (CD34) and monocytic (CD68, CD11b, CD14) markers in normal iPS cell and AML iPS cell-derived HSPCs and monocytes. e, Representative Wright-Giemsa-stained cytospin preparations of HSPCs and monocytic cells derived from normal iPS cell and AML iPS cell lines, showing immature morphology (upper panels) and typical monocytic morphology (lower panels). Images are from one experiment out of at least 3 repeats. Scale bars, 50 μm. f, Dose-response curve of AML-4.24 HSPCs treated with VEN at the indicated doses. Cells were treated for 48 h and viability was assessed using the CellTiter-Glo assay. Mean and SD from n = 2 independent experiments is shown. 6 μM was selected as the dose for subsequent assays.
Extended Data Fig. 9
Extended Data Fig. 9. Single-cell transcriptomic analyses of AML-iPS cell-LSCs.
a, Violin plots showing expression of anti- and pro-apoptotic genes of the BCL2 family in monocytic blasts (monocytic metacluster generated by merging all monocytic and dendritic cell clusters shown in Fig. 3b and Extended Data Fig. 7a) or LSCs (cluster 28 shown in b-d) within the AML-4.10 and AML-4.24 leukemia cells from xenografts. P values were calculated with a two-sided Wilcoxon test. b, Expression of anti- and pro-apoptotic genes in the LSC cluster shown in Fig. 3b without subclustering in the iPS cell-derived leukemia cells from xenografts. P values were calculated with a two-sided Wilcoxon test. c, Expression of HSC markers SPINK2 and HOPX projected onto the integrated UMAP. The red squares indicate the LSC subcluster (cluster 28 shown in c,d). d, UMAP representation of single-cell transcriptome data in resolution 3.2, yielding 46 clusters. e, Left panel: UMAP representation of the LSC cluster (from resolution 0.4 clustering shown in Fig. 3b) subdivided into 5 clusters (from resolution 3.2 clustering shown in c). Middle and right panels: Expression of HSC markers CD34, HOPX and SPINK2 projected onto the LSC cluster UMAP. f, Split-violin plots showing expression of anti- and pro-apoptotic genes in monocytic blasts or immature MPP-like and GMP-like cells of the NRASMT and NRASWT genetic clones from GoT data. **P < 0.01, ****P < 0.0001, ns: not significant (two-tailed Wilcoxon test). g, Normalized expression of the indicated pro- and anti- apoptotic genes in the genetically engineered iPS-HSPCs shown in Fig. 2d (n = 3 independent experiments for all groups). *P < 0.05, **P < 0.01, ***P < 0.001, ns: not significant (two-tailed unpaired t-test).
Extended Data Fig. 10
Extended Data Fig. 10. Genomics analyses of genetically engineered sorted CMPs and GMPs.
a, Expression of the indicated pro- and anti- apoptotic genes in FACS-sorted SA + R CMPs and GMPs measured by bulk RNA-Seq. Mean and SD from n = 3 independent experiments are shown. ns: not significant (two-tailed unpaired t-test). b, UMAP representation of integrated single-cell transcriptome data from FACS-sorted SA + R CMPs (left) and GMPs (right) from Fig. 5a,b. c, Expression of the indicated pro- and anti- apoptotic genes in the different clusters. d, Flow cytometry analysis of SA + R CB cells from the experiment shown in Fig. 5a on day 6, showing that the vast majority of ΔLNGFR-NRASG12D+ cells also express the other two transgenes (GFP-ASXL1del1900-1922 and mCherry-SRSF2P95L). e, Volcano plot showing differentially expressed genes between NRASG12D+ and WT cells of the GMP cluster from Fig. 5b,d. Significantly upregulated and downregulated genes (Wilcoxon test) are shown in red and blue, respectively. Granulocytic (MPO, AZU1, ELANE) and monocytic (S100A8, S100A9, S100A12, CD52, CCL2) lineage genes, downregulated and upregulated, respectively, are highlighted. Downregulated genes encoding ribosomal proteins are shown in green. f, Top 20 most enriched HALLMARK pathways in NRASG12D+ vs WT cells belonging to the GMP cluster from Fig. 5b,d. NES: normalized enrichment score. g, Viability of CD34+ LSCs from the indicated patient-derived AML-iPS cell lines with or without ectopic lentiviral expression of NRASG12D, treated with VEN at the indicated concentrations. %Viability compared to DMSO-treated group is shown. n = 3 for AML-4.24 treated with 12 μM VEN and n = 4 for all other groups. Mean and SD are shown. P values were calculated with a two-tailed unpaired t test. h, Summary schematic of the effects of RAS mutation acquisition in different HSPC types. RAS mutations acquired by more primitive HSPCs (HSC/MPPs or CMPs) result in reduction of GMP formation and reciprocal increase in megakaryocyte and erythroid progenitors (MEP) (left panel). Acquisition of RAS mutations in GMPs drives their differentiation towards the monocytic and away from the granulocytic lineage (right panel).
Extended Data Fig. 11
Extended Data Fig. 11. Summary models for the role of RAS mutations in leukemic transformation.
a, Model of emergence of RAS-MT LSCs based on the findings of this study. RASmut acquired by a GMP harboring previously acquired driver mutations can give rise to an LSC. The latter generates leukemic cells with mature monocytic immunophenotype, whereas the major AML clone without RASmut gives rise to leukemic cells with more immature features. Thus, the LSC of the RAS-MT subclone originates from a different and more mature type of cell in the hematopoietic hierarchy (a GMP) than the LSC of the major ancestral RAS-WT clone, which originates from an HSC/MPP/CMP. b, Mechanism of VEN resistance in AML with subclonal N/KRAS mutations. RAS-WT LSCs express high levels of BCL-2 and are the targets of VEN therapy, whose elimination translates into a clinical response. In contrast, monocytic blasts, regardless of genotype, are uniformly VEN-resistant, as they lack expression of BCL-2 and instead rely on MCL-1 expression for survival. However, resistance of the monocytes has no impact on the clinical response, which is instead dependent on the elimination of LSCs – the cells with self-renewal potential that can maintain and regenerate the leukemia. Critically, RAS-MT LSCs downregulate BCL-2 and upregulate MCL-1 and BCL-xL and are thus resistant to VEN. It is the VEN resistance of these RAS-MT LSCs, rather than the resistance of the monocytic blasts, that is the determinant of clinical relapse and resistance. VEN S: VEN-sensitive; VEN R: VEN-resistant. c, Impact of VEN treatment on the size of immature and monocytic AML populations within RAS-WT and RAS-MT clones. Treatment with VEN imposes selection pressure at the level of the LSCs. RAS-MT LSCs are resistant to VEN – in contrast to RAS-WT LSCs, which are VEN sensitive – and are thus selected for and expand upon VEN treatment. Because RAS-MT LSCs produce more monocytic blasts than RAS-WT LSCs, expansion of the RAS-MT LSC compartment is also accompanied by an increase in the fraction of monocytic blasts. However, it is the LSCs and not the monocytic cells that mediate clinical resistance and relapse, with the increase in monocytic cells being a byproduct of RAS-MT LSC expansion without relevance to the clinical outcome.

References

    1. Papaemmanuil, E. et al. Genomic classification and prognosis in acute myeloid leukemia. N. Engl. J. Med.374, 2209–2221 (2016). - PMC - PubMed
    1. Papaemmanuil, E. et al. Clinical and biological implications of driver mutations in myelodysplastic syndromes. Blood122, 3616–3627 (2013). - PMC - PubMed
    1. Miles, L. A. et al. Single-cell mutation analysis of clonal evolution in myeloid malignancies. Nature587, 477–482 (2020). - PMC - PubMed
    1. Morita, K. et al. Clonal evolution of acute myeloid leukemia revealed by high-throughput single-cell genomics. Nat. Commun.11, 5327 (2020). - PMC - PubMed
    1. Menssen, A. J. et al. Convergent clonal evolution of signaling gene mutations is a hallmark of myelodysplastic syndrome progression. Blood Cancer Discov.3, 330–345 (2022). - PMC - PubMed

MeSH terms