. 2024 Dec;636(8042):430-437.
doi: 10.1038/s41586-024-08151-z. Epub 2024 Oct 30.

Tissue spaces are reservoirs of antigenic diversity for Trypanosoma brucei

Affiliations

Tissue spaces are reservoirs of antigenic diversity for Trypanosoma brucei

Alexander K Beaver et al. Nature. 2024 Dec.

Erratum in

Abstract

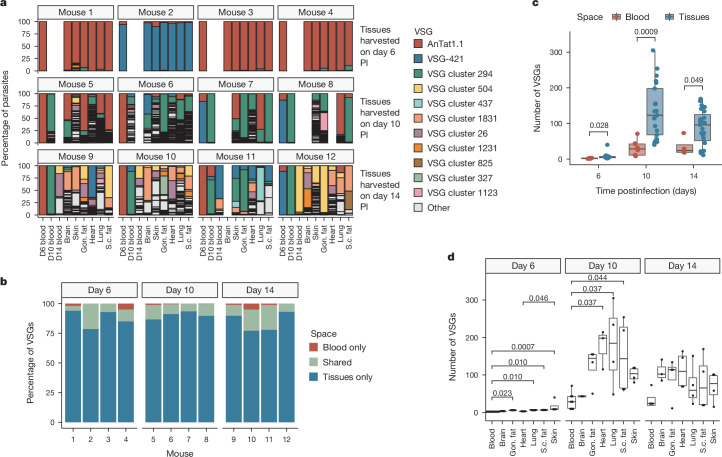
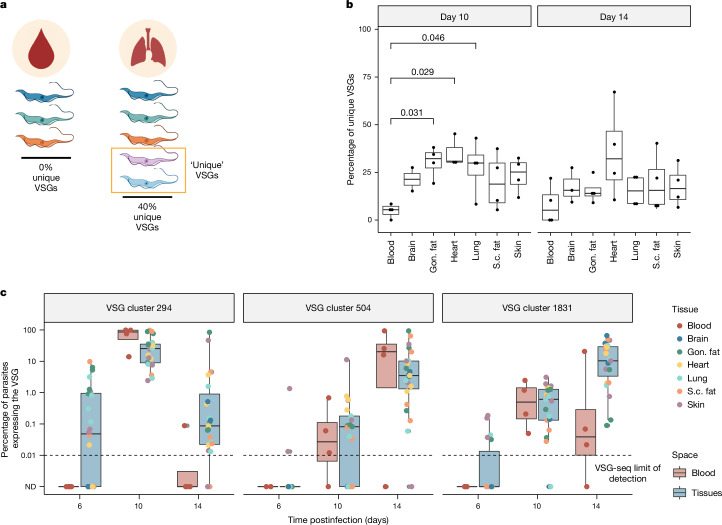
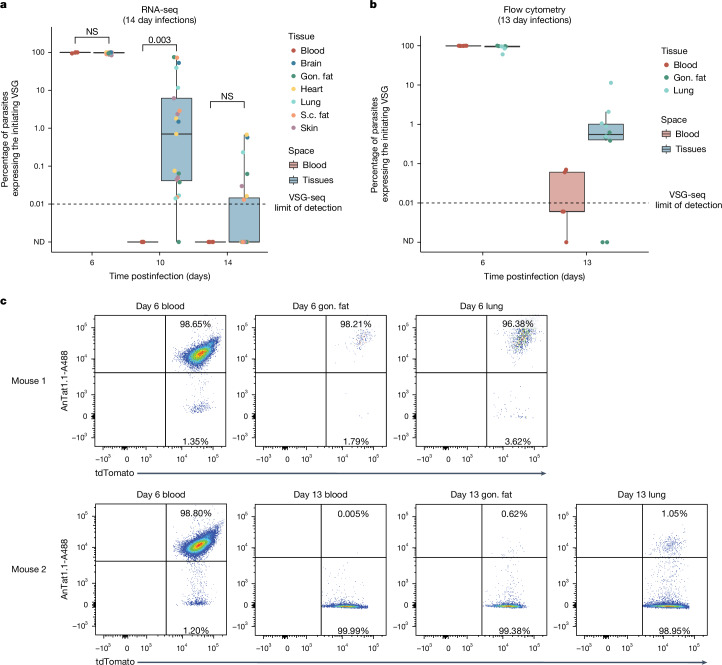
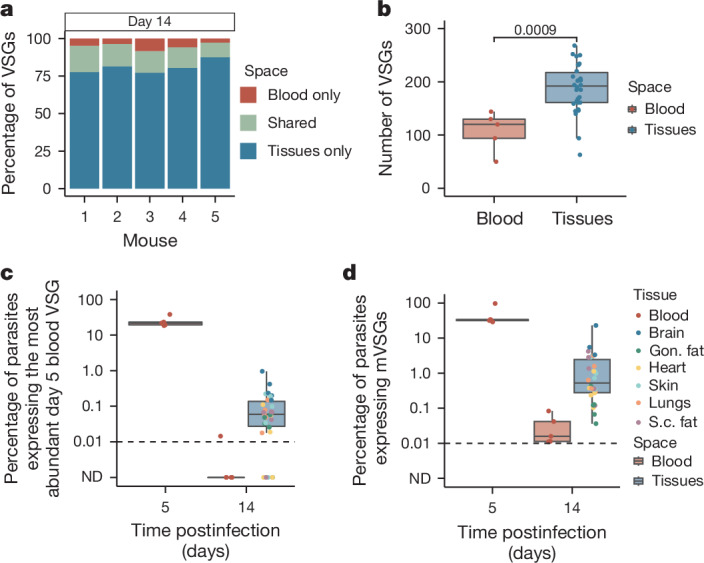
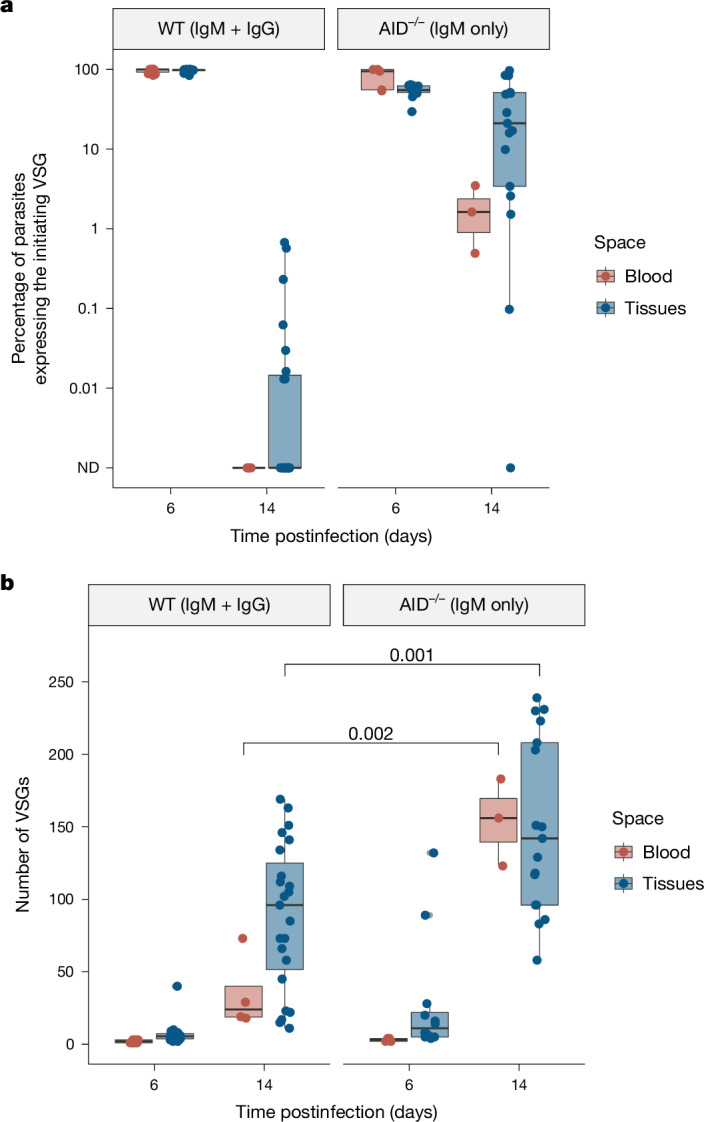
The protozoan parasite Trypanosoma brucei evades clearance by the host immune system through antigenic variation of its dense variant surface glycoprotein (VSG) coat, periodically 'switching' expression of the VSG using a large genomic repertoire of VSG-encoding genes1-6. Recent studies of antigenic variation in vivo have focused near exclusively on parasites in the bloodstream6-8, but research has shown that many, if not most, parasites reside in the interstitial spaces of tissues9-13. We sought to explore the dynamics of antigenic variation in extravascular parasite populations using VSG-seq7, a high-throughput sequencing approach for profiling VSGs expressed in populations of T. brucei. Here we show that tissues, not the blood, are the primary reservoir of antigenic diversity during both needle- and tsetse bite-initiated T. brucei infections, with more than 75% of VSGs found exclusively within extravascular spaces. We found that this increased diversity is correlated with slower parasite clearance in tissue spaces. Together, these data support a model in which the slower immune response in extravascular spaces provides more time to generate the antigenic diversity needed to maintain a chronic infection. Our findings reveal the important role that extravascular spaces can have in pathogen diversification.


Conflict of interest statement

Competing interests: The authors declare no competing interests.

Figures

Fig. 1
Fig. 1. Extravascular parasites harbour most of the antigenic diversity in an infection.
a, The percentage of parasites expressing each VSG within a space. The 11 VSGs with the highest overall expression are coloured, and all other VSGs are in grey as ‘other’. b, Stacked bar graphs from each infected mouse representing the percentage of VSGs that were found exclusively within the blood (red), exclusively within tissue spaces (blue) or shared by both the blood and at least one tissue (green). c, Quantification of the number of VSGs found within the blood (red) or tissue spaces (blue) at each time point (Shapiro–Wilk normality test followed by a two-tailed Student’s t-test Benjamini–Hochberg corrected). d, The number of VSGs in each tissue space (Shapiro–Wilk normality test followed by a two-tailed Dunnett’s test). In ad, n = 12 total mice with four biologically independent animals per time point over two independent experiments. In boxplots, boxes represent values between the first (25%) and third (75%) quartiles with a line at the median, and extending lines represent the maximum and minimum values not including outliers that are further than 1.5 times the interquartile range. Gon. fat, gonadal fat; PI, postinfection; s.c. fat, subcutaneous fat. Source Data
Fig. 2
Fig. 2. Tissue-resident parasites express a unique repertoire of VSGs during infection.
a, We define ‘unique’ VSGs as those VSGs solely found within a specific space in a mouse. b, The percentage of VSGs that were unique to one space within a mouse (Shapiro–Wilk normality test followed by a two-tailed Dunnett’s test). Day 6 samples were excluded from this analysis because few VSGs are expressed at this point. n = 4 biologically independent animals per time point over two independent experiments (total of eight mice). c, The expression of three representative VSGs (cluster 294, 504 and 1831) within blood and tissue samples on days 6, 10, and 14. n = 12 total mice with four biologically independent animals per time point over two independent experiments. ND indicates that the VSG was not detected. In boxplots, boxes represent values between the first (25%) and third (75%) quartiles with a line at the median, and extending lines represent the maximum and minimum values not including outliers that are further than 1.5 times the interquartile range. Illustration in a created using BioRender (https://biorender.com). Source Data
Fig. 3
Fig. 3. VSG-specific parasite clearance is slower in tissues than in the blood.
a, The percentage of parasites expressing the initiating VSG (AnTat1.1 or VSG-421) at days 6, 10 and 14 postinfection. Tissue samples were grouped together (blue) and compared to blood samples (red) (two-tailed Wilcoxon test). n = 12 total mice with four biologically independent animals per time point over two independent experiments. b, Quantification of the number of parasites that were tdTomato positive and stained positive for AnTat1.1 by flow cytometry (n = 10 total mice with five biologically independent mice per time point examined over one independent experiment). The horizontal dotted line represents the limit of detection for VSG-seq. c, Representative flow cytometry plots from tissues collected from mice infected with chimeric triple-marker parasites that express tdTomato constitutively in their cytoplasm. Parasites were stained with anti-AnTat1.1 antibody. In boxplots, boxes represent values between the first (25%) and third (75%) quartiles with a line at the median, and extending lines represent the maximum and minimum values not including outliers that are further than 1.5 times the interquartile range. NS, not significant. Source Data
Fig. 4
Fig. 4. Tsetse bite-initiated infections show increased antigenic diversity and delayed immune clearance in extravascular spaces.
Data from five mice infected with RUMP 503 parasites from a tsetse fly bite. a, Bar graphs representing the percentage of VSGs in each mouse that were found exclusively within the blood (red), exclusively within tissue spaces (blue) or shared by both the blood and at least one tissue (green). b, Quantification of the number of VSGs found within the blood (red) or tissue spaces (blue) on day 14 postinfection (Shapiro–Wilk normality test followed by a two-tailed Student’s t-test Benjamini–Hochberg corrected). c, The percentage of parasites within each mouse expressing the most abundant VSG from the day 5 blood. d, The percentage of parasites expressing one of the mVSGs found to be expressed by RUMP 503 parasites in the salivary gland of a tsetse fly. In boxplots, boxes represent values between the first (25%) and third (75%) quartiles with a line at the median, and extending lines represent the maximum and minimum values not including outliers that are further than 1.5 times the interquartile range. For ad, n = 5 biologically independent mice examined over one independent experiment. Source Data
Fig. 5
Fig. 5. Delayed parasite clearance correlates with an increase in VSG diversity.
a, The percentage of parasites expressing the initiating VSG (AnTat1.1 or VSG-421) in both wild-type (WT) and AID−/− mice. b, The number of VSGs expressed within the blood (red) and tissues (blue) of WT and AID−/− mice (Shapiro–Wilk normality test followed by a two-tailed Student’s t-test). For WT mice, n = 12 total biologically independent mice with four mice representing harvested tissues for each time point. For AID−/− experiments, n = 5 total biologically independent mice with tissues from two mice represented on day 6 and tissues from three mice represented on day 14. Day 6 blood represents samples from all five mice. In boxplots, boxes represent values between the first (25%) and third (75%) quartiles with a line at the median, and extending lines represent the maximum and minimum values not including outliers that are further than 1.5 times the interquartile range. Source Data
Extended Data Fig. 1
Extended Data Fig. 1. T. brucei parasites are found in interstitial tissue spaces.
Representative immunofluorescence images of tdTomato expressing parasites (red) from cross sections of perfused tissues stained with hoechst (blue) and anti-CD31 antibody (green). TdTomato-positive parasites localized separately from CD31 lined spaces, showing that parasites are extravascular. n = 3 biologically independent mice examined over three independent experiments. The scale bars represent 100 microns.
Extended Data Fig. 2
Extended Data Fig. 2. Comparison of VSG sequences expressed by parasites in the blood and tissues.
The similarity of VSGs detected in each tissue measured by bitscore, a sequence similarity metric normalized to the database size, allows for comparing tissue compartments with different numbers of total VSGs expressed in each tissue. No statistical significance was found.
Extended Data Fig. 3
Extended Data Fig. 3. Parasite load in blood and tissues.
(a) Parasitemia of 12 mice infected with AnTat1.1E T. brucei counted from tail blood by hemocytometer (“n.d.” = not detectable, limit of detection of 2.22 × 105 parasites/mL). (b) Estimated parasite load per gram of tissue using QPCR. tbZFP3 was used as the control and RNA from known quantities of parasites was used to make standard curves. (c) The approximate total number of parasites represented in each organ. This was calculated using the estimated number of parasites from QPCR and the recorded organ mass. For the blood and skin, it was assumed that each mouse had 1.5 mL of blood and 2.73 grams of skin e point over 2 independent experiments. (d) The qPCR standard curves used for each plate of samples. These were used to estimate the number of parasites represented in each tissue sample based on RNA from known parasite concentrations (cultured parasites counted using a hemocytometer). A linear regression model was used to examine correlation between standards, no adjustments for multiple comparisons were made. In boxplots, boxes represent values between the first (25%) and third (75%) quartiles with a line at the median, and extending lines represent the maximum and minimum values not including outliers that are further than 1.5 times the interquartile range. Source Data
Extended Data Fig. 4
Extended Data Fig. 4. Correlation of VSG counts with read mapping, parasite load, and PAD1 expression.
(a) A comparison of the number of reads successfully aligned in a sample and the number of VSGs observed. (b) A comparison of the total number of parasites and the number of VSGs found in each sample. (c) The correlation between PAD1 expression relative to the housekeeping gene tbZFP3 and the number of VSGs expressed at the population level for each sample. Error bands in the above panels represent the 95% confidence interval for predictions from a linear model. Linear regression models were used to calculate R2 and P values where noted without adjustments for multiple comparisons. Source Data
Extended Data Fig. 5
Extended Data Fig. 5. Single-cell sequencing analysis of VSG expression.
(a) The number of VSG open reading frames (ORFs) detected per cell by de novo assembly with the VSG-Seq pipeline. In this figure, all cells sequenced were evaluated for VSG ORF assembly without any filtering (1377 total cells had a de novo assembled VSG). (b) The number of EATRO1125 VSGs detected per single cell. Cells were evaluated for VSG expression only if they had at least 500 genes detected, 1000 gene UMI counts, 30 spike-in UMI counts, and 10 VSG UMI counts (1216 cells fit these criteria out of 2960 total sequenced cells). Only VSGs with >1 UMI count were considered for quantification of VSG expression. These filtering parameters were also applied to genomic mapping analyses in panels c and e. (c) Alignment to the EATRO1125 genome assembly was used to quantify the fraction of VSG UMI counts coming from the most abundant VSG gene within each cell. The dashed line represents the 0.8 fraction of total VSG UMI counts (80%) threshold set to define monogenic expression with one dominant VSG in a cell. (d) Representative histograms of coverage for reads from one cell. Read coverage is shown for the de novo assembled VSG cluster 59 and two genomic VSG ORFs, VSG-60 and VSG-72, which represent a common scenario that creates ambiguous VSG expression if reads are only aligned to the EATRO1125 genome. (e) The VSG expression classification for each cell using both alignment to the EATRO1125 genome and de novo assembly. In alignment and assembly, if a VSG represented 80% or more of the VSG UMI counts in a cell (for genomic mapping) or 80% of the population (for VSG-seq analysis), that cell was considered to be expressing only the dominant VSG. Source Data
Extended Data Fig. 6
Extended Data Fig. 6. General and VSG-specficic antibody levels during infection.
(a) Quantification of serum IgM and IgG concentrations in infected AID−/− and wildtype (WT) mice by ELISA (n = 2 biologically independent animals per group over one independent experiment). (b) AnTat1.1 EATRO cells (expressing VSG AnTat1.1) stained with serum, followed by an anti-IgG secondary antibody that cross-reacts with IgM and other isotypes, from day 6 and day 14 of two mice infected with AnTat1.1 Triple-marker cells. A polyclonal rabbit anti-AnTat1.1 antibody on cells known to be expressing AnTat1.1 was used as a positive control. (c) Single-marker cells (expressing VSG-2) stained with day 14 serum from two mice infected with AnTat1.1 Triple-marker cells. These were used as negative controls to show that serum from infected mice specifically binds AnTat1.1 and no other VSGs. Source Data
Extended Data Fig. 7
Extended Data Fig. 7. Flow cytometry and cell sorting gating strategies.
(a) Example gating strategy for flow cytometry experiments from Fig. 3. Samples were first gated for tdTomato-positive cells, which represent T. brucei parasites expressing tdTomato in their cytoplasm. Then live cells were gated based on live/dead Zombie AquaTM staining. Finally, quadrants were placed around AnTat1.1-A488 positive and negative cells. (b) Gating strategy for single-cell sorting into 384-well plates for the SL-Smart-seq3xpress platform. This example is from the blood of mouse 2. Singlet parasites were selected and then tdTomato positive, PI (propidium iodide) negative T. brucei cells were sorted into single wells.

References

    1. Magez, S. et al. The role of B-cells and IgM antibodies in parasitemia, anemia, and VSG switching in Trypanosoma brucei-infected mice. PLoS Pathog.4, e1000122 (2008). - PMC - PubMed
    1. Cross, G. A. M., Kim, H. S. & Wickstead, B. Capturing the variant surface glycoprotein repertoire (the VSGnome) of Trypanosoma brucei Lister 427. Mol. Biochem. Parasitol.195, 59–73 (2014). - PubMed
    1. Müller, L. S. M. et al. Genome organization and DNA accessibility control antigenic variation in trypanosomes. Nature563, 121–125 (2018). - PMC - PubMed
    1. Hertz-Fowler, C. et al. Telomeric expression sites are highly conserved in Trypanosoma brucei. PLoS ONE3, e3527 (2008). - PMC - PubMed
    1. Cosentino, R. O., Brink, B. G. & Nicolai Siegel, T. Allele-specific assembly of a eukaryotic genome corrects apparent frameshifts and reveals a lack of nonsense-mediated mRNA decay. NAR Genom. Bioinform.3, lqab082 (2021). - PMC - PubMed

MeSH terms

Substances