. 2025 Feb;24(2):e14388.
doi: 10.1111/acel.14388. Epub 2024 Oct 30.

Arginine metabolism is a biomarker of red blood cell and human aging

Affiliations

Arginine metabolism is a biomarker of red blood cell and human aging

Julie A Reisz et al. Aging Cell. 2025 Feb.

Abstract

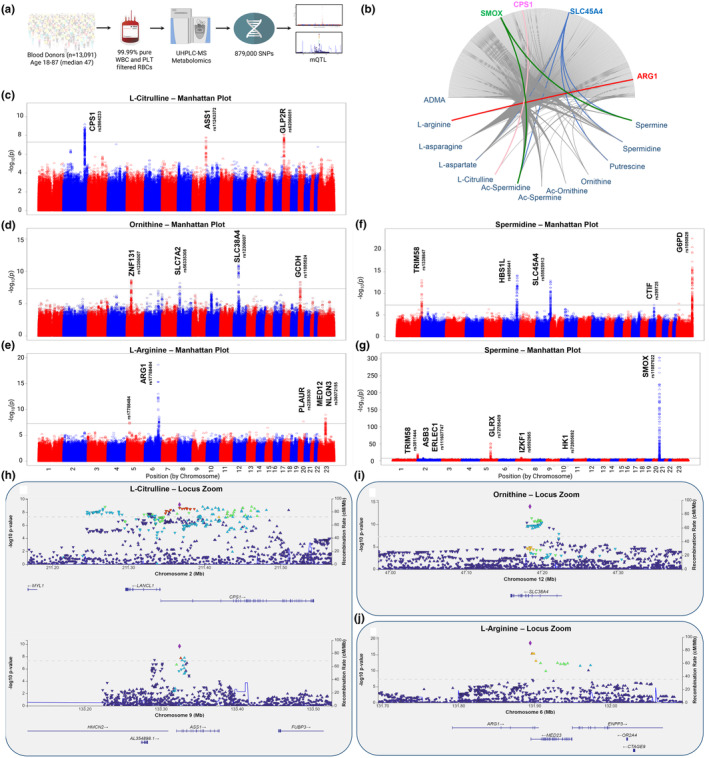
Increasing global life expectancy motivates investigations of molecular mechanisms of aging and age-related diseases. This study examines age-associated changes in red blood cells (RBCs), the most numerous host cell in humans. Four cohorts, including healthy individuals and patients with sickle cell disease, were analyzed to define age-dependent changes in RBC metabolism. Over 15,700 specimens from 13,757 humans were examined, a major expansion over previous studies of RBCs in aging. Multi-omics approaches identified chronological age-related alterations in the arginine pathway with increased arginine utilization in RBCs from older individuals. These changes were consistent across healthy and sickle cell disease cohorts and were influenced by genetic variation, sex, and body mass index. Integrating multi-omics data and metabolite quantitative trait loci (mQTL) in humans and 525 diversity outbred mice functionally linked metabolism of arginine during RBC storage to increased vesiculation-a hallmark of RBC aging-and lower post-transfusion hemoglobin increments. Thus, arginine metabolism is a biomarker of RBC and organismal aging, suggesting potential new targets for addressing sequelae of aging.

Keywords: arginine; citrulline; omics; organismal aging; quantitative trait loci; red blood cell metabolism.


Conflict of interest statement

The authors declare that AD, KCH, and TN are founders of Omix Technologies Inc. and Altis Biosciences LLC. AD and SLS are Scientific Advisory Board (SAB) members for Hemanext Inc. AD is a SAB member for Macopharma Inc. Dr. Gladwin is a co‐inventor of patents and patent applications directed to the use of recombinant neuroglobin and heme‐based molecules as antidotes for CO poisoning, which have been licensed by Globin Solutions, Inc. Dr. Gladwin is a shareholder, advisor, and director in Globin Solutions, Inc. Dr. Gladwin is also co‐inventor on patents directed to the use of nitrite salts in cardiovascular diseases, which were previously licensed to United Therapeutics, and now licensed to Globin Solutions and Hope Pharmaceuticals. Dr. Gladwin is an inventor on an unlicensed patent application directed at the use of nitrite for halogen gas poisoning and smoke inhalation. Dr. Gladwin was a principal investigator in a research collaboration with Bayer Pharmaceuticals to evaluate riociguate as a treatment for patients with SCD, which has concluded. Dr. Gladwin is a textbook author and receives royalties from MedMaster Inc., and is a textbook editor and receives royalties from McGraw‐Hill. All the other authors have no conflicts to disclose in relation to this study.

Figures

FIGURE 1
FIGURE 1
Arginine metabolites are impacted as a function of donor chronological age in red blood cells of healthy donors at 42 days of storage. (a) Overview of the index arm of the REDS study whereby 13,091 healthy individuals donated a unit of blood which was stored for 42 days and characterized by mass spectrometry (MS)‐based metabolomics. (b) Spearman correlation of RBC metabolite levels with donor chronological age following adjustment for sex and storage additive. (c) Relative levels of arginine pathway metabolites as a function of donor chronological age in the index donors. Lines represent median (dark blue) +/− quartile ranges (shaded gray). (d) Overview of arginine metabolism. ARG1, arginase 1; NOS, nitric oxide synthase; ODC, ornithine decarboxylase; OTC, ornithine transcarbamylase; ASS1, argininosuccinate synthetase 1; SMOX, spermine oxidase. (e) Overview of the recall arm of the REDS study in which the donors whose units represented the extremes of hemolytic propensity (at 42 days) donated a second unit which was sampled at Days 10, 23, and 42 of storage followed by MS metabolomics. (f) Spearman correlation of RBC metabolite levels with donor chronological age following adjustments for sex, storage additive, and storage day. (g) Relative levels of arginine pathway metabolites as a function of donor chronological age in the recall units independent of storage duration. Lines represent median (dark blue) +/− quartile ranges (shaded gray).
FIGURE 2
FIGURE 2
Arginine metabolites are impacted by donor chronological age in red blood cells of donors with anemia or sickle cell disease. (a) Overview of the DIDS study testing whether iron dextran improved the quality of stored units from donors with anemia from repeated donations. Units were sampled before and after the iron dextran course and profiled by mass spectrometry (MS)‐based metabolomics. (b) Spearman correlation of RBC metabolite levels with donor chronological age following adjustment for sex, donation time point, and intervention. (c) Relative levels of arginine pathway metabolites as a function of donor chronological age independent of storage time point. Lines represent median (dark blue) +/− quartile ranges (shaded gray). (d) Overview of the Walk‐PHaSST study of sickle cell disease followed by MS metabolomics. (e) Spearman correlation of RBC metabolite levels with patient chronological age following adjustments for sex and Hb genotype. (f) Relative levels of arginine pathway metabolites as a function of patient chronological age. Lines represent median (dark blue) +/− quartile ranges (shaded gray).
FIGURE 3
FIGURE 3
Donor biology impacts age‐related changes to RBC arginine metabolism. (a) Relative levels of arginine and its downstream metabolites in the REDS index cohort separated by sex. (b) Relative levels of arginine and its downstream metabolites in the REDS index cohort as a function of donor BMI. (c) Relative levels of arginine and its downstream metabolites in the REDS index cohort as a function of donor ethnicity. AFRAMRCN, African American; HISP1, Mexican and Central American Hispanic; HISP2, Caribbean Island Hispanic; EAS, East Asian; SAS, South Asian; OTHER, donors who self‐identified as Native Americans, Native Hawaiians, Native Alaskans, multiple races, or were from countries sparsely represented in this cohort such as Iran and the Philippines. (d) Raincloud plot of RBC citrulline levels highlighting the top and bottom 500 donors. (e–i) Representation among the donors with top and bottom 500 end‐of‐storage citrulline levels across storage additive (e), BMI (f), chronological age (g), sex (h), and ethnicity (i), each shown as a percentage of total for the 1000 donor subset identified in (d). AFR, African American; ASN, Asian; CAU, Caucasian; HISP, Hispanic. Data are presented as median +/− SEM. (j) Arginase 1 (ARG1) protein expression in RBCs in the REDS recall cohort as a function of sex and donor chronological age via mass spectrometry‐based proteomics.
FIGURE 4
FIGURE 4
Metabolite Quantitative Trait Loci (mQTL) analysis identifies genetic underpinnings associated with RBC arginine metabolism. (a) End‐of‐storage units from REDS index donors (n = 13,091) were profiled using a precision transfusion medicine array to monitor the frequency of 879,000 known single nucleotide polymorphisms which were correlated to metabolomics data using mQTL. (b) Circos plot highlighting key SNP–metabolite associations in the arginine pathway. (c–g) Manhattan plots of all significant hits (FDR p‐value < 5 × 10−8, black horizontal lines), including metabolite‐gene pairs. Each data point corresponds to a –log10(p) from a multivariant linear regression model p‐value for a given SNP. Manhattan plots are shown for (c) citrulline, (d) ornithine, (e) arginine, (f) spermidine, and (g) spermine. Selected locus zoom plots identify nearest coding regions to which identified SNPs map for (h) citrulline on chromosomes 2 (top) and 9 (bottom), (i) ornithine on chromosome 12, and (j) arginine on chromosome 6.
FIGURE 5
FIGURE 5
Arginine metabolism in fresh and stored murine RBCs (n = 525 animals). (a) Experimental overview of the generation of diversity outbred mice whose RBCs were characterized by multi‐omics approaches at Days 0 and 7 of storage. (b and c) Metabolite correlations (Spearman) to arginine levels in fresh (b) and stored (c) RBCs. Arginine pathway metabolites are highlighted in red. (d–g) Manhattan plots of metabolite–SNP associations in fresh RBCs from mice, highlighting arginine (d), ornithine (e), citrulline (f), and spermine (g). (h and i) Volcano plot illustrating the effects of sex on levels of arginine pathway metabolites (shown in red) in fresh (h) and stored (i) mouse RBCs. Blue shaded region indicates arginine metabolites increased in RBCs from males versus females; light red shaded region indicates arginine metabolites increased in RBCs from females versus males.
FIGURE 6
FIGURE 6
RBC arginine metabolism is associated with vesiculation and hemoglobin increments. (a) Vesicles were counted and single nucleotide polymorphisms (SNPs) were monitored in the REDS recall study for units from extreme hemolyzers (n = 643) sampled at Days 10, 23, and 42 of storage. Relative levels of arginine metabolites and vesicle counts are presented as a function of sex during the storage timecourse. Line colors: light blue for RBCs from males, light red for RBCs from females. (b) Spearman correlations of arginine pathway metabolites to storage duration and RBC functional outcomes (vesiculation, osmotic hemolysis, and oxidative hemolysis). Node color represents correlation coefficient (R); node size represents p‐value (larger node is smaller p‐value). (c) Vesicle counts as a function of donor sex and storage duration. (d) Manhattan plot of QTL associations with vesiculation implicates SNPs on VEPH1 and ARG1 with end‐of‐storage vesicle counts. (e) Spearman correlation of ARG1 multi‐omics correlates. (f) Heat map of top 100 features by linear discriminant analysis (LDA) of REDS recall cohort multi‐omics data at storage Days 10, 23, and 42 for the highest and lowest vesicle count units at each time point (n = 50 per vesiculation group). G‐H) Network analyses of top negative (i) and positive (j) correlates to ARG1. (i) Overview of vein‐to‐vein database for hemoglobin increments. (j) Adjusted delta hemoglobin levels (g/dL) at 24 h post single unit transfusion versus donor RBC arginine tertiles. Data for male donors are shown in blue, data for female donors are shown in pink. (k) Adjusted delta hemoglobin levels (g/dL) at 24 h post single unit transfusion versus donor RBC citrulline to arginine ratio tertiles for donors younger than age 50 and end‐of‐storage units. Data for male donors are shown in blue, data for female donors are shown in pink. (l) Adjusted delta hemoglobin levels (g/dL) at 24 h post single unit transfusion versus unit storage duration as a function of sex for donors younger than age 50.

Similar articles

Cited by

References

    1. Alsaleh, G. , Panse, I. , Swadling, L. , Zhang, H. , Richter, F. C. , Meyer, A. , Lord, J. , Barnes, E. , Klenerman, P. , Green, C. , & Simon, A. K. (2020). Autophagy in T cells from aged donors is maintained by spermidine and correlates with function and vaccine responses. eLife, 9, e57950. 10.7554/eLife.57950 - DOI - PMC - PubMed
    1. Atsma, F. , Veldhuizen, I. , Verbeek, A. , de Kort, W. , & de Vegt, F. (2011). Healthy donor effect: Its magnitude in health research among blood donors. Transfusion, 51(8), 1820–1828. 10.1111/j.1537-2995.2010.03055.x - DOI - PubMed
    1. Aulchenko, Y. S. , Struchalin, M. V. , & van Duijn, C. M. (2010). ProbABEL package for genome‐wide association analysis of imputed data. BMC Bioinformatics, 11(1), 134. 10.1186/1471-2105-11-134 - DOI - PMC - PubMed
    1. Bitan, Z. C. , Zhou, A. , McMahon, D. J. , Kessler, D. , Shaz, B. H. , Caccappolo, E. , Schwartz, J. , Francis, R. O. , Brittenham, G. M. , Spitalnik, S. L. , & Hod, E. A. (2019). Donor iron deficiency study (DIDS): Protocol of a study to test whether iron deficiency in blood donors affects red blood cell recovery after transfusion. Blood Transfusion, 17(4), 274–280. 10.2450/2019.0066-19 - DOI - PMC - PubMed
    1. Bizjak, D. A. , Brinkmann, C. , Bloch, W. , & Grau, M. (2015). Increase in red blood cell‐nitric oxide synthase dependent nitric oxide production during red blood cell aging in health and disease: A study on age dependent changes of Rheologic and enzymatic properties in red blood cells. PLoS One, 10(4), e0125206. 10.1371/journal.pone.0125206 - DOI - PMC - PubMed