. 2024 Oct 30;24(1):1032.
doi: 10.1186/s12870-024-05692-3.

Physiological phenotyping of transpiration response to vapour pressure deficit in wheat

Affiliations

Physiological phenotyping of transpiration response to vapour pressure deficit in wheat

Anna Moritz et al. BMC Plant Biol. .

Abstract

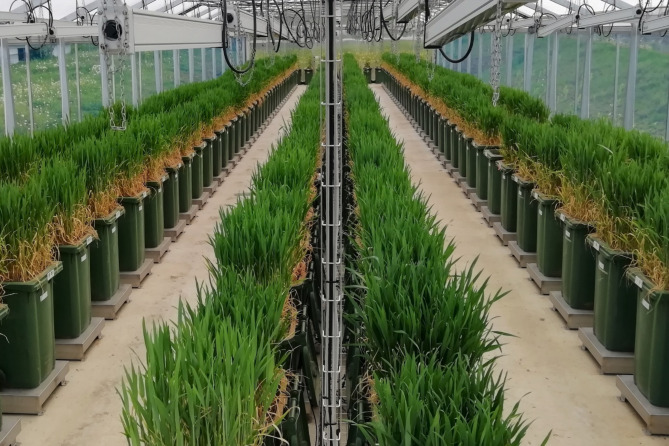
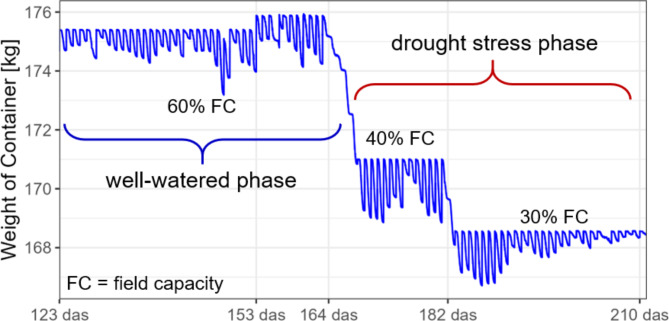
Background: Precision phenotyping of short-term transpiration response to environmental conditions and transpiration patterns throughout wheat development enables a better understanding of specific trait compositions that lead to improved transpiration efficiency. Transpiration and related traits were evaluated in a set of 79 winter wheat lines using the custom-built "DroughtSpotter XXL" facility. The 120 l plant growth containers implemented in this phenotyping platform enable gravimetric quantification of water use in real-time under semi-controlled, yet field-like conditions across the entire crop life cycle.

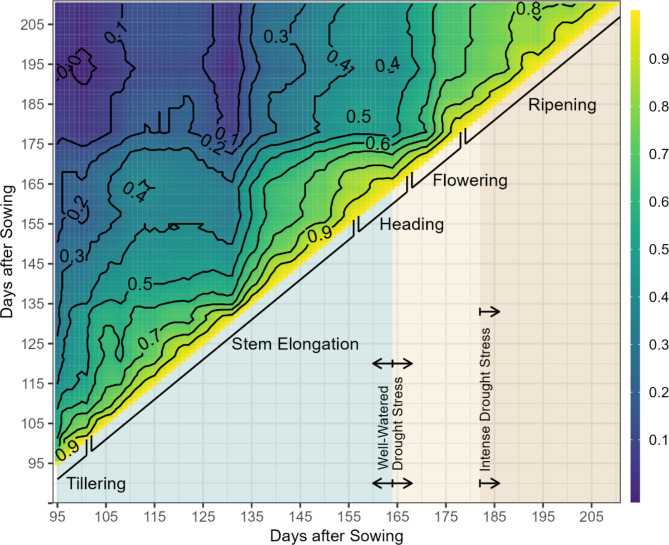
Results: The resulting high-resolution data enabled identification of significant developmental stage-specific variation for genotype rankings in transpiration efficiency. In addition, for all examined genotypes we identified the genotype-specific breakpoint in transpiration in response to increasing vapour pressure deficit, with breakpoints ranging between 2.75 and 4.1 kPa.

Conclusion: Continuous monitoring of transpiration efficiency and diurnal transpiration patterns enables identification of hidden, heritable genotypic variation for transpiration traits relevant for wheat under drought stress. Since the unique experimental setup mimics field-like growth conditions, the results of this study have good transferability to field conditions.

Keywords: Drought stress; High-throughput phenotyping; Transpiration restriction; Vapour pressure deficit; Water use efficiency; Wheat.


Conflict of interest statement

The authors declare no competing interests.

Figures

Fig. 1
Fig. 1
DroughtSpotter XXL precision phenotyping platform. The facility comprises 240 high-resolution gravimetric scales on which containers with a soil volume of 120 l and a depth of 90 cm are placed. Transpiration is monitored gravimetrically in 5-minute intervals over the entire lifecycle of the crop. The facility is situated inside of a greenhouse with open walls
Fig. 2
Fig. 2
Irrigation scheme for the container trial. The container weight of a single container is displayed for the period between 123 days after sowing (das) and 210 das. Every day after midnight, the container was irrigated up to a predefined target weight, resulting in a rapid increase in container weight. Over the course of the day the plants transpired water, resulting in a gradual decrease of the container weight. At 164 das drought stress was applied by reducing field capacity to 40% and at 182 das drought stress conditions were intensified by setting field capacity to 30%
Fig. 3
Fig. 3
Kendall rank correlation for developmental-stage specific transpiration efficiency. The upper triangle shows the Kendall rank correlation coefficients for adjusted mean values between developmental-stage specific transpiration efficiency from 95 up to 211 days after sowing, with blue colours for weak correlations and yellow colours for strong correlations. The lower triangle provides information on developmental stages and drought stress conditions
Fig. 4
Fig. 4
Relationship between transpiration rate and VPD. To demonstrate, the TR response to VPD is visualised for one container on 11 June 2021. TR is plotted against ambient VPD in the DroughtSpotter XXL facility. A linear segmented regression was applied to understand the relationship between transpiration rate and VPD. The vertical dashed line indicates the breakpoint
Fig. 5
Fig. 5
Transpiration response to varying VPD in a set of 79 winter wheat lines tested in the DroughtSpotter XXL. Data show adjusted mean values. The blue vertical line indicates the LSD calculated on a significance level of 10%. The horizontal solid line shows the mean values across all genotypes, the dashed horizontal lines show ± 1SD. (a) shows genotypic variation for the breakpoint, (b) shows genotypic variation for Slope 1, (c) shows genotypic variation for Slope 2 and (d) shows genotypic variation for ∆Slope
Fig. 6
Fig. 6
(a) Green leaf index (GLI) and (b) normalized difference vegetation index (NDVI) on the day of drought stress (ds) application (0d after ds), seven days after drought stress application (7d after ds), 14 days after drought stress application (14d after ds), 23 days after drought stress application (23d after ds) and 30 days after drought stress application (30d after ds). The letters above the boxplots indicate significant (p < 0.05) differences between mean values. When the mean values are significantly different, the letters indicate the highest to lowest mean value in alphabetical order

Similar articles

References

    1. IPPC. Climate Change 2022: Mitigation of Climate Change. Contribution of Working Group III to the Sixth Assessment Report of the Intergovernmental Panel on Climate Change. 2022.
    1. Lobell DB, Hammer GL, McLean G, Messina C, Roberts MJ, Schlenker W. The critical role of extreme heat for maize production in the United States. Nat Clim Change. 2013;3(5):497–501.
    1. Snowdon RJ, Wittkop B, Chen TW, Stahl A. Crop adaptation to climate change as a consequence of long-term breeding. Theor Appl Genet. 2021;134(6):1613–23. - PMC - PubMed
    1. Tardieu F. Any trait or trait-related allele can confer drought tolerance: just design the right drought scenario. J Exp Bot. 2012;63(1):25–31. - PubMed
    1. Vadez V, Kholova J, Medina S, Kakkera A, Anderberg H. Transpiration efficiency: new insights into an old story. J Exp Bot. 2014;65(21):6141–53. - PubMed

LinkOut - more resources