. 2024 Oct 31;24(1):423.
doi: 10.1186/s12883-024-03926-3.

Quantitative proteomics and multi-omics analysis identifies potential biomarkers and the underlying pathological molecular networks in Chinese patients with multiple sclerosis

Affiliations

Quantitative proteomics and multi-omics analysis identifies potential biomarkers and the underlying pathological molecular networks in Chinese patients with multiple sclerosis

Fan Yang et al. BMC Neurol. .

Abstract

Multiple sclerosis (MS) is an autoimmune disorder caused by chronic inflammatory reactions in the central nervous system. Currently, little is known about the changes of plasma proteomic profiles in Chinese patients with MS (CpwMS) and its relationship with the altered profiles of multi-omics such as metabolomics and gut microbiome, as well as potential molecular networks that underlie the etiology of MS. To uncover the characteristics of proteomics landscape and potential multi-omics interaction networks in CpwMS, Plasma samples were collected from 22 CpwMS and 22 healthy controls (HCs) and analyzed using a Tandem Mass Tag (TMT)-based quantitative proteomics approach. Our results showed that the plasma proteomics pattern was significantly different in CpwMS compared to HCs. A total of 90 differentially expressed proteins (DEPs), such as LAMP1 and FCG2A, were identified in CpwMS plasma comparing to HCs. Furthermore, we also observed extensive and significant correlations between the altered proteomic profiles and the changes of metabolome, gut microbiome, as well as altered immunoinflammatory responses in MS-affected patients. For instance, the level of LAMP1 and ERN1 were significantly and positively correlated with the concentrations of metabolite L-glutamic acid and pro-inflammatory factor IL-17 (Padj < 0.05). However, they were negatively correlated with the amounts of other metabolites such as L-tyrosine and sphingosine 1-phosphate, as well as the concentrations of IL-8 and MIP-1α. This study outlined the underlying multi-omics integrated mechanisms that might regulate peripheral immunoinflammatory responses and MS progression. These findings are potentially helpful for developing new assisting diagnostic biomarker and therapeutic strategies for MS.

Keywords: Differentially expressed protein; Gut microbiome; Immunoinflammatory response; Metabolic profile; Multi-omics interaction networks; Multiple sclerosis; Potential biomarker; Proteomics.


Conflict of interest statement

The authors declare no competing interests.

Figures
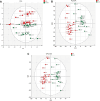
Fig. 1
Fig. 1
PCA, PLS-DA, and OPLS-DA models for separating MS-affected patients and healthy controls. (A) PCA plot. (B) PLS-DA plot. The model interpretability of X and Y variable datasets was R2X = 0.569 and R2Y = 0.994, respectively, model predictability Q2 = 0.918.(C) OPLS-DA plot. The model interpretability of X and Y variable datasets was R2X = 0.364 and R2Y = 0.874, respectively, model predictability Q2 = 0.823
Fig. 2
Fig. 2
Identification of 90 differentially expressed proteins and its overlaps shared with known MS-related DEGs. (A) Volcano plot of all DEPs. P value < 0.05 and fold change (MS/controls) > 2.0 or < 0.5. The maximum and minimum of Log2(FC) were 10.000 and − 10.000, respectively. The maximum of -Log10(P value) was set at 10.000. (B) Heatmap plot of all DEPs. Case group: MS 01–22, control group: Con 01–22. The red and green denote up- and down-regulation, respectively. (C-F) Overlapping genes/proteins shared by our DEPs and MS-related DEGs reported in different studies. The gene shown in bold represents that the gene has been identified as signature associated with MS in at least three separate studies
Fig. 3
Fig. 3
The most significant differentially expressed proteins in MS plasma. The levels of 10 top-ranking DEPs, including KVD11, KV311, ITA8, HPSE, TRFL, PF4V, S2A4R, MUCB, VNN1, and LTBP1 in the plasma samples of 22 MS-affected patients and 22 healthy controls. T-test was used to compare samples from the two groups. The Benjamini-Hochberg approach was used to correct P value and obtain adjusted P (Padj) value. *Padj < 0.05, **Padj < 0.01, ***Padj < 0.001
Fig. 4
Fig. 4
Unsupervised ML analysis of potential molecules for distinguishing MS samples from healthy controls. The area under curve (AUC), specificity, and sensitivity value of various combination of differentially expressed proteins and metabolites, including L-Glutamic acid and RNAS4 (A), L-Tryptophan and GLYL1 (B), Sphinganine 1-phosphate and GLYL2 (C), L-Phenylalanine and TIAM1 (D), L-Phenylalanine and FCG3A (E), Isocitric acid and ITPR2 (F), Nicotinuric acid and FCG2A (G), Phytosphingosine and EGLN (H), and N-acetyl-L-aspartic acid and GLYL2 (I), in distinguishing MS patients and healthy controls
Fig. 5
Fig. 5
Functional enrichment analysis of all differentially expressed proteins. (A) Dot plot of significantly enriched biological processes of all DEPs. (B) The most top-ranking cellular compartments among all DEPs. (C) The bar graph of enriched molecular functions of all DEPs. (D) and (E) KEGG pathway enrichment analysis of the up-regulated and down-regulated DEPs, respectively
Fig. 6
Fig. 6
Significant correlation between DEPs and abundantly differential metabolites in MS-affected patients. The heatmap was plotted by using Pearson’s correlation analysis. The correlation coefficient was visualized by red and green, which denote positive and negative correlations, respectively. Asterisks represent significant correlations. The Benjamini-Hochberg method was used to correct P value. *Padj < 0.05, **Padj < 0.01, ***Padj < 0.001
Fig. 7
Fig. 7
Levels of LAMP1, ERN1, FLNA, and FCG2A significantly correlated with the abundances of differential metabolites. Correlations between the level of LAMP1 (A), ERN1 (B), FLNA (C) and the levels of L-glutamic acid, L-tyrosine, sphingosine 1-phosphate, sphinganine 1-phosphate, and myo-inositol. (D) Correlation between the levels of FCG2A and the levels of methyl jasmonate, 17a-estradiol, L-isoleucine, sphingosine 1-phosphate, and sphinganine 1-phosphate. Pearson’s correlation (r) and probability (p) were used to evaluate the statistical importance. 95% confidence interval (CI) was indicated by the gray area surrounding blue straight line
Fig. 8
Fig. 8
Significant correlation between DEPs and differentially expressed cytokines and chemokines in MS-affected patients. The heatmap was plotted by using Pearson’s correlation analysis. The correlation coefficient was visualized by red and green, which denoting positive and negative correlations, respectively. Asterisks represent significant correlations. The Benjamini-Hochberg method was used to correct P value. *Padj < 0.05, **Padj < 0.01, ***Padj < 0.001
Fig. 9
Fig. 9
Levels of LAMP1, ERN1, FLNA, and FCG2A significantly correlated with pro- and anti-inflammatory factors concentrations. (A) Correlations between the level of LAMP1 and the concentrations of IL-17, IL-8, MCP-1, MIP-1α, and IL-12. (B) Correlations between the levels of ERN1 and the levels of IL-17, IL-8, MIP-1α, IFN-γ, and IL-12. (C) Associations between the content of FLNA and the amounts of TNF-α, IL-7, IL-8, IL-12, and MIP-1β. (D) Interactions between the amount of FCG2A and the levels of IL-17, TNF-α, IL-7, IL-8, and MIP-1α. Pearson’s correlation (r) and probability (p) were used for evaluating the statistical importance. 95% confidence interval (CI) was suggested by the gray area surrounding blue straight line
Fig. 10
Fig. 10
Significant correlation between DEPs and abundantly differential gut microbial species in MS-affected patients. The heatmap was plotted by using Pearson’s correlation analysis. The correlation coefficient was visualized by red and green, denoting positive and negative correlations, respectively. Asterisks represent significant correlations. The Benjamini-Hochberg method was used to correct P value. *Padj < 0.05, **Padj < 0.01, ***Padj < 0.001

Similar articles

Cited by

References

    1. Reich DS, Lucchinetti CF, Calabresi PA. Multiple Scler N Engl J Med. 2018;378(2):169–80. - PMC - PubMed
    1. Yong H, Chartier G, Quandt J. Modulating inflammation and neuroprotection in multiple sclerosis. J Neurosci Res. 2018;96(6):927–50. - PubMed
    1. Sospedra M, Martin R. Immunology of multiple sclerosis. Annu Rev Immunol. 2005;23:683–747. - PubMed
    1. Walton C, et al. Rising prevalence of multiple sclerosis worldwide: insights from the Atlas of MS, third edition. Mult Scler. 2020;26(14):1816–21. - PMC - PubMed
    1. das Neves SP, et al. Altered astrocytic function in experimental neuroinflammation and multiple sclerosis. Glia. 2021;69(6):1341–68. - PubMed

LinkOut - more resources