. 2024 Oct 30;25(1):393.
doi: 10.1186/s12931-024-03006-7.

Quantitative micro-CT-derived biomarkers elucidate age-related lung fibrosis in elder mice

Affiliations

Quantitative micro-CT-derived biomarkers elucidate age-related lung fibrosis in elder mice

Davide Buseghin et al. Respir Res. .

Abstract

Background: Idiopathic Pulmonary Fibrosis (IPF), prevalently affecting individuals over 60 years of age, has been mainly studied in young mouse models. The limited efficacy of current treatments underscores the need for animal models that better mimic an aged patient population. We addressed this by inducing pulmonary fibrosis in aged mice, using longitudinal micro-CT imaging as primary readout, with special attention to animal welfare.

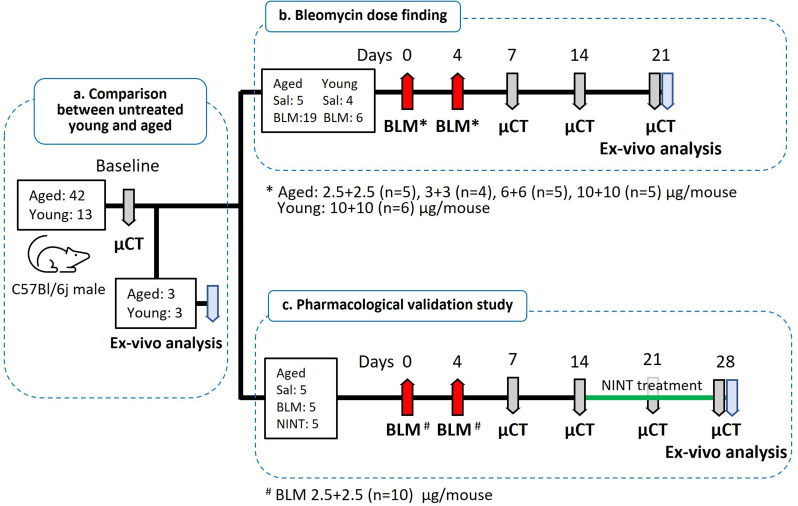
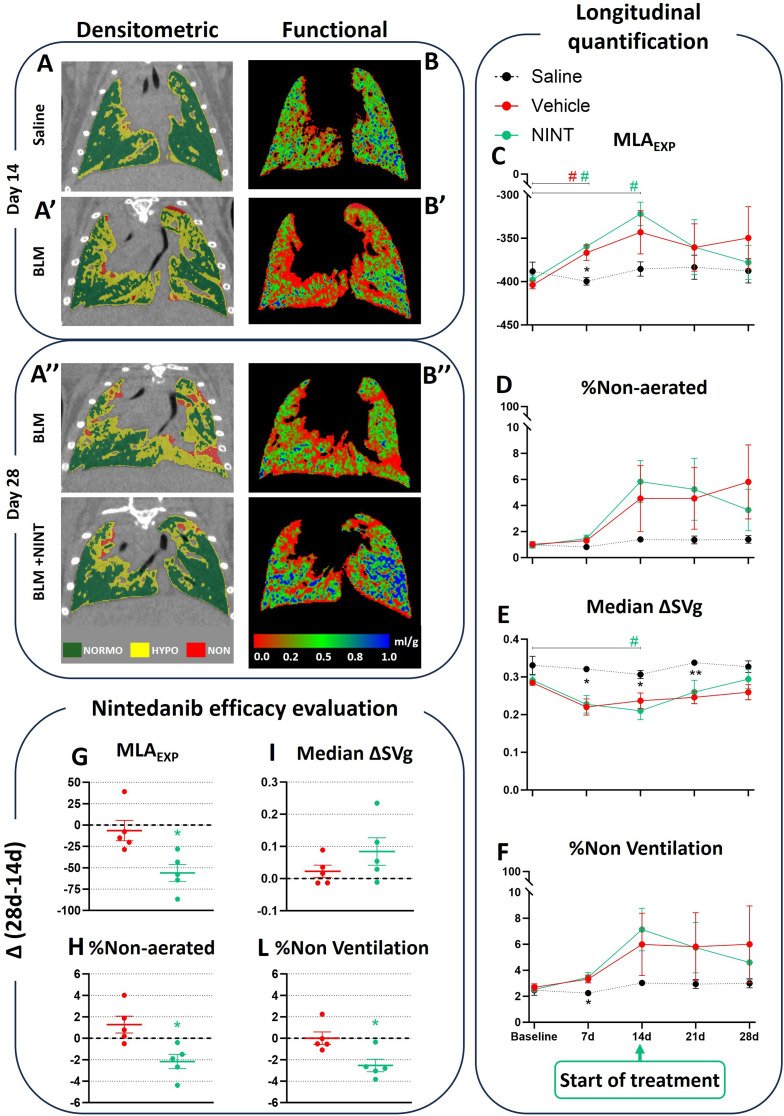
Methods: A double bleomycin dose was administered to 18-24 months-old male C57Bl/6j mice to induce pulmonary fibrosis. Bleomycin dosage was reduced to as low as 75% compared to that commonly administered to young (8-12 weeks-old) mice, resulting in long-term lung fibrosis without mortality, complying with animal welfare guidelines. After fibrosis induction, animals received Nintedanib once-daily for two weeks and longitudinally monitored by micro-CT, which provided structural and functional biomarkers, followed by post-mortem histological analysis as terminal endpoint.

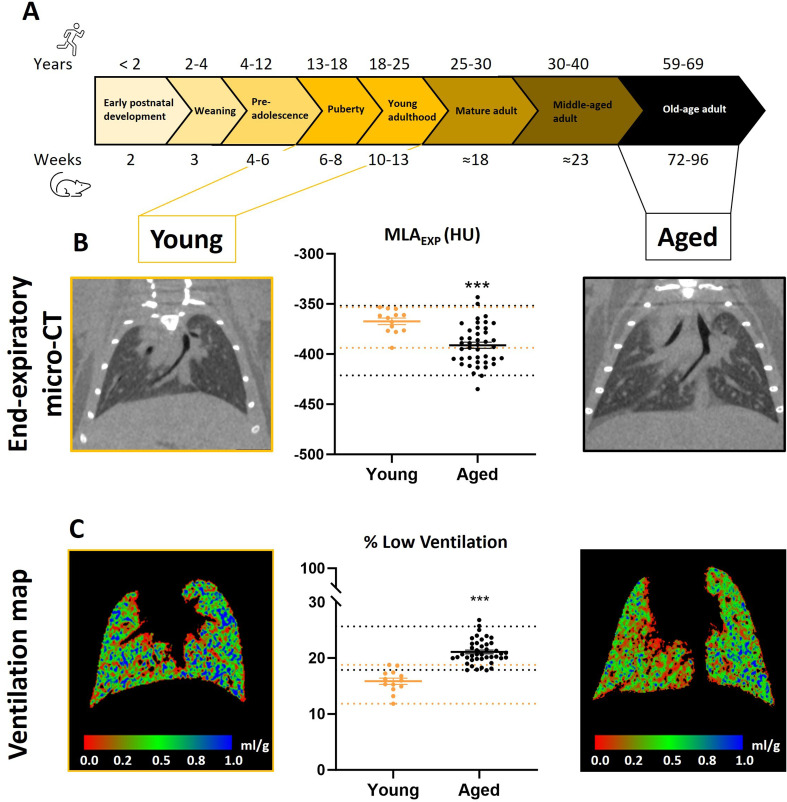
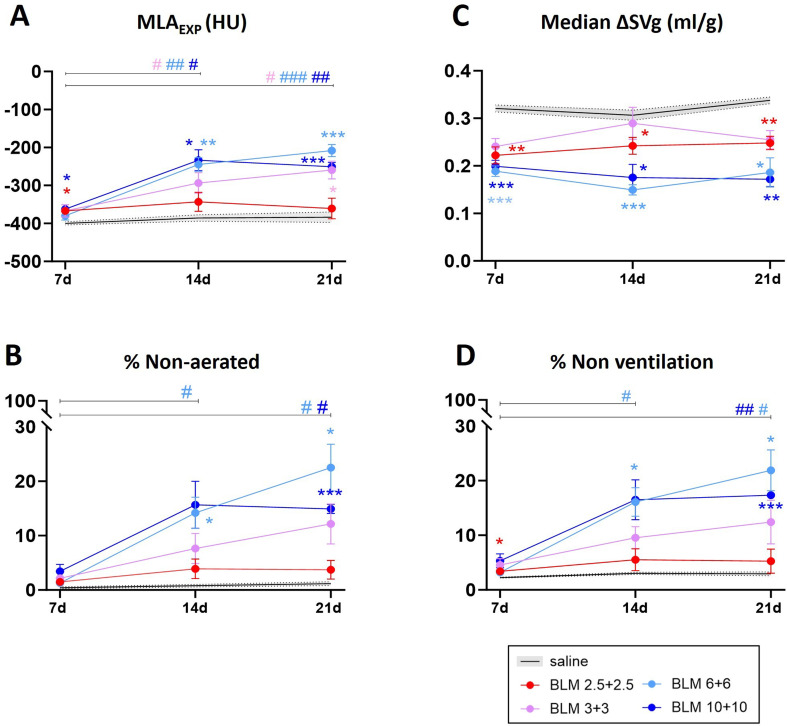
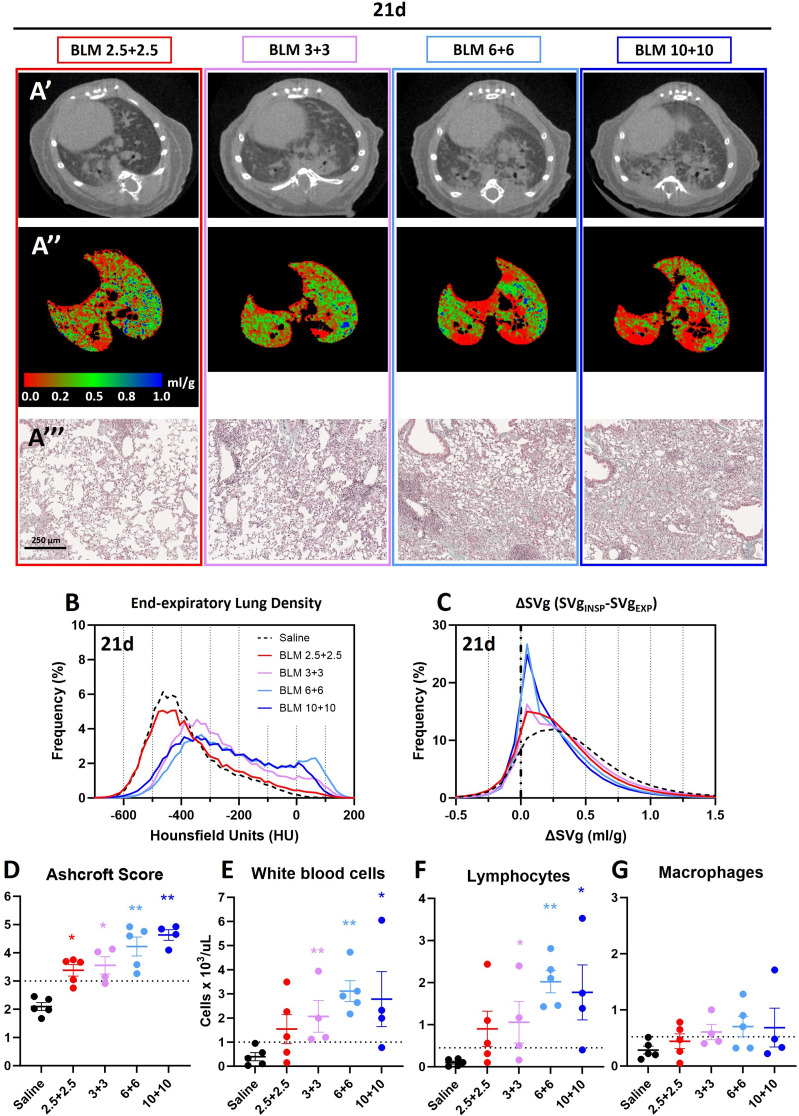
Results: Compared to young mice, aged animals displayed increased volume, reduced tissue density and function, and marked inflammation. This increased vulnerability imposed a bleomycin dosage reduction to the lowest tested level (2.5 µg/mouse), inducing a milder, yet persistent, fibrosis, while preserving animal welfare. Nintedanib treatment reduced fibrotic lesions and improved pulmonary function.

Conclusions: Our data identify a downsized bleomycin treatment that allows to achieve the best trade-off between fibrosis induction and animal welfare, a requirement for antifibrotic drug testing in aged lungs. Nintedanib displayed significant efficacy in this lower-severity disease model, suggesting potential patient stratification strategies. Lung pathology was quantitatively assessed by micro-CT, pointing to the value of longitudinal endpoints in clinical trials.

Keywords: Age; Bleomycin model; IPF; Lung fibrosis; Micro-computed tomography; Nintedanib.


Conflict of interest statement

FFS, AG, EF and GV are employees of Chiesi Farmaceutici S.p.A., that supported the research work. The remaining authors declare that the research was conducted in the absence of any commercial or financial relationships that could be construed as a potential conflict of interest.

Figures

Fig. 1
Fig. 1
Experimental protocol and dose finding scale down. Schematic representation of the experimental protocol. (a) Comparison between untreated young and aged mice: 55 C57Bl/6j male mice underwent micro-CT at baseline (42 aged and 13 young). 6 animals were sacrificed for histological evaluation. (b) Bleomycin- (BLM) dose finding study: 34 mice were treated on day 0 and 4 either with saline (n = 5 aged and n = 4 young) or varying doses of BLM (n = 19 aged and n = 6 young) by oropharyngeal administration. Mice underwent micro-CT on day 7, 14 and 21 and sacrificed for histological evaluation at the end of the study. (c) Pharmacological validation study: 15 aged mice were treated on day 0 and 4 either with saline (n = 5) or BLM (n = 10). On day 14, BLM-treated mice were randomized to be treated with Nintedanib (n = 5) or vehicle (n = 5). Micro-CT was performed on day 7, 14, 21 and 28 and sacrificed for histological evaluation at the end of the study
Fig. 2
Fig. 2
Comparison between sham young and aged mice. (A) Timeline that compares the years of human life to the weeks of mouse life at each stage of development. (B) Representative coronal micro-CT images at end-expiration for young (left) and aged (right) mice. Centrally, a scatter plot illustrating mean lung attenuation at end-expiration (MLAEXP) of young (yellow) and aged (back) sham mice. (C) Representative coronal ventilation images (indicating changes in specific gas volume, ΔSVg) for the two mice reported in (B). Colormap range goes from red (ΔSVg = 0 ml/g) to blue (ΔSVg = 1 ml/g). In the center, the percent extent of low-ventilated lung volume (%Low Ventilation) is presented as a scatter plot for the two groups. For both MLAEXP and %Low vent, the mean ± SEM is reported on the graphs and dotted lines represent 5th and 95th percentiles for each group. Statistical significance between groups was assessed by unpaired Student’s t-test (*p < 0.05; **p < 0.01; ***p < 0.001)
Fig. 3
Fig. 3
Bleomycin dose finding experiment: longitudinal densitometric and functional micro-CT derived biomarkers. (A-D) Densitometric (MLAEXP and %Non-aerated) and functional (median ΔSVg and %Non Ventilation) parameters derived from micro-CT presented longitudinally on day 7, 14 and 21 for aged saline (black), BLM 10 + 10 (blue), BLM 6 + 6 (light blue), BLM 3 + 3 (pink) and BLM 2.5 + 2.5 (red). Data are shown as mean ± SEM. Statistical significance with respect to saline was calculated by two-way ANOVA followed by Dunnett’s t post-hoc test (*p < 0.05; **p < 0.01; ***p < 0.001 vs. saline group); statistical significance with respect to day 7 was calculated by two-way ANOVA followed by Šidák post-hoc test (#p < 0.05; ##p < 0.01; ### p < 0.001 0d vs. 7d). MLAEXP, end-expiratory mean lung attenuation; %Non-aerated, percent extent of non-aerated lung volume; Median ΔSVg, median value of specific gas volume change between the inspiration and expiration; %Non-Ventilation, percent extent of non-ventilated lung volume
Fig. 4
Fig. 4
Bleomycin dose finding experiment: end-of-study evaluations. For all BLM-treated groups representative axial micro-CT slices at end-expiration (A’), ventilation maps (inspiratory-expiratory specific gas volume change, ΔSVg) displayed from 0 to 1 ml/g (A’’), and lung sections (10x magnification, scale bar: 250 μm) stained with Masson’s Trichrome (A’’’) are reported at day 21. From left to right BLM dose increased. (B) Mean probability distribution histograms of end-expiratory lung density (Hounsfield Units, HU) and (C) ΔSVg on day 21 for the overall group of saline (black, dashed line), BLM 10 + 10 (blue, solid line), BLM 6 + 6 (light blue, solid), BLM 3 + 3 (pink, solid) and BLM 2.5 + 2.5 (red, solid). (D) Ashcroft score, (E) Bronchoalveolar Lavage Fluid levels of total White Blood Cells, (F) Lymphocytes and (G) Macrophages are reported individually and as mean ± SEM for each group. Statistical analysis was performed by Fischer’s exact test (*p < 0.05, **p < 0.01, ***p < 0.001 vs. saline); the dotted line represents the threshold level utilized for the classification. Additionally, Fischer’s exact test was used to compare young and aged saline groups observing significant difference in Ashcroft score (Ashcroft Score about 1 and 2, respectively, p = 0.048)
Fig. 5
Fig. 5
Pharmacological validation study: longitudinal densitometric and functional micro-CT derived biomarkers. (A) Representative coronal micro-CT slices with overlaid aeration compartments at the commencement (day 14) of treatment for saline (A) and vehicle (BLM, A’) and at its conclusion (day 28) for vehicle (BLM, A’’ middle) and Nintedanib-treated (BLM + NINT, A’’ bottom) mice. The aeration compartments are color-coded: green for Normo-aerated (Normo), yellow for Hypo-aerated (Hypo), and red for Non-aerated (Non). (B) Maps of inspiratory-expiratory specific gas volume change (ΔSVg = SVgINSP-SVgEXP) for the same mice depicted in A-A’’. The range of display is from 0 to 1 ml/g. (C) Mean lung density at end-expiration (MLAEXP), (D) percent extent of non-aerated compartment (%Non-aerated), (E) Median ΔSVg and (F) percent extent of non-ventilated lung parenchyma (%Non-ventilation) were presented longitudinally with mean ± SEM at baseline, 7, 14, 21, and 28 days for saline, Vehicle and NINT groups. Statistical significance with respect to Vehicle was calculated by two-way ANOVA followed by Dunnett’s t post-hoc test (*p < 0.05; **p < 0.01; ***p < 0.001 vs. Vehicle group); statistical significance with respect to baseline was calculated by two-way ANOVA followed by Šidák post-hoc test (#p < 0.05; ##p < 0.01; ### p < 0.001 0d vs. baseline). (G-L) Same parameters of C-F were, also, presented as difference between end and start of the treatment (28d – 14d) for Vehicle and NINT groups and reported as individual data and mean ± SEM for each group. Statistical significance is determined by Fisher’s exact test in order to compare Vehicle with NINT group (*p < 0.05); the dotted line represents the threshold level utilized for the classification
Fig. 6
Fig. 6
Pharmacological validation study: end-of-study evaluations. (A’) Representative axial micro-CT slices at end-expiration, (A’’) ventilation maps (inspiratory-expiratory specific gas volume change, ΔSVg = SVgINSP-SVgEXP) displayed from 0 to 1 ml/g (A’’’) and lung sections (10x magnification, scale bar: 250 μm) stained with Masson’s Trichrome in Vehicle (BLM 2.5 + 2.5) and Nintedanib-treated (NINT) groups, at the end of the study. (C) Mean ± SD probability distribution histograms of end-expiratory lung density and (D) ΔSVg on day 28 for saline, BLM 2.5 + 2.5 and NINT groups. (E) Ashcroft score, (F) Bronchoalveolar Lavage Fluid levels of total White Blood Cells, (G) Lymphocytes and (H) Macrophages are reported individually and as mean ± SEM for each group. In each graph, individual data and mean ± SEM for each group are reported. Statistical analysis is determined using Fisher exact test (*p < 0.05 vs. Vehicle); the dotted line represents the threshold level utilized for the classification

Similar articles

Cited by

References

    1. Raghu G, Remy-Jardin M, Myers JL, Richeldi L, Ryerson CJ, Lederer DJ, et al. Diagnosis of idiopathic pulmonary fibrosis. An Official ATS/ERS/JRS/ALAT Clinical Practice Guideline. Am J Respir Crit Care Med. 2018;198:e44–68. - PubMed
    1. Podolanczuk AJ, Thomson CC, Remy-Jardin M, Richeldi L, Martinez FJ, Kolb M, et al. Idiopathic pulmonary fibrosis: state of the art for 2023. Eur Respir J. 2023;61:2200957. - PubMed
    1. Trachalaki A, Irfan M, Wells AU. Pharmacological management of idiopathic pulmonary fibrosis: current and emerging options. Expert Opin Pharmacother. 2021;22:191–204. - PubMed
    1. Raghu G, Richeldi L, Fernández Pérez ER, De Salvo MC, Silva RS, Song JW et al. Pamrevlumab for Idiopathic Pulmonary Fibrosis: the ZEPHYRUS-1 Randomized Clinical Trial. JAMA Published Online May 19, 2024. - PMC - PubMed
    1. Maher TM, Ford P, Brown KK, Costabel U, Cottin V, Danoff SK, et al. Ziritaxestat, a novel autotaxin inhibitor, and lung function in idiopathic pulmonary fibrosis: the ISABELA 1 and 2 randomized clinical trials. JAMA. 2023;329:1567–78. - PMC - PubMed

MeSH terms

LinkOut - more resources