. 2024 Oct 31;19(1):81.
doi: 10.1186/s40793-024-00626-w.

Arctic's hidden hydrocarbon degradation microbes: investigating the effects of hydrocarbon contamination, biostimulation, and a surface washing agent on microbial communities and hydrocarbon biodegradation pathways in high-Arctic beaches

Affiliations

Arctic's hidden hydrocarbon degradation microbes: investigating the effects of hydrocarbon contamination, biostimulation, and a surface washing agent on microbial communities and hydrocarbon biodegradation pathways in high-Arctic beaches

Ya-Jou Chen et al. Environ Microbiome. .

Abstract

Background: Canadian Arctic summer sea ice has dramatically declined due to global warming, resulting in the rapid opening of the Northwest Passage (NWP), slated to be a major shipping route connecting the Atlantic and Pacific Oceans by 2040. This development elevates the risk of oil spills in Arctic regions, prompting growing concerns over the remediation and minimizing the impact on affected shorelines.

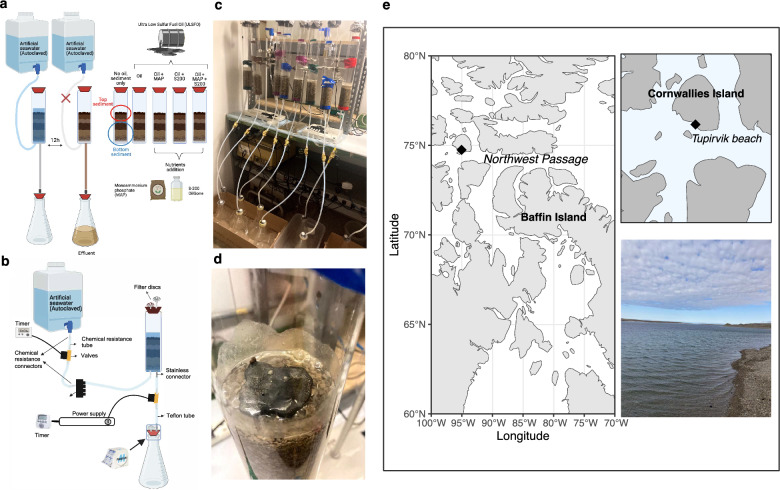
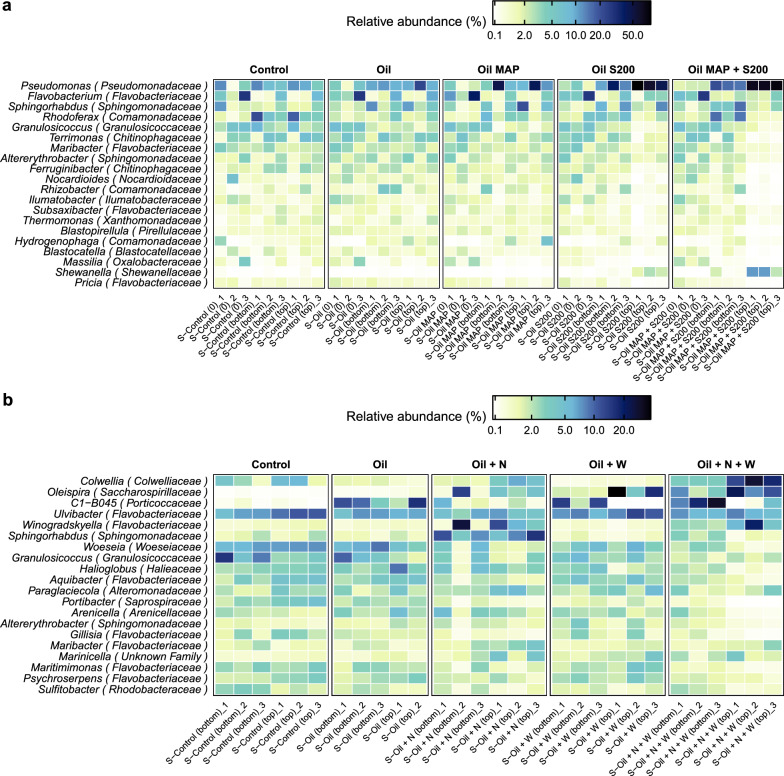
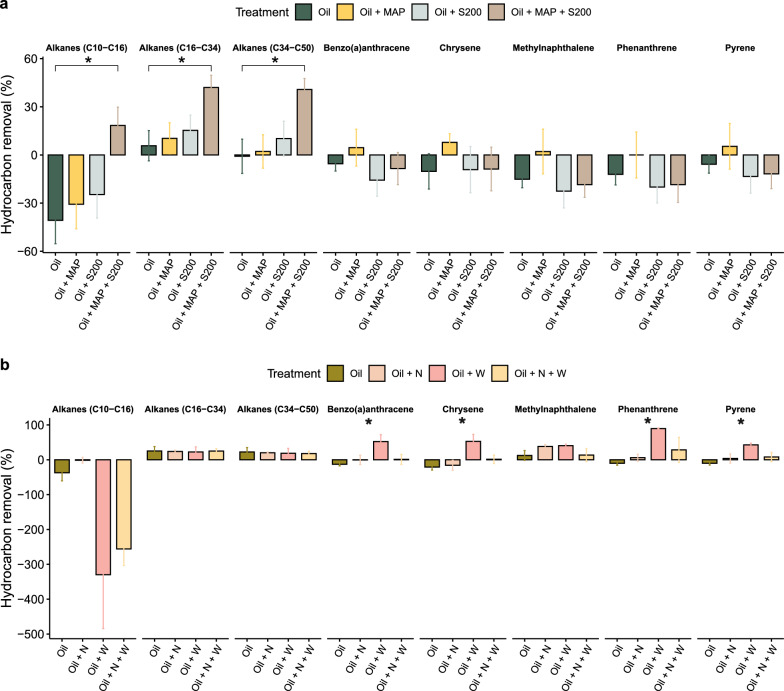
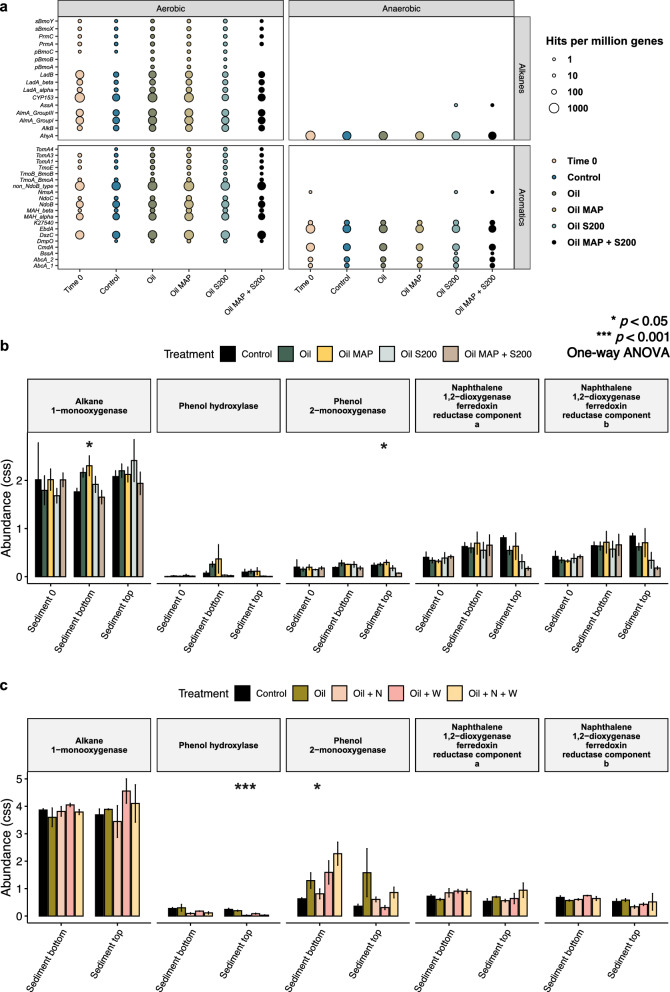
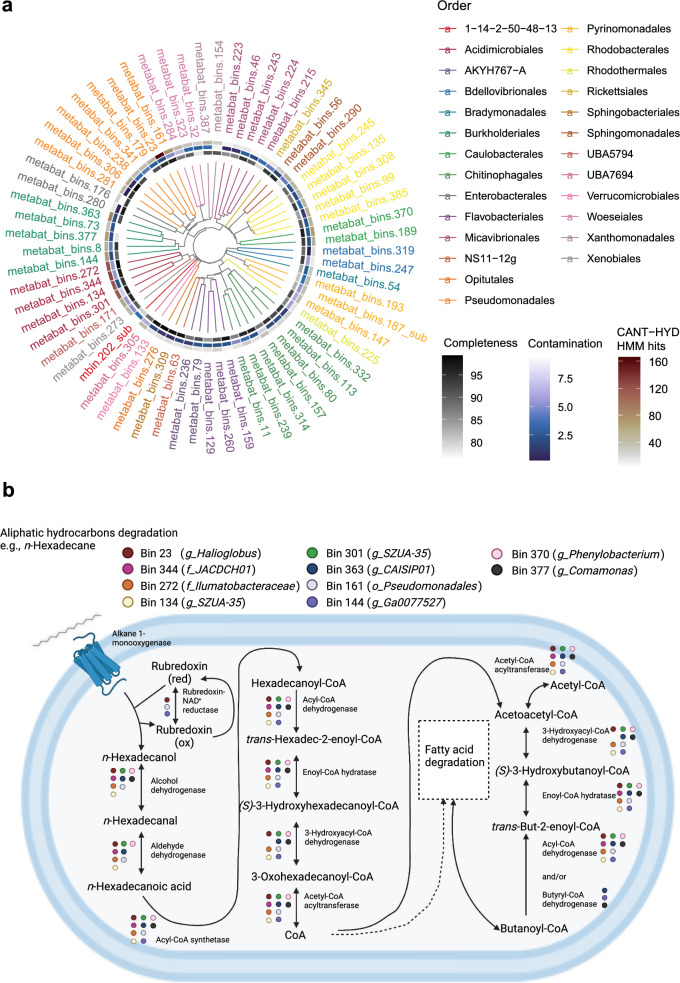
Results: This research aims to assess the viability of nutrient and a surface washing agent addition as potential bioremediation methods for Arctic beaches. To achieve this goal, we conducted two semi-automated mesocosm experiments simulating hydrocarbon contamination in high-Arctic beach tidal sediments: a 32-day experiment at 8 °C and a 92-day experiment at 4 °C. We analyzed the effects of hydrocarbon contamination, biostimulation, and a surface washing agent on the microbial community and its functional capacity using 16S rRNA gene sequencing and metagenomics. Hydrocarbon removal rates were determined through total petroleum hydrocarbon analysis. Biostimulation is commonly considered the most effective strategy for enhancing the bioremediation process in response to oil contamination. However, our findings suggest that nutrient addition has limited effectiveness in facilitating the biodegradation process in Arctic beaches, despite its initial promotion of aliphatic hydrocarbons within a constrained timeframe. Alternatively, our study highlights the promise of a surface washing agent as a potential bioremediation approach. By implementing advanced -omics approaches, we unveiled highly proficient, unconventional hydrocarbon-degrading microorganisms such as Halioglobus and Acidimicrobiales genera.

Conclusions: Given the receding Arctic sea ice and the rising traffic in the NWP, heightened awareness and preparedness for potential oil spills are imperative. While continuously exploring optimal remediation strategies through the integration of microbial and chemical studies, a paramount consideration involves limiting traffic in the NWP and Arctic regions to prevent beach oil contamination, as cleanup in these remote areas proves exceedingly challenging and costly.

Keywords: Bioremediation; Biostimulation; High Arctic beaches; Hydrocarbon biodegradation; Hydrocarbon degrading microorganisms; Oil contamination; The Northwest Passage.


Conflict of interest statement

The authors declare that they have no competing interests.

Figures

Fig. 1
Fig. 1
Schematic design of robo-beach mesocosm experiments. The mesocosm Column Experiment I (CI) is depicted, with each treatment performed in triplicate (a). b A detailed illustration of the setup is provided, highlighting the integration of chemical-resistant connectors and tubes at the inlet, along with stainless connectors and Teflon tubes at the outlet to prevent chemical contamination and oil absorbance. Additionally, photographic evidence is displayed in c and d, demonstrating the actual status of columns and the solidification of loaded oil upon sediment contact at 8 °C. e A map illustrating the sampling site, Tupirvik beach, is provided, featuring coordinates and a corresponding photograph of the site
Fig. 2
Fig. 2
Microbial composition differences among five treatments in two column experiments following oil amendment are depicted. Heatmaps illustrate the 20 most prevalent genera detected in sediment samples obtained from CI and CII (a, b). 'S' denotes sediment, and the treatments are labeled as follows: no oil control (Control), oil only (Oil), oil with inorganic fertilizer, MAP (Oil MAP), oil with oleophilic fertilizer, S200 (Oil S200), and oil with both fertilizers (Oil MAP + S200) for CI; and no oil control (Control), oil only (Oil), oil with both fertilizers (Oil + N), oil with SWA (Oil + W), and oil with both fertilizers and SWA (Oil + N + W) for CII. '0' represents time 0, 'top' refers to surface sediment, and 'bottom' pertains to bottom sediment. The numbers indicate three biological replicates for each condition
Fig. 3
Fig. 3
The assessment of hydrocarbon removal efficiency through total petroleum hydrocarbon analysis in two column experiments. a The bar chart displays a comparison of hydrocarbon removal rates in Column Experiment I (CI) for treatments: oil only (Oil), oil with inorganic fertilizer, MAP (Oil MAP), oil with oleophilic fertilizer, S200 (Oil S200), and oil with both fertilizers (Oil MAP + S200). b The bar chart illustrates hydrocarbon removal rates for treatments in Column Experiment II (CII): oil only (Oil), oil with both fertilizers (Oil + N), oil with SWA (Oil + W), and oil with both fertilizers and SWA (Oil + N + W). In panel a, the " *" indicates a significant difference (p < 0.05, t-test) between the oil only group and the oil with both fertilizers group, while in panel b, the " *" denotes a significant difference across the four different treatments (p < 0.05, ANOVA)
Fig. 4
Fig. 4
Evaluating the hydrocarbon degradation capability of microbial communities from Arctic beach sediments after various treatments. a The metagenomes obtained from sediment samples in CI were analyzed using CANT-HYD to identify significant hydrocarbon degradation genes. The relative abundance of 5 key hydrocarbon degradation genes in CI and CII sediments was predicted using PICRUSt2 based on 16S rRNA gene amplicon sequencing data (b, c). The treatments are labeled as follows: CI—no oil control (Control), oil only (Oil), oil with inorganic fertilizer, MAP (Oil MAP), oil with oleophilic fertilizer, S200 (Oil S200), and oil with both fertilizers (Oil MAP + S200); CII—no oil control (Control), oil only (Oil), oil with both fertilizers (Oil + N), oil with SWA (Oil + W), and oil with both fertilizers and SWA (Oil + N + W). The labeling 'Sediment 0' denotes time 0, 'Sediment top' corresponds to surface sediment, and 'Sediment bottom' signifies bottom sediment. Additionally, the asterisks “*” and “***” indicate significant differences (p < 0.05, ANOVA and p < 0.001, respectively) among the four different treatments
Fig. 5
Fig. 5
Assessing phylogenetic information and hydrocarbon degradation pathways of 65 metagenome-assembled genomes (MAGs). a An unrooted phylogenetic tree was reconstructed to explore MAG diversity, with different colors representing various microbial taxonomic orders. Three inner circles indicate CANT-HYD HMM hits, contamination levels, and completeness. b The top 10 MAGs with abundant hydrocarbon degradation genes were selected to elucidate the aerobic alkane degradation pathway. The metabolic pathway of n-Hexadecane was reconstructed, and key enzymes involved in the degradation process were highlighted

References

    1. Bush EaL DS, editors: Canada’s Changing Climate Report. 2019.
    1. Zhang X, Vincent LA, Hogg WD, Niitsoo A. Temperature and precipitation trends in Canada during the 20th century. Atmos Ocean. 2000;38:395–429.
    1. Academies CoC: Canada’s Top Climate Change Risks, Ottawa (ON): The Expert Panel on Climate Change Risks and Adaptation Potential. 2019.
    1. Lemmen DS, Warren FJ, Lacroix J, Bush E, editors: From Impacts to Adaptation: Canada in a Changing Climate 2007. 2008.
    1. Tivy A, Howell SEL, Alt B, McCourt S, Chagnon R, Crocker G, Carrieres T, Yackel JJ. Trends and variability in summer sea ice cover in the Canadian Arctic based on the Canadian Ice Service Digital Archive, 1960–2008 and 1968–2008. J Geophys Res (Oceans). 2011;116:C03007.

LinkOut - more resources