. 2024 Oct 30;19(1):100.
doi: 10.1186/s13062-024-00541-7.

Characterization of gut microbiota dynamics in an Alzheimer's disease mouse model through clade-specific marker-based analysis of shotgun metagenomic data

Affiliations

Characterization of gut microbiota dynamics in an Alzheimer's disease mouse model through clade-specific marker-based analysis of shotgun metagenomic data

Francesco Favero et al. Biol Direct. .

Abstract

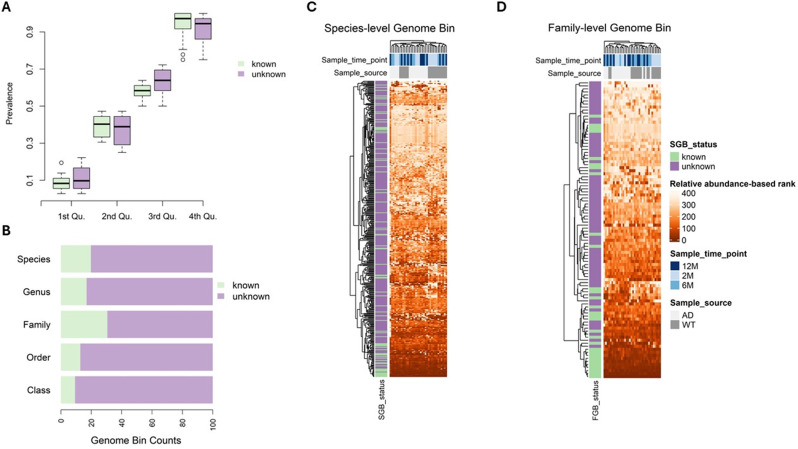
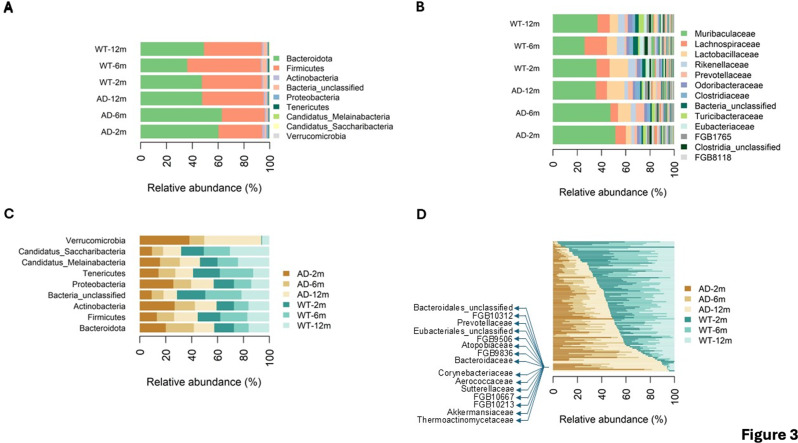
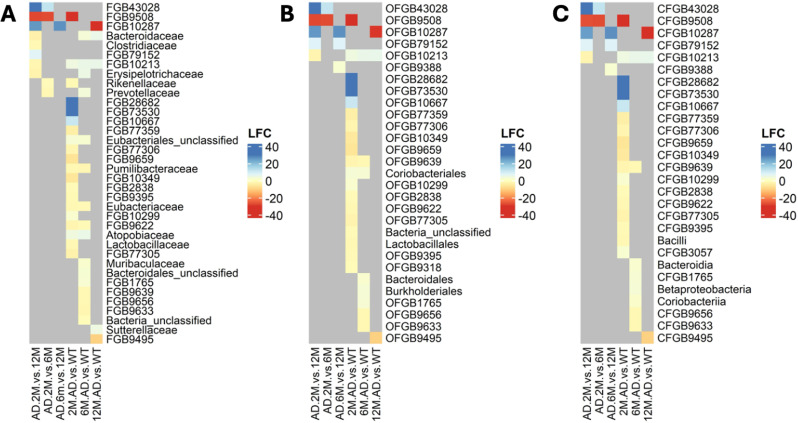
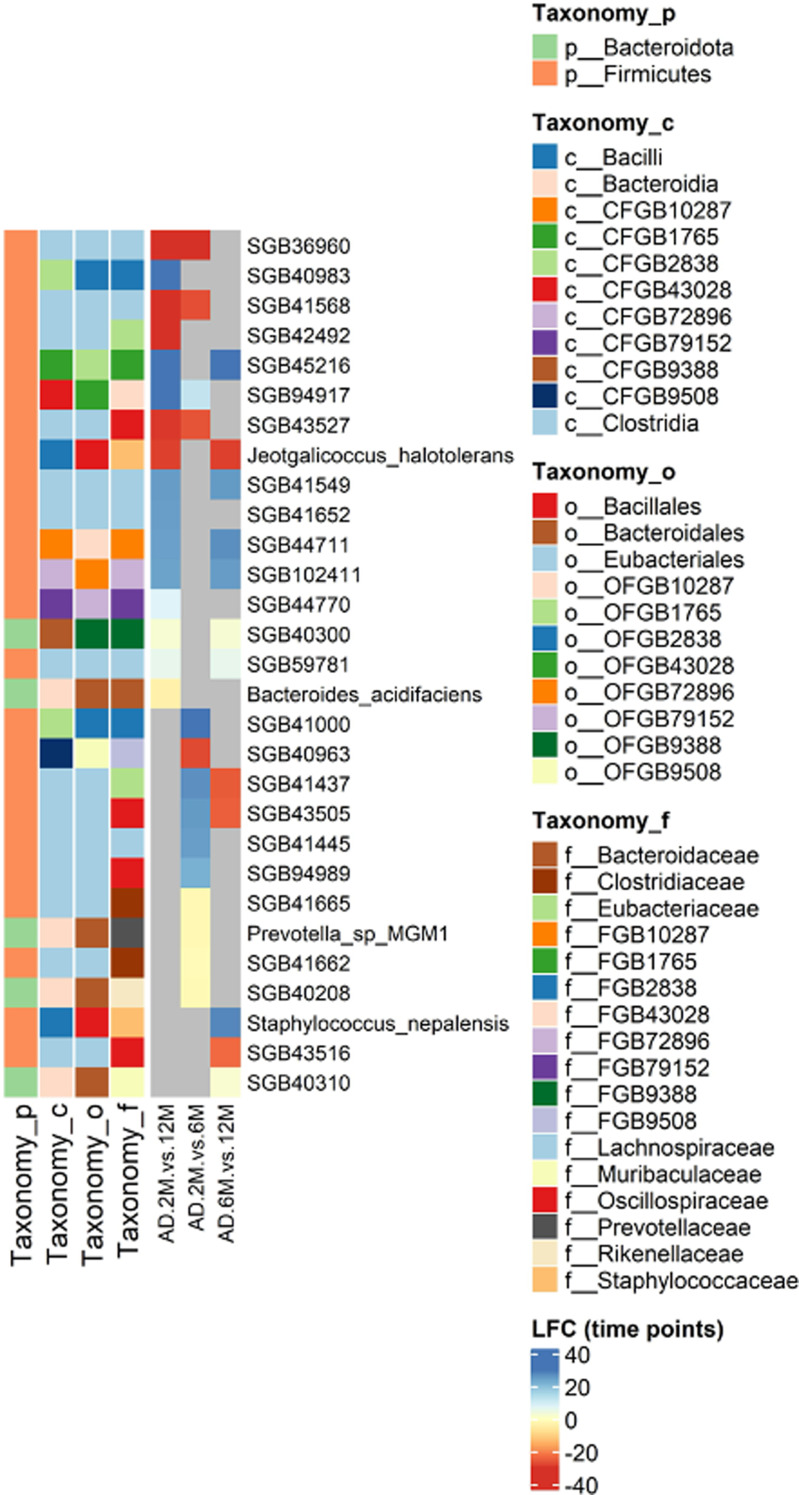
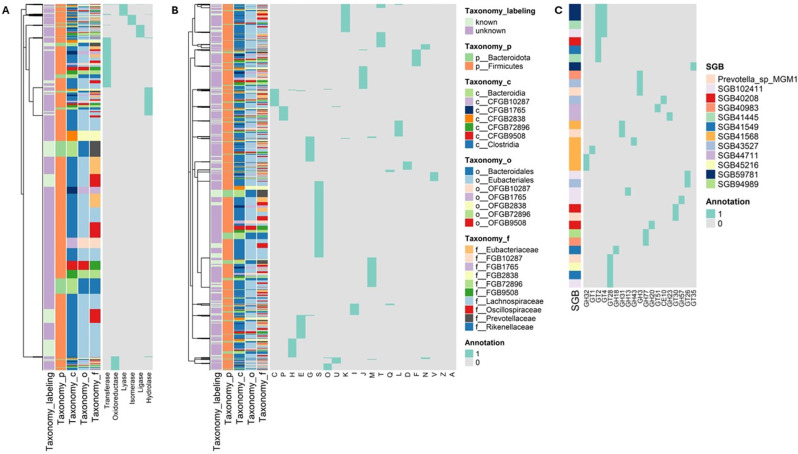
Alzheimer's disease (AD) is a complex neurodegenerative disorder significantly impairing cognitive faculties, memory, and physical abilities. To characterize the modulation of the gut microbiota in an in vivo AD model, we performed shotgun metagenomics sequencing on 3xTgAD mice at key time points (i.e., 2, 6, and 12 months) of AD progression. Fecal samples from both 3xTgAD and wild-type mice were collected, DNA extracted, and sequenced. Quantitative taxon abundance assessment using MetaPhlAn 4 ensured precise microbial community representation. The analysis focused on species-level genome bins (SGBs) including both known and unknown SGBs (kSGBs and uSGBs, respectively) and also comprised higher taxonomic categories such as family-level genome bins (FGBs), class-level genome bins (CGBs), and order-level genome bins (OGBs). Our bioinformatic results pinpointed the presence of extensive gut microbial diversity in AD mice and showed that the largest proportion of AD- and aging-associated microbiome changes in 3xTgAD mice concern SGBs that belong to the Bacteroidota and Firmicutes phyla, along with a large set of uncharacterized SGBs. Our findings emphasize the need for further advanced bioinformatic studies for accurate classification and functional analysis of these elusive microbial species in relation to their potential bridging role in the gut-brain axis and AD pathogenesis.

Keywords: 3xTgAD mice; Alzheimer’s disease; Gut microbiota; MetaPhlAn 4; Shotgun metagenomics.


Conflict of interest statement

The authors declare no competing interests.

Figures

Fig. 1
Fig. 1
Study design and experimental analysis framework. (A) Study design showing the experimental groups and time points for sample collection. WT and AD (3xTg) mice were sampled at two months (T1), six months (T2), and twelve months (T3). At each time point, a total of six samples (n = 6) were collected for both WT and AD mice. (B) Workflow illustrating the bioinformatics pipeline employed in the analysis
Fig. 2
Fig. 2
Prevalence of unknown taxa in MetaPhlAn 4 profiling of the mouse gut microbiome. (A) Taxonomically unlabeled species-level genome bins (SGBs) are widely distributed though the dataset samples. SGBs are categorized into quartiles according to their prevalence across the samples included in the dataset, and the proportions of known and unknown SGBs (kSGBs and uSGBs, respectively) in each quartile are comparatively assessed. kSGBs prevail over uSGBs (test of equal proportions, statistical significance set at p-values < 0.05) exclusively in the fourth quartile, which includes SGBs with prevalence ranging from 75 to 100% of samples. Conversely, in the third quartile, uSGBs dominate over kSGBs. (B) At taxonomic levels higher than species, the fraction of the mouse gut microbiome that remains taxonomically uncharacterized is substantial. The panel depicts the fractions of known and unknown genome bins detected across the entire dataset for each taxonomic level: species, genus, family, order, and class. (C, D) Taxonomically annotated SGBs tend to display higher relative abundance compared to SGBs that currently lack taxonomic annotation. The relative abundance of each genome bin is averaged across either AD or WT samples collected at each time point, and these average relative abundances are then converted into ranks for each time point, with higher average values corresponding to higher ranks. The heatmaps show the ranks for SGBs (C) and family-level genome bins (FGBs, D) at each sampled time point. Color codes shown in legend help distinguish known from unknown genome bins, AD from WT samples, as well as sampling time points
Fig. 3
Fig. 3
Compositional analysis of gut microbiome variations in AD and control samples at the phylum and family levels. (A) Bar plot showing phylum-level average relative abundances (in percent values) in AD microbiomes vs. their time-matched control counterparts. The Bacteroidota and Firmicutes phyla are predominantly observed across all conditions. On average for each condition, unclassified bacteria account for 2.3% of the relative abundances. (B) Bar plot showing family-level average relative abundances in AD microbiomes vs. their time-matched control counterparts. The Muribaculaceae, Lactobacillaceae, and Lachnospiraceae families collectively represent over 60% of the relative abundance in each condition. The color coding in the legend highlights the top 13 families ordered by average relative abundance for clarity. (C) Bar plot showing average relative abundances of each detected phylum across AD microbiomes and time-matched controls. (D) Average relative abundance of each detected family across AD microbiomes and time-matched controls. FGBs are ordered by relative abundance. Row labels for selected FGBs are shown to help identify the FGBs mentioned in the main text
Fig. 4
Fig. 4
Temporal profiling of relative abundances reveals consistent trends in AD SGBs. MetaPhlAn 4 profiling unveils consistent temporal trends in a few AD microbiome species, which comprises both SGBs and those yet to be classified. Species consistently increasing with AD mouse aging include Parvibacter caecicola and Neglectibacter sp. X4, while Candidatus Arthromitus sp. SFB-mouse and several uSGBs display a decreasing trend over time
Fig. 5
Fig. 5
AD-associated differentially abundant genome bins at family, order, and class taxonomic ranks. The figure depicts the differentially abundant genome bins identified from two assessments: differential abundance in AD relative to control samples at each sampled time point, and differential abundance between pairs of time points (2, 6, and 12 mos) in AD samples. The heatmaps arranged from left to right display the outcomes of these differential abundance tests at the family, order, and class level, respectively. In each heatmap, column labels outline the conditions compared. The tests for differential abundance in AD samples between pairs of time points are labeled as AD.2M.vs.12M, AD.2M.vs.6M, and AD.6M.vs.12M. Time-wise differential abundance tests are labeled as 2M.AD.vs.WT, 6M.AD.vs.WT, and 12M.AD.vs.WT. Row labels indicate the taxa that were found to be differentially abundant in at least one test. Changes in relative abundance are expressed as log2FC. Color coding represents the intensity in fold change, with grey indicating genome bins that did not show statistically significant variations in relative abundance under the compared conditions. A genome bin is deemed differentially abundant between two conditions if it features |log2FC| > 1 and a Benjamini-Hochberg’s adjusted p-value < 0.05
Fig. 6
Fig. 6
Time-associated differentially abundant SGBs. The figure shows the species genome bins that were identified as differentially abundant when comparing microbiome profiles between pairs of sampled time points (2, 6, and 12 mos) in AD samples. Differential abundance tests carried out in AD samples at T1 = 2M relative to T2 = 6M, at T1 = 2M relative to T3 = 12M, and at T2 = 6M relative to T3 = 12M are referred to as AD.2M.vs.12M, AD.2M.vs.6M, and AD.6M.vs.12M in the heatmap column labels. Row labels report the SGBs deemed differentially abundant over time. The vast majority of these SGBs do not align with any reference genome. The annotations on the left side of the heatmap categorize the differentially abundant SGBs by phylum, class, order, and family. Changes in relative abundance are reported as log2FC. Color coding indicates the intensity in fold change. Cells colored grey in the heatmap represent genome bins that did not show statistically significant changes in relative abundance between the tested temporal points. SGBs are deemed differentially abundant between two conditions if they feature a |log2FC| > 1 and a Benjamini-Hochberg’s adjusted p-value < 0.05
Fig. 7
Fig. 7
Most of the SGBs varying both between AD and WT and along AD temporal evolution are taxonomically uncharacterized. The heatmap shows the log2FC for SGBs that were differentially abundant in comparisons between AD and WT microbiomes at each sampled time point (2M.AD.vs.WT, 6M.AD.vs.WT, 12M.AD.vs.WT), and in comparisons of AD microbiomes between time points (AD.2M.vs.12M, AD.2M.vs.6M, and AD.6M.vs.12M). The differentially abundant SGBs are assigned to specific phylum and class ranks, shown in the left-sided annotation columns along with rank-specific legends. Changes in relative abundance are expressed as log2FC. Color coding reflects the intensity in fold change. Grey cells in the heatmap represent genome bins that did not show statistically significant changes in relative abundance between the assessed time points. An SGB is considered differentially abundant between two conditions if its |log2FC| > 1, and it has a Benjamini-Hochberg’s adjusted p-value < 0.05. The left-most panel shows the average relative abundance of the SGBs under each condition
Fig. 8
Fig. 8
Functional profiling of unique marker genes in differentially abundant SGBs suggests untapped functional diversity in AD microbiome profiling. The figure shows the functional characterization of SGBs identified as differentially abundant in comparisons of microbial composition between AD and WT samples, as well as across AD progression stages. To this end, the marker genes associated with the selected SGBs were assembled and analyzed using various sources of functional annotation. The classification of these differentially abundant SGBs into phylum, class, order, and family ranks is shown in the left-sided annotation columns, alongside rank-specific legends. (A) The heatmap categorizes the unique marker genes of these SGBs based on annotations retrieved from the ENZYME database. ENZYME main classes are reported as column labels. Cells are colored grey if a marker gene lacks annotations for a specific class. (B) Marker genes are also categorized according to the Clusters of Orthologous Genes (COG) database. COGs are reported as column labels. Cells are colored grey if a marker gene does not have a functional assignment to a specific COG. (C) Categorization of marker genes uniquely characterizing the differentially abundant SGBs according to the CAZy database, which provides biochemical information on carbohydrate-active enzymes (CAZymes). CAZyme families are reported as column labels. Cells are colored grey if a marker gene is not assigned to a specific CAZyme family. The heatmaps report only those EC numbers, COG categories, and CAZyme families predicted to be associated with the marker genes

References

    1. Long JM, Holtzman DM. Alzheimer Disease: an update on pathobiology and treatment strategies. Cell. 2019;179:312–39. - PMC - PubMed
    1. Selkoe DJ, Hardy J. The amyloid hypothesis of Alzheimer’s disease at 25 years. EMBO Mol Med. 2016;8:595–608. - PMC - PubMed
    1. Ossenkoppele R, van der Kant R, Hansson O. Tau biomarkers in Alzheimer’s disease: towards implementation in clinical practice and trials. Lancet Neurol. 2022;21:726–34. - PubMed
    1. Kim KR, Cho EJ, Eom JW, Oh SS, Nakamura T, Oh CK, Lipton SA, Kim YH. S-Nitrosylation of cathepsin B affects autophagic flux and accumulation of protein aggregates in neurodegenerative disorders. Cell Death Differ. 2022;29:2137–50. - PMC - PubMed
    1. Vitale I, Pietrocola F, Guilbaud E, Aaronson SA, Abrams JM, Adam D, Agostini M, Agostinis P, Alnemri ES, Altucci L, Amelio I, Andrews DW, Aqeilan RI, Arama E, Baehrecke EH, Balachandran S, Bano D, Barlev NA, Bartek J, Bazan NG, Becker C, Bernassola F, Bertrand MJM, Bianchi ME, Blagosklonny MV, Blander JM, Blandino G, Blomgren K, Borner C, Bortner CD, Bove P, Boya P, Brenner C, Broz P, Brunner T, Damgaard RB, Calin GA, Campanella M, Candi E, Carbone M, Carmona-Gutierrez D, Cecconi F, Chan FK, Chen GQ, Chen Q, Chen YH, Cheng EH, Chipuk JE, Cidlowski JA, Ciechanover A, Ciliberto G, Conrad M, Cubillos-Ruiz JR, Czabotar PE, D’Angiolella V, Daugaard M, Dawson TM, Dawson VL, De Maria R, De Strooper B, Debatin KM, Deberardinis RJ, Degterev A, Del Sal G, Deshmukh M, Di Virgilio F, Diederich M, Dixon SJ, Dynlacht BD, El-Deiry WS, Elrod JW, Engeland K, Fimia GM, Galassi C, Ganini C, Garcia-Saez AJ, Garg AD, Garrido C, Gavathiotis E, Gerlic M, Ghosh S, Green DR, Greene LA, Gronemeyer H, Häcker G, Hajnóczky G, Hardwick JM, Haupt Y, He S, Heery DM, Hengartner MO, Hetz C, Hildeman DA, Ichijo H, Inoue S, Jäättelä M, Janic A, Joseph B, Jost PJ, Kanneganti TD, Karin M, Kashkar H, Kaufmann T, Kelly GL, Kepp O, Kimchi A, Kitsis RN, Klionsky DJ, Kluck R, Krysko DV, Kulms D, Kumar S, Lavandero S, Lavrik IN, Lemasters JJ, Liccardi G, Linkermann A, Lipton SA, Lockshin RA, López-Otín C, Luedde T, MacFarlane M, Madeo F, Malorni W, Manic G, Mantovani R, Marchi S, Marine JC, Martin SJ, Martinou JC, Mastroberardino PG, Medema JP, Mehlen P, Meier P, Melino G, Melino S, Miao EA, Moll UM, Muñoz-Pinedo C, Murphy DJ, Niklison-Chirou MV, Novelli F, Núñez G, Oberst A, Ofengeim D, Opferman JT, Oren M, Pagano M, Panaretakis T, Pasparakis M, Penninger JM, Pentimalli F, Pereira DM, Pervaiz S, Peter ME, Pinton P, Porta G, Prehn JHM, Puthalakath H, Rabinovich GA, Rajalingam K, Ravichandran KS, Rehm M, Ricci JE, Rizzuto R, Robinson N, Rodrigues CMP, Rotblat B, Rothlin CV, Rubinsztein DC, Rudel T, Rufini A, Ryan KM, Sarosiek KA, Sawa A, Sayan E, Schroder K, Scorrano L, Sesti F, Shao F, Shi Y, Sica GS, Silke J, Simon HU, Sistigu A, Stephanou A, Stockwell BR, Strapazzon F, Strasser A, Sun L, Sun E, Sun Q, Szabadkai G, Tait SWG, Tang D, Tavernarakis N, Troy CM, Turk B, Urbano N, Vandenabeele P, Vanden Berghe T, Vander Heiden MG, Vanderluit JL, Verkhratsky A, Villunger A, von Karstedt S, Voss AK, Vousden KH, Vucic D, Vuri D, Wagner EF, Walczak H, Wallach D, Wang R, Wang Y, Weber A, Wood W, Yamazaki T, Yang HT, Zakeri Z, Zawacka-Pankau JE, Zhang L, Zhang H, Zhivotovsky B, Zhou W, Piacentini M, Kroemer G, Galluzzi L. Cell Death Differ. 2023;30:1097–154. Apoptotic cell death in disease-Current understanding of the NCCD 2023. - PMC - PubMed

LinkOut - more resources