. 2024 Oct 16:6:1393067.
doi: 10.3389/fspor.2024.1393067. eCollection 2024.

Back pain exercise therapy remodels human epigenetic profiles in buccal and human peripheral blood mononuclear cells: an exploratory study in young male participants

Affiliations

Back pain exercise therapy remodels human epigenetic profiles in buccal and human peripheral blood mononuclear cells: an exploratory study in young male participants

Claire Burny et al. Front Sports Act Living. .

Abstract

Background: With its high and increasing lifetime prevalence, back pain represents a contemporary challenge for patients and healthcare providers. Monitored exercise therapy is a commonly prescribed treatment to relieve pain and functional limitations. However, the benefits of exercise are often gradual, subtle, and evaluated by subjective self-reported scores. Back pain pathogenesis is interlinked with epigenetically mediated processes that modify gene expression without altering the DNA sequence. Therefore, we hypothesize that therapy effects can be objectively evaluated by measurable epigenetic histone posttranslational modifications and proteome expression. Because epigenetic modifications are dynamic and responsive to environmental exposure, lifestyle choices-such as physical activity-can alter epigenetic profiles, subsequent gene expression, and health traits. Instead of invasive sampling (e.g., muscle biopsy), we collect easily accessible buccal swabs and plasma. The plasma proteome provides a systemic understanding of a person's current health state and is an ideal snapshot of downstream, epigenetically regulated, changes upon therapy. This study investigates how molecular profiles evolve in response to standardized sport therapy and non-controlled lifestyle choices.

Results: We report that the therapy improves agility, attenuates back pain, and triggers healthier habits. We find that a subset of participants' histone methylation and acetylation profiles cluster samples according to their therapy status, before or after therapy. Integrating epigenetic reprogramming of both buccal cells and peripheral blood mononuclear cells (PBMCs) reveals that these concomitant changes are concordant with higher levels of self-rated back pain improvement and agility gain. Additionally, epigenetic changes correlate with changes in immune response plasma factors, reflecting their comparable ability to rate therapy effects at the molecular level. We also performed an exploratory analysis to confirm the usability of molecular profiles in (1) mapping lifestyle choices and (2) evaluating the distance of a given participant to an optimal health state.

Conclusion: This pre-post cohort study highlights the potential of integrated molecular profiles to score therapy efficiency. Our findings reflect the complex interplay of an individual's background and lifestyle upon therapeutic exposure. Future studies are needed to provide mechanistic insights into back pain pathogenesis and lifestyle-based epigenetic reprogramming upon sport therapy intervention to maintain therapeutic effects in the long run.

Keywords: back pain; biomarker; data integration; epigenetics; histone modifications; lifestyle exposome; plasma proteome; sport therapy.


Conflict of interest statement

CB, MP, NM, SS, MG, VS-M, and MV-A were employees of EpiQMAx GmbH. MP, SS, and MV-A are employees of MOLEQLAR Analytics GmbH. AH, SG, MH, and FS are employees of FPZ GmbH.

Figures

Figure 1
Figure 1
Study flow chart. (A) Participants underwent high-intensity training for trunk muscles. Their blood and buccal swabs were collected before and after completion of 24 therapy sessions. (B) Subjects’ characteristics. (C) Analytical workflow.
Figure 2
Figure 2
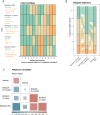
Latent lifestyle categorization reveals similar patterns of answers. (A) Lifestyle sequence plot with respective categories (legend, y-axis), obtained from partitioning around medoids clustering, colored-coded from less healthy (orange) to healthier (green) for each participant (x-axis). Participants are ranked by increased Gower distance to the healthier participant (labeled as 1). (B) Alluvial plot displaying the cohort's back pain history over 1 year, 3 months, and at entry of the therapy (x-axis). A participant's trajectory is represented as an alluvial. Longitudinal clustering of the cohort's back pain history indicates four categories: mild/recovering (n = 5), fluctuating (n = 4), severe/chronic (n = 2), and worsening (n = 1). (C) Pairwise polychoric correlation matrix indicating dependence between different lifestyle components. The squares’ areas are proportional to the absolute value of the correlation coefficient for the given pairwise comparison and the color indicates the sign, either negative (blue) or positive (red) correlation.
Figure 3
Figure 3
Agility metrics changes and back pain self-assessment reflect adverse therapy effects that depend on lifestyle. (A) All participants responded positively to the therapy. Interquartile range (intervals) and median percentage of improvement (segments) for respective agility metrics (x-axis) revealed moderate, intermediate, and max (light to dark blue, respectively) performance after the therapy (y-axis). One dot represents one participant, whose classification was obtained from baseline-adjusted agility metrics (using paired flexion, extension, and rotation measurements), applying the Gaussian mixture modeling framework. (B) Boxplot of the average number of weekly therapy sessions (y-axis) over performance categories (x-axis) across participants (dots), with reported Kruskall–Wallis test and ANOVA outcome. (C) Alluvial plot displays changes in self-rated back pain (x-axis) before (BT) and after (AT) therapy [Friedman χ2 (1) = 0.67, p = 0.41]. (D) Contingency matrix between performance (x-axis) and self-assessment categories (stacked y-axis, color-coded) is displayed as a bar plot (no statistically significant association; Fisher's exact test; p = 0.67). Self-assessment indicates individual changes in back pain status upon therapy: improving, unimpaired (back pain remains minor), stagnating, worsening. (E) Similar to (B) but stratified by self-assessment. (F) Sunburst chart sliced by categories of back pain, self-assessment describing self-rated physical capacity (inner ring), and well-being (outer ring) gain, each measured on a 0–5 scale. Non-parametric Friedman test reports a significant improvement of both scores upon therapy [χ2 (1) = 9, p = 2.70 × 10−3, and χ2 (1) = 7, p = 8.15 × 10−3, respectively].
Figure 4
Figure 4
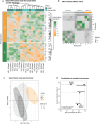
Histone epigenetic markers’ distribution reflects the therapy status of the participants. (A) Heatmap of scaled relative abundances of histone posttranslational modifications (PTMs). Hierarchical clustering on rows (samples, unpaired annotated with an asterisk) and columns (histone PTMs) reflects the status of the participant, before (BT, orange) or after (AT, green) therapy. The origin of the markers is color-coded on top of the columns (from PBMCs dark turquoise and from swabs light turquoise). (B) Fused pairwise participants affinity matrix elucidated complementary information from both swab and PBMC epigenetic affinity matrices using the similarity network fusion (SNF) algorithm. The similarity matrix diagonal has been set to the median value of the entire matrix. The color of the cell indicates increased similarity, from gray to green. Spectral clusters’ belonging is indicated in gray or orange shade. (C) Participant factor maps from MFA performed from (1) performance, (2) self-assessment, (3) lifestyle, and (4) back pain history groups of variables using spectral clusters class as illustrative variables (color-coded). COVID-19 infection during the therapy period is indicated as an asterisk. (D) The coordinates of the variable groups illustrate correlation with the first two MFA dimensions; top (i.e., above uniform) active (round-shaped) contributors are represented by the dotted lines per dimension.
Figure 5
Figure 5
Fold change patterns of protein markers accurately predict therapy status and therapy response. (A) Heatmap of scaled proteomic markers’ abundances identified in the plasma. We performed hierarchical clustering on the rows and columns. The rows are labeled by the leading protein of the protein group, and the columns indicate the status of the samples before (BT) and after (AT) the therapy. Participants annotated with an asterisk submitted only BT samples. Unsupervised clustering reflects the status of the samples. The two clusters of proteins with either an average positive or a negative log2-fold change (LFC) are annotated with the 10 most representative UniProt keywords. (B,C) Per marker, we computed the average LFC (y-axis) over physical performance or self-assessed therapy effect categories (x-axis), respectively. After having clustered markers’ LFC based on their shape, a subset of markers displays a linear trend (increasing, dashed gray or decreasing, full gray line) or a plateau (first two categories, full black line or last two categories, dashed black line). The light orange and green backgrounds indicate the sign of the LFC, negative and positive, respectively. (D,E) Heatmap of scaled LFC per participant (columns) ordered by physical performance or self-rated back pain categories, using the subset of markers defined in (B,C), respectively. Per marker, LFC values have been centered using either the mean over categories (linear trends) or the plateau mean (plateaus), normalized between 0 (gray) and 1 (green).
Figure 6
Figure 6
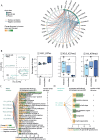
Epigenetic–proteome interactions reflect multilevel changes upon therapy. (A) Data Integration Analysis for Biomarker discovery using Latent variable approaches for Omics studies (DIABLO) maximizes the correlation between changes in epigenetic (swab and PBMC) and proteomic markers upon therapy. The correlation networks represent strong (above 0.7 absolute value) positive (red) and negative (blue) correlation between epigenetic (2 swab markers, 6 PBMC markers) and proteomic (27 markers) datasets. The LFC/percentage of change of each proteomic/epigenetic marker is encoded by a green-to-orange dot, from increase to decrease upon therapy. (B) Principal component analysis (PCA) 2D map from the percentage of change of the above eight epigenetic markers. The 2D map quadrants represent different PTM effect size trends over back pain self-assessment categories [see example inset boxplots; (1) plateau-like with the highest percentage of change, (2) pseudo-linear, or (3) complex inverted U-shape]. (C,D) GO biological process (BP) annotation of the 27 protein markers highlighted by the functional DIABLO analysis separately for PBMC (C) and buccal cell (D) markers. GO terms whose annotated GO BP terms match 3 or more connexions were considered and only reduced GO BP terms are represented (y-axis) and ranked by their corresponding number of annotated protein groups (x-axis) and by the GO hierarchy.
Figure 7
Figure 7
Health awareness indicators change consistently upon therapy across biological samples but reflect cohort variability. (A) 2D-variate PLS-DA map from BT plasma profiles using exercise categories as outcome (color-code in the legend). Participant consists of two points: initial BT position (round-shaped) and AT position (square-shaped) after the projection of the AT profile in the map, connected by an arrow. (B) Bump chart representing the participants’ ranks (y-axis) from increased therapy effect size [i.e., arrow length in (A)] across sample types (x-axis) from exercise categories. Connecting lines are colored from each participant's BT category. The dashed line indicates that the participant switched categories upon therapy. Pairwise concordance Kendall's values are reported across biological raters. Overall, the test reports a marginally significant difference across raters [W = 0.68, χ2 (10) = 0.5, p = 2.50 × 10−2]. (C) Radar chart from participant ID 12 PBMC datasets BT (left) and AT (right) from exercise class markers (x-axis). Clockwise, we ordered health awareness indicators from decreasing distance (normalized markers values represented as a black line, y-axis) to the healthy range (green ribbon, median as a plain line). The orange/green line indicates the point when indicators display discrepancy with the healthy range, BT and AT, respectively. The more within the upper right quadrant, the more similar the profile is to the healthier category of participants. (D) Per biological sample (x-axis) and lifestyle component (facet), the bar chart represents the number of participants (y-axis) whose number of markers within the healthy range increased upon therapy. P-values of paired t-tests from weighted similarity to healthy range BT and AT after Benjamini–Hochberg correction are encoded as follows: “n.s.” and “*,” “**,” “***,” and α, respectively, set to >0.1, 0.1, 0.05, and 0.01. (E) Conceptual representation of (in)direct association between therapy attendance (orange arrow) and health outcome (green), mediated by lifestyle, and correlated changes of epigenetic and proteomic (light blue). The individual background (gray) may introduce confounding at any level.

Similar articles

References

    1. Garber CE, Blissmer B, Deschenes MR, Franklin BA, Lamonte MJ, Lee IM, et al. Quantity and quality of exercise for developing and maintaining cardiorespiratory, musculoskeletal, and neuromotor fitness in apparently healthy adults: guidance for prescribing exercise. Med Sci Sports Exerc. (2011) 43(7):1334–59. 10.1249/MSS.0B013E318213FEFB - DOI - PubMed
    1. Wåhlén K, Yan H, Welinder C, Ernberg M, Kosek E, Mannerkorpi K, et al. Proteomic investigation in plasma from women with fibromyalgia in response to a 15-wk resistance exercise intervention. Med Sci Sports Exerc. (2022) 54(2):232. 10.1249/MSS.0000000000002790 - DOI - PMC - PubMed
    1. Husky MM, Ferdous Farin F, Compagnone P, Fermanian C, Kovess-Masfety V. Chronic back pain and its association with quality of life in a large French population survey. Health Qual Life Outcomes. (2018) 16(1):195. 10.1186/S12955-018-1018-4/TABLES/5 - DOI - PMC - PubMed
    1. Yu Z, Yin Y, Wang J, Zhang X, Cai H, Peng F. Efficacy of pilates on pain, functional disorders and quality of life in patients with chronic low back pain: a systematic review and meta-analysis. Int J Environ Res Public Health. (2023) 20:4. 10.3390/IJERPH20042850/S1 - DOI - PMC - PubMed
    1. Hartvigsen J, Hancock MJ, Kongsted A, Louw Q, Ferreira ML, Genevay S, et al. What low back pain is and why we need to pay attention. Lancet. (2018) 391(10137):2356–67. 10.1016/S0140-6736(18)30480-X - DOI - PubMed

LinkOut - more resources